
BIO 223L Notes, Fall 2011
American University of Beirut · Genetics Laboratory · 88 pages
Showing the first 10 of 88 pages. Download the PDF to see all of it.
Show the text of this notes
BIOL 223
Genetics Laboratory Manual
2010-2011
Biology Department
American University of Beirut
Contributions by Layane Hajjar & Colin Smith
Edited by Nadine Darwiche, Hana Ibrahim, & Colin Smith
Coordinated by Hala Gali-Muhtasib
Cover image: Drosophila melanogaster mitochondrial ND1 gene fragment
with translations.
Acknowledgments
Jimmy Asraoui for assistance with dipteran phylogeny resources
Khouzama Knio for Drosophila figures
1
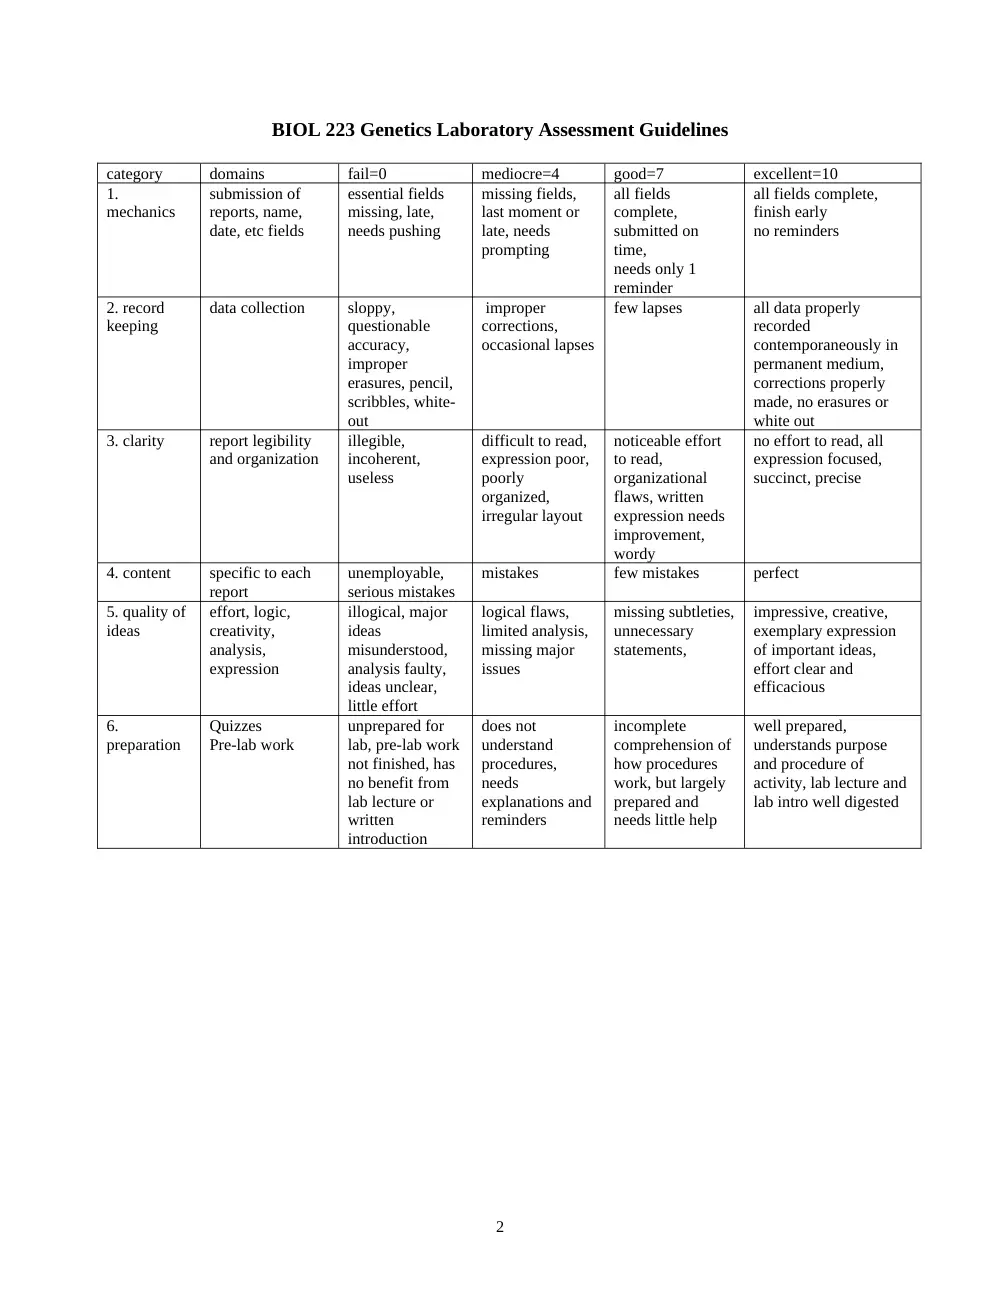
BIOL 223 Genetics Laboratory Assessment Guidelines
category
domains
fail=0
mediocre=4
good=7
excellent=10
1.
mechanics
submission of
reports, name,
date, etc fields
essential fields
missing, late,
needs pushing
missing fields,
last moment or
late, needs
prompting
all fields
complete,
submitted on
time,
needs only 1
reminder
all fields complete,
finish early
no reminders
2. record
keeping
data collection
sloppy,
questionable
accuracy,
improper
erasures, pencil,
scribbles, white-
out
improper
corrections,
occasional lapses
few lapses
all data properly
recorded
contemporaneously in
permanent medium,
corrections properly
made, no erasures or
white out
3. clarity
report legibility
and organization
illegible,
incoherent,
useless
difficult to read,
expression poor,
poorly
organized,
irregular layout
noticeable effort
to read,
organizational
flaws, written
expression needs
improvement,
wordy
no effort to read, all
expression focused,
succinct, precise
4. content
specific to each
report
unemployable,
serious mistakes
mistakes
few mistakes
perfect
5. quality of
ideas
effort, logic,
creativity,
analysis,
expression
illogical, major
ideas
misunderstood,
analysis faulty,
ideas unclear,
little effort
logical flaws,
limited analysis,
missing major
issues
missing subtleties,
unnecessary
statements,
impressive, creative,
exemplary expression
of important ideas,
effort clear and
efficacious
6.
preparation
Quizzes
Pre-lab work
unprepared for
lab, pre-lab work
not finished, has
no benefit from
lab lecture or
written
introduction
does not
understand
procedures,
needs
explanations and
reminders
incomplete
comprehension of
how procedures
work, but largely
prepared and
needs little help
well prepared,
understands purpose
and procedure of
activity, lab lecture and
lab intro well digested
2
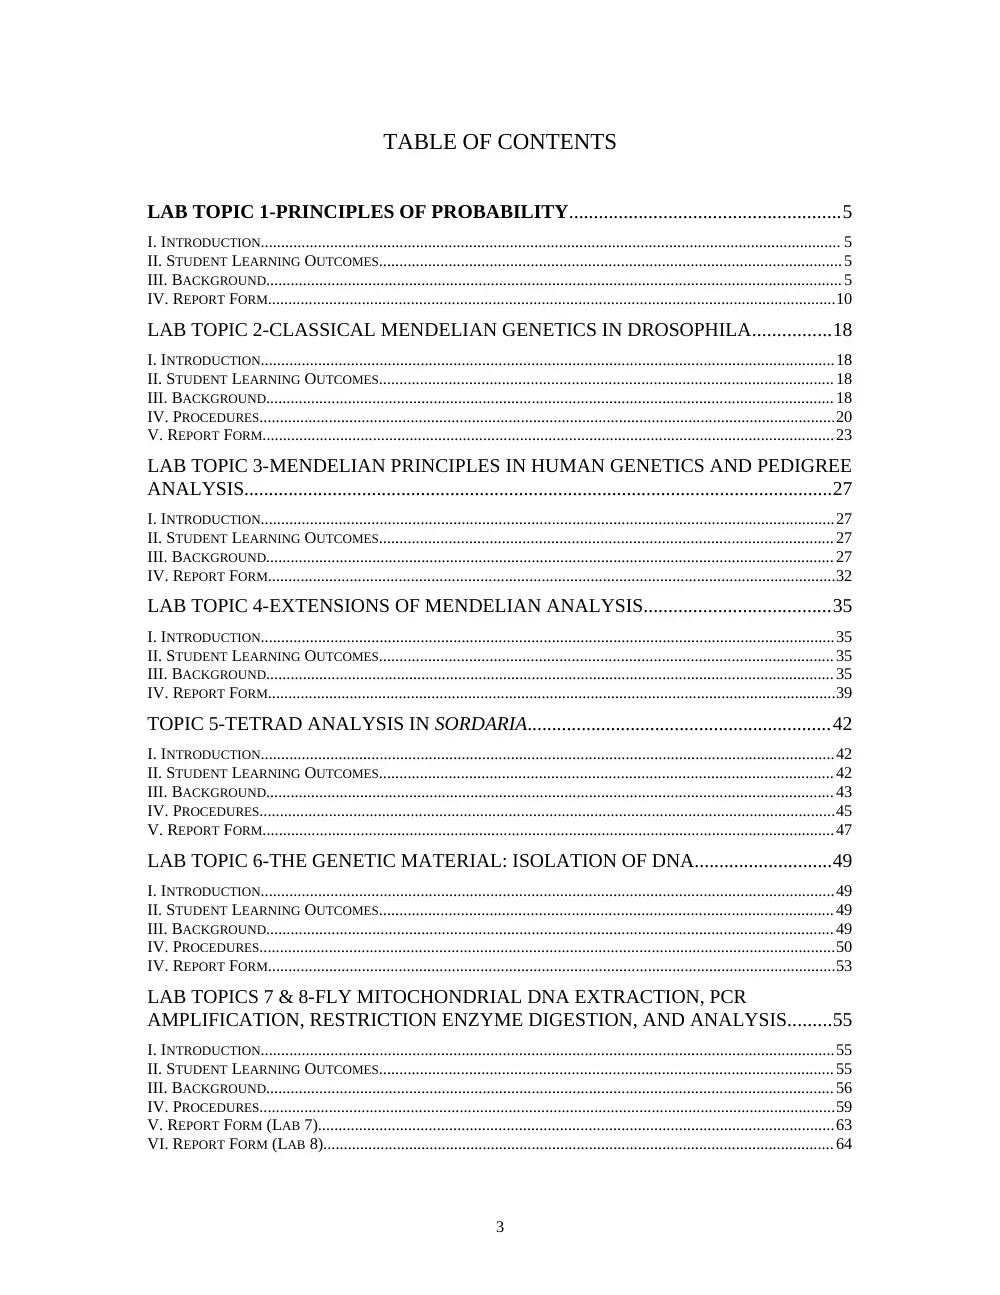
TABLE OF CONTENTS
LAB TOPIC 1-PRINCIPLES OF PROBABILITY.......................................................5
I. INTRODUCTION.............................................................................................................................................. 5
II. STUDENT LEARNING OUTCOMES.................................................................................................................5
III. BACKGROUND.............................................................................................................................................5
IV. REPORT FORM...........................................................................................................................................10
LAB TOPIC 2-CLASSICAL MENDELIAN GENETICS IN DROSOPHILA................18
I. INTRODUCTION............................................................................................................................................18
II. STUDENT LEARNING OUTCOMES...............................................................................................................18
III. BACKGROUND...........................................................................................................................................18
IV. PROCEDURES.............................................................................................................................................20
V. REPORT FORM............................................................................................................................................23
LAB TOPIC 3-MENDELIAN PRINCIPLES IN HUMAN GENETICS AND PEDIGREE
ANALYSIS........................................................................................................................27
I. INTRODUCTION............................................................................................................................................27
II. STUDENT LEARNING OUTCOMES...............................................................................................................27
III. BACKGROUND...........................................................................................................................................27
IV. REPORT FORM...........................................................................................................................................32
LAB TOPIC 4-EXTENSIONS OF MENDELIAN ANALYSIS......................................35
I. INTRODUCTION............................................................................................................................................35
II. STUDENT LEARNING OUTCOMES...............................................................................................................35
III. BACKGROUND...........................................................................................................................................35
IV. REPORT FORM...........................................................................................................................................39
TOPIC 5-TETRAD ANALYSIS IN SORDARIA..............................................................42
I. INTRODUCTION............................................................................................................................................42
II. STUDENT LEARNING OUTCOMES...............................................................................................................42
III. BACKGROUND...........................................................................................................................................43
IV. PROCEDURES.............................................................................................................................................45
V. REPORT FORM............................................................................................................................................47
LAB TOPIC 6-THE GENETIC MATERIAL: ISOLATION OF DNA............................49
I. INTRODUCTION............................................................................................................................................49
II. STUDENT LEARNING OUTCOMES...............................................................................................................49
III. BACKGROUND...........................................................................................................................................49
IV. PROCEDURES.............................................................................................................................................50
IV. REPORT FORM...........................................................................................................................................53
LAB TOPICS 7 & 8-FLY MITOCHONDRIAL DNA EXTRACTION, PCR
AMPLIFICATION, RESTRICTION ENZYME DIGESTION, AND ANALYSIS.........55
I. INTRODUCTION............................................................................................................................................55
II. STUDENT LEARNING OUTCOMES...............................................................................................................55
III. BACKGROUND...........................................................................................................................................56
IV. PROCEDURES.............................................................................................................................................59
V. REPORT FORM (LAB 7)..............................................................................................................................63
VI. REPORT FORM (LAB 8).............................................................................................................................64
3
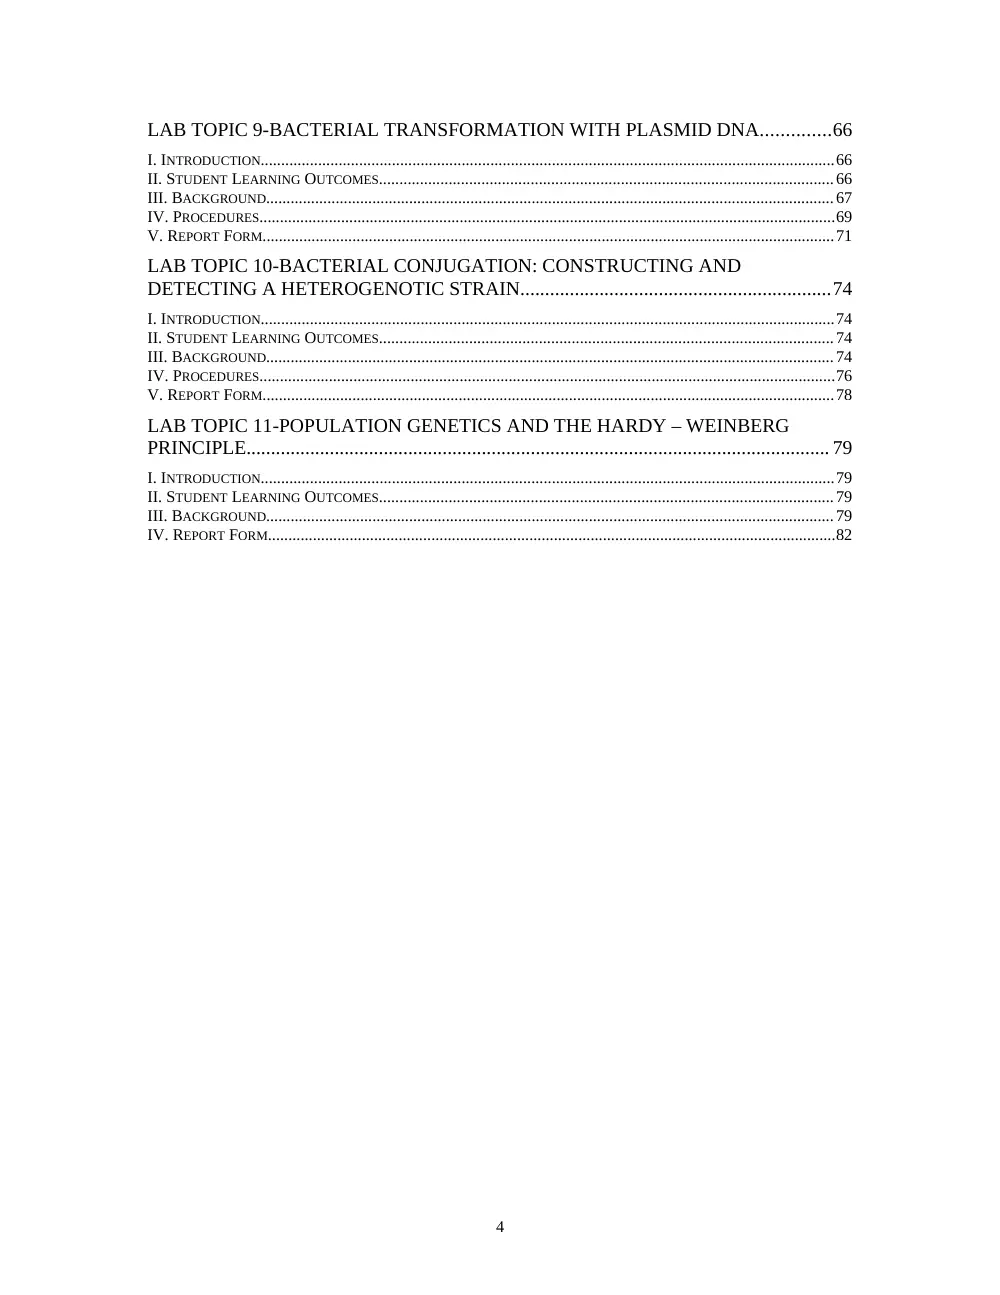
LAB TOPIC 9-BACTERIAL TRANSFORMATION WITH PLASMID DNA..............66
I. INTRODUCTION............................................................................................................................................66
II. STUDENT LEARNING OUTCOMES...............................................................................................................66
III. BACKGROUND...........................................................................................................................................67
IV. PROCEDURES.............................................................................................................................................69
V. REPORT FORM............................................................................................................................................71
LAB TOPIC 10-BACTERIAL CONJUGATION: CONSTRUCTING AND
DETECTING A HETEROGENOTIC STRAIN...............................................................74
I. INTRODUCTION............................................................................................................................................74
II. STUDENT LEARNING OUTCOMES...............................................................................................................74
III. BACKGROUND...........................................................................................................................................74
IV. PROCEDURES.............................................................................................................................................76
V. REPORT FORM............................................................................................................................................78
LAB TOPIC 11-POPULATION GENETICS AND THE HARDY – WEINBERG
PRINCIPLE....................................................................................................................... 79
I. INTRODUCTION............................................................................................................................................79
II. STUDENT LEARNING OUTCOMES...............................................................................................................79
III. BACKGROUND...........................................................................................................................................79
IV. REPORT FORM...........................................................................................................................................82
4
Lab Topic 1
Lab Topic 1-Principles of Probability
Colin Smith and Layane Hajjar
I. Introduction
The laws of probability can be used to predict the likelihood of chance events, where
there is a limited number of outcomes. The coin toss is a simple example. When a coin is
tossed into the air and allowed to come to rest, it may land showing either face, but the
complexity of the toss makes it impossible to control or predict how it will land. For
every toss, one of two faces will show: the obverse "heads" (H), or the reverse "tails" (T).
The expectation is that for each toss, the two outcomes have equal probability, and that
with sufficient tosses the observations will approach a limit of 0.5 H and 0.5 T. Similarly,
when a cubic die is rolled, there is a 1/6 chance of arriving at any one of the six numbers
marked on the different faces of the die.
Statistical tests examine whether the difference between observations and expectations
are likely due to chance, where the expectations derive from probability calculations of a
theoretical model.
In the first part of this laboratory exercise, you will examine a shaved die, conceive a
hypothesis as to how its rolling will be altered, formulate a prediction to test your
hypothesis, collect data, and apply statistical tests to find the probability your hypothesis
is false. You will also compare your observations to those predicted by Poisson. In the
second part, you will sample a large population of beads, test whether it is a good
representation of the population, and then use beads to model gene distribution.
II. Student Learning Outcomes
In completing this activity, students should be able to:
-
Explain and give an example of an event governed by chance.
-
Explain and correctly use the binomial and Poisson probability distributions.
-
Properly state a hypothesis and formulate a simple prediction of it.
-
Collect and record data properly.
-
Use Chi-square analysis to find the probability a prediction is wrong.
-
Test whether or not a sample is a good representative of a population.
III. Background
A. Probability and Genetics
A simple, practical definition of the probability is that the probability of an event
happening, P(E), is the ratio of the number of individual outcomes resulting in event E
divided by total number of possible outcomes. This assumes all outcomes are equally
likely, which is generally true for situations occurring in genetics.
Example: in tossing 2 coins, the probability of the event of having one H and one T is
2/4, because there are four possible outcomes, and 2 are successful (HH, HT, TH, TT),
meaning they result in the event being examined (one H and one T).
5
Lab Topic 1
1. The Additive Law of Probability
If E1 and E2 are mutually exclusive events, meaning the occurrence of one event prevents
the occurrence of the second event, the probability that either one of them will happen is
the sum of their individual probabilities. One must be careful not to incorrectly assign
events as mutually exclusive.
P(E1 or E2)= P(E1) + P(E2)
Example: P(H1T2 or H2T1)=
In genetics, we often apply the addition rule without realizing:
Aa x Aa
Another genetic example involves dihybrid crosses
AaBb x AaBb
2. The Multiplicative Law of Probability
If E1 and E2 are independent events, meaning the occurrence of one event does not affect
the chance of occurrence of the second event, the probability that they will both happen
is the product of their individual probabilities
P(E1 and E2) = P(E1) x P(E2)
Example: P (HT) =
One genetic application: consider the genotype AaBbCcDd
What proportion of all gametes from such individuals will consist of the
genotype ABCD?
These rules of probability can be used to mathematically predict the expected outcome of
a genetic cross. The multiplication rule for independent events applies whenever
nonallelic gene pairs are randomly associated in the gametes produced by the parents.
For example, consider the dihybrid cross AaBbCcDd x AaBbCcDd:
What proportion of the progeny of this cross is expected to be A-B-C-D- in phenotype?
B. Probability Distributions
1. Binomial Distribution
Sometimes, it is useful to determine probabilities associated with repeated trials. For
instance, when a coin is tossed many times or many coins are tossed at the same time, we
can determine the probability of y successful events (such as heads) to be expected from
n trials (coin tosses), knowing what the probability is for possible individual outcomes
(0.5 H per coin per toss).
If 2 mutually exclusive outcomes are possible for a given trial, then p is the probability of
the outcome considered successful, and q is the probability of the outcome considered
failure, and since p + q = 1; the binomial equation is used:
6
Lab Topic 1
P(E) = f(n, y) = n!p
y q (n-y)
Where
y!(n-y)!
P(E) = the probability that there will be y successful events in n trials
n is the number of trials
y = the number of successes in n trials, the probability of which is
calculated by the function for each y of interest, y = 0, 1, 2, 3... n
p is the probability of a successful outcome in a single trial, q is the
probability of failure
An example: If 4 babies are born in a maternity ward the same night, what is the
probability of no girls, 1 girl, 2 girls, 3 girls, 4 girls? Assuming girls and boys equally
likely (not necessarily true) and considering girl success and boy failure, p = 0.5, q = 0.5,
n = 4 because there are 4 trials (births), and y ranges from 0 to 4 (0 to 4 girls are
possible):
P(E) = f(y) = 4!0.5
y 0.5
(4-y)
y!(4-y)!
y = 0, P = 1/16
y = 1, P = 4/16
y = 2, P = 6/16
y = 3, P = 4/16
y = 4, P = 1/16
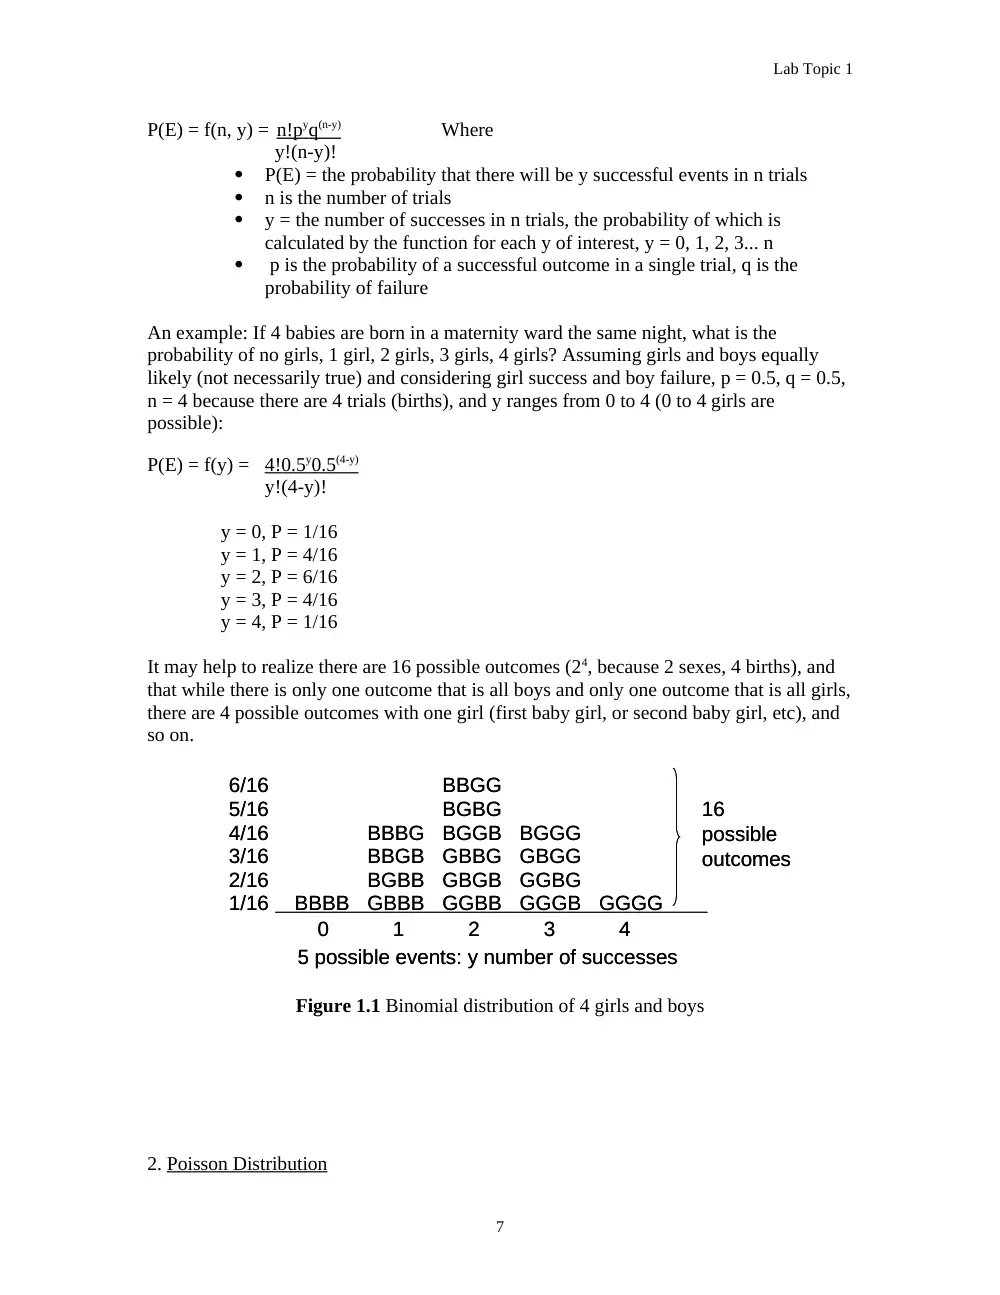
It may help to realize there are 16 possible outcomes (24, because 2 sexes, 4 births), and
that while there is only one outcome that is all boys and only one outcome that is all girls,
there are 4 possible outcomes with one girl (first baby girl, or second baby girl, etc), and
so on.
Figure 1.1 Binomial distribution of 4 girls and boys
2. Poisson Distribution
BBBB
GGGG
GBBB
BGBB
BBGB
BBBG
GGGB
GGBG
GBGG
BGGG
GGBB
GBGB
BGBG
GBBG
BGGB
BBGG
0
1
2
3
4
1/16
2/16
3/16
4/16
5/16
6/16
5 possible events: y number of successes
16
possible
outcomes
BBBB
GGGG
GBBB
BGBB
BBGB
BBBG
GGGB
GGBG
GBGG
BGGG
GGBB
GBGB
BGBG
GBBG
BGGB
BBGG
0
1
2
3
4
1/16
2/16
3/16
4/16
5/16
6/16
5 possible events: y number of successes
16
possible
outcomes
7
Lab Topic 1
The Poisson distribution expresses the probability of the number of events in a given
period of time or sample size, based on a known average frequency. When the average
probability (p) of an event is rare (such as a specific mutation) in the sample size (such as
a large region of DNA or many DNAs), the Poisson distribution becomes useful. The
Poisson distributions can be derived from the Binomial distribution.
P(E) = f(y,λ) = e - λ λ y
y!
P(E) = the probability that there will be y successes
e = base of natural logarithm
y = the number of successes, the probability of which is calculated by the
function for each y of interest, y = 0, 1, 2, 3...
λ = the expected number of occurrences during the given interval, a
positive real number
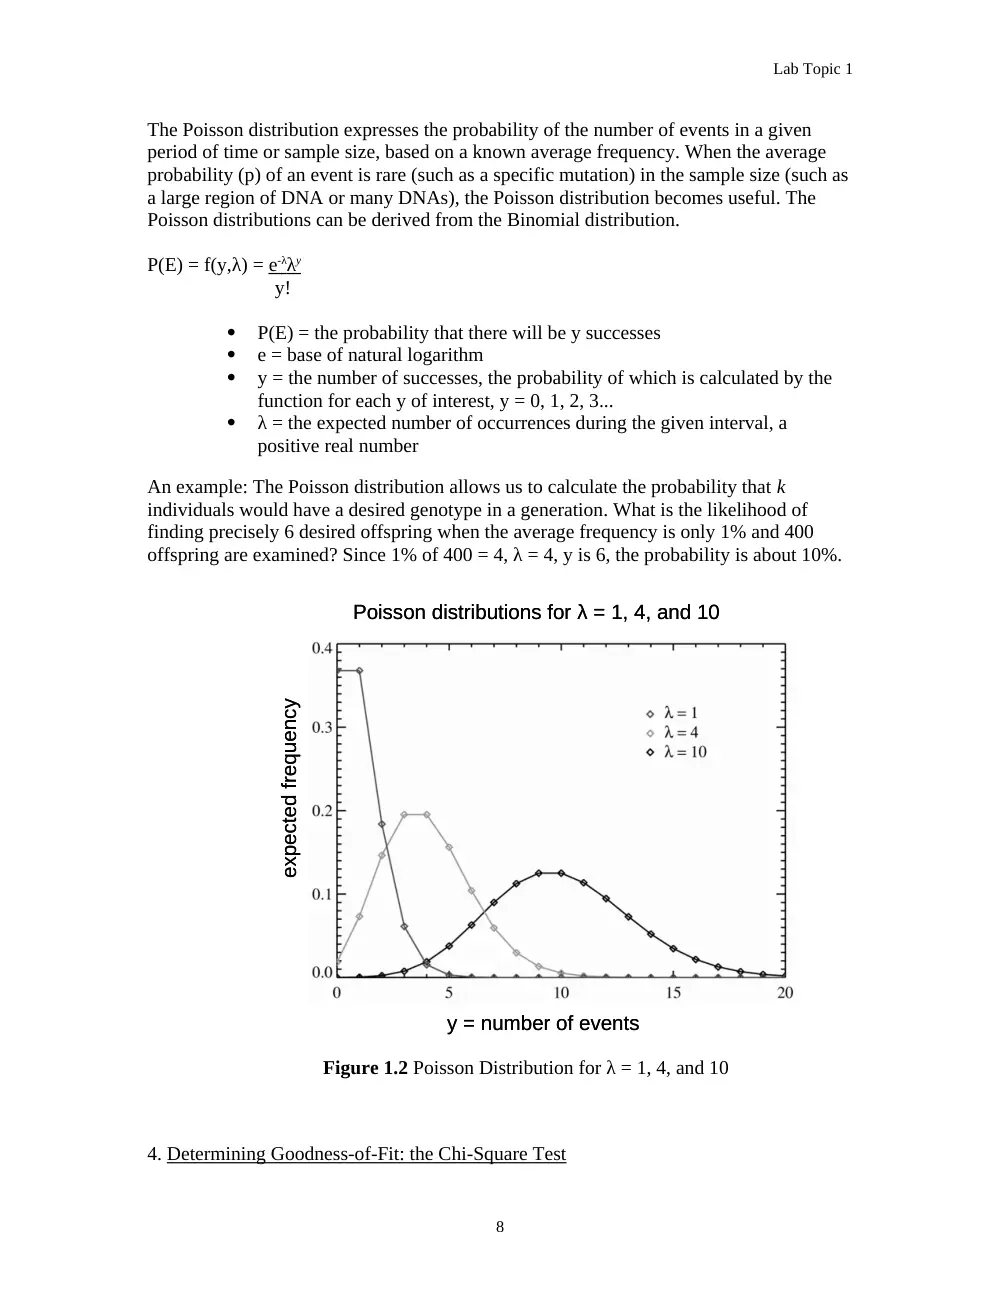
An example: The Poisson distribution allows us to calculate the probability that k
individuals would have a desired genotype in a generation. What is the likelihood of
finding precisely 6 desired offspring when the average frequency is only 1% and 400
offspring are examined? Since 1% of 400 = 4, λ = 4, y is 6, the probability is about 10%.
Figure 1.2 Poisson Distribution for λ = 1, 4, and 10
4. Determining Goodness-of-Fit: the Chi-Square Test
Poisson distributions for λ = 1, 4, and 10
y = number of events
expected frequency
Poisson distributions for λ = 1, 4, and 10
y = number of events
expected frequency
8
Lab Topic 1
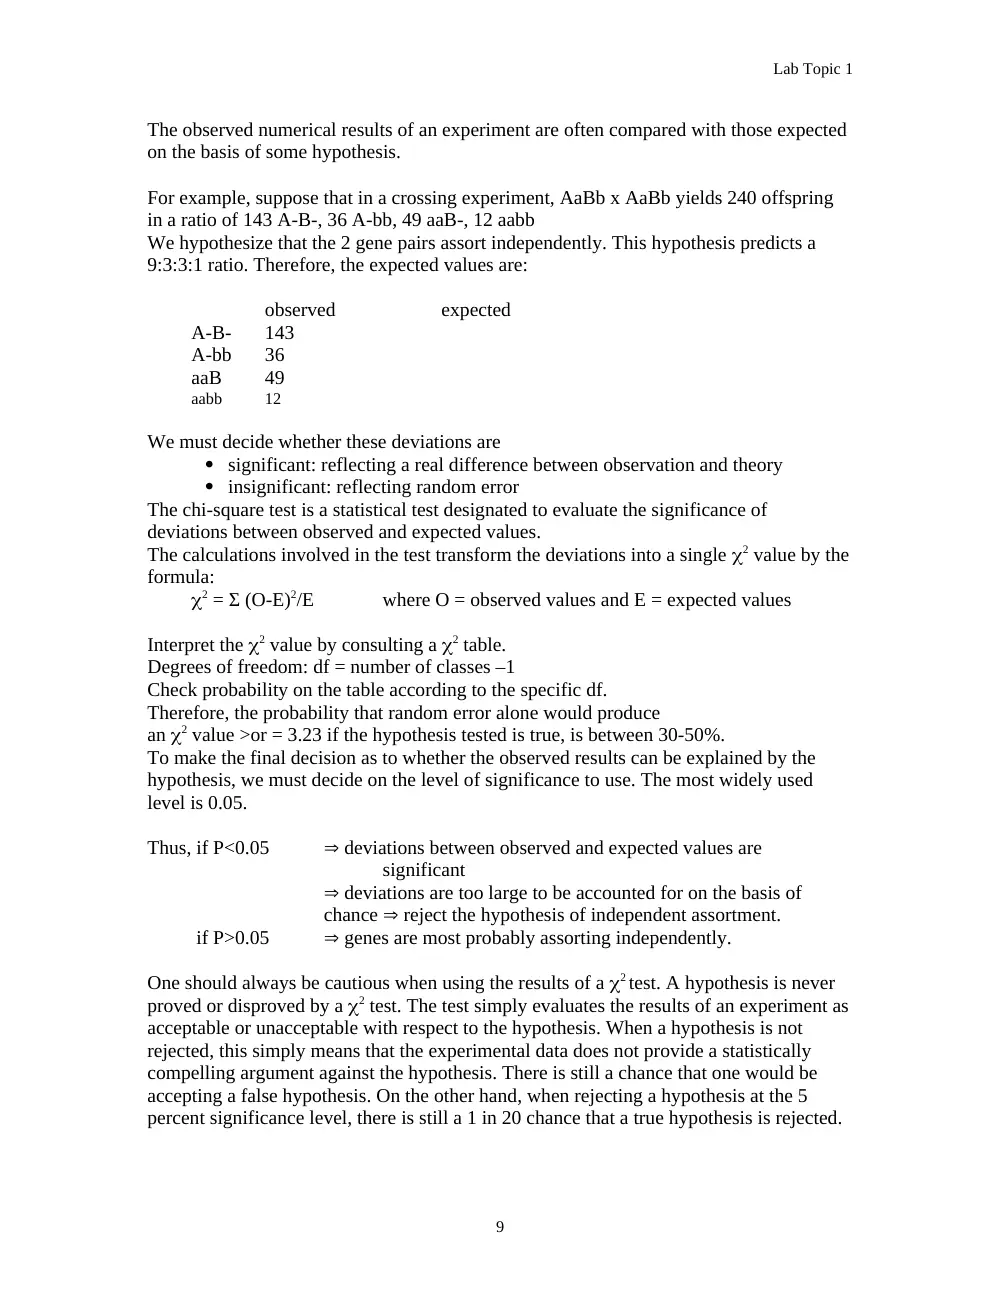
The observed numerical results of an experiment are often compared with those expected
on the basis of some hypothesis.
For example, suppose that in a crossing experiment, AaBb x AaBb yields 240 offspring
in a ratio of 143 A-B-, 36 A-bb, 49 aaB-, 12 aabb
We hypothesize that the 2 gene pairs assort independently. This hypothesis predicts a
9:3:3:1 ratio. Therefore, the expected values are:
observed
expected
A-B-
143
A-bb
36
aaB
49
aabb
12
We must decide whether these deviations are
significant: reflecting a real difference between observation and theory
insignificant: reflecting random error
The chi-square test is a statistical test designated to evaluate the significance of
deviations between observed and expected values.
The calculations involved in the test transform the deviations into a single 2 value by the
formula:
2 = Σ (O-E)2/E
where O = observed values and E = expected values
Interpret the 2 value by consulting a 2 table.
Degrees of freedom: df = number of classes –1
Check probability on the table according to the specific df.
Therefore, the probability that random error alone would produce
an 2 value >or = 3.23 if the hypothesis tested is true, is between 30-50%.
To make the final decision as to whether the observed results can be explained by the
hypothesis, we must decide on the level of significance to use. The most widely used
level is 0.05.
Thus, if P<0.05
deviations between observed and expected values are
significant
deviations are too large to be accounted for on the basis of
chance reject the hypothesis of independent assortment.
if P>0.05
genes are most probably assorting independently.
One should always be cautious when using the results of a 2 test. A hypothesis is never
proved or disproved by a 2 test. The test simply evaluates the results of an experiment as
acceptable or unacceptable with respect to the hypothesis. When a hypothesis is not
rejected, this simply means that the experimental data does not provide a statistically
compelling argument against the hypothesis. There is still a chance that one would be
accepting a false hypothesis. On the other hand, when rejecting a hypothesis at the 5
percent significance level, there is still a 1 in 20 chance that a true hypothesis is rejected.
9
Lab Topic 1
IV. Report Form
Biology 223: Lab 1-Probability
Name_____________________
Lab Partner_______________________________
Date______________________
Lab Section & Instructor____________________
1. Shaved Dice
Six-sided dice are commonly used to generate random numbers in games of chance. One
method to cheat is to use biased dice to alter the frequency of specific numbers. There are
many methods to bias dice. Here, you are given a pair of dice, one shaved, and one
normal, and each numbered in binary code with short (0) and long (1) grooves. Note that
the identification grooves may also bias the normal die.
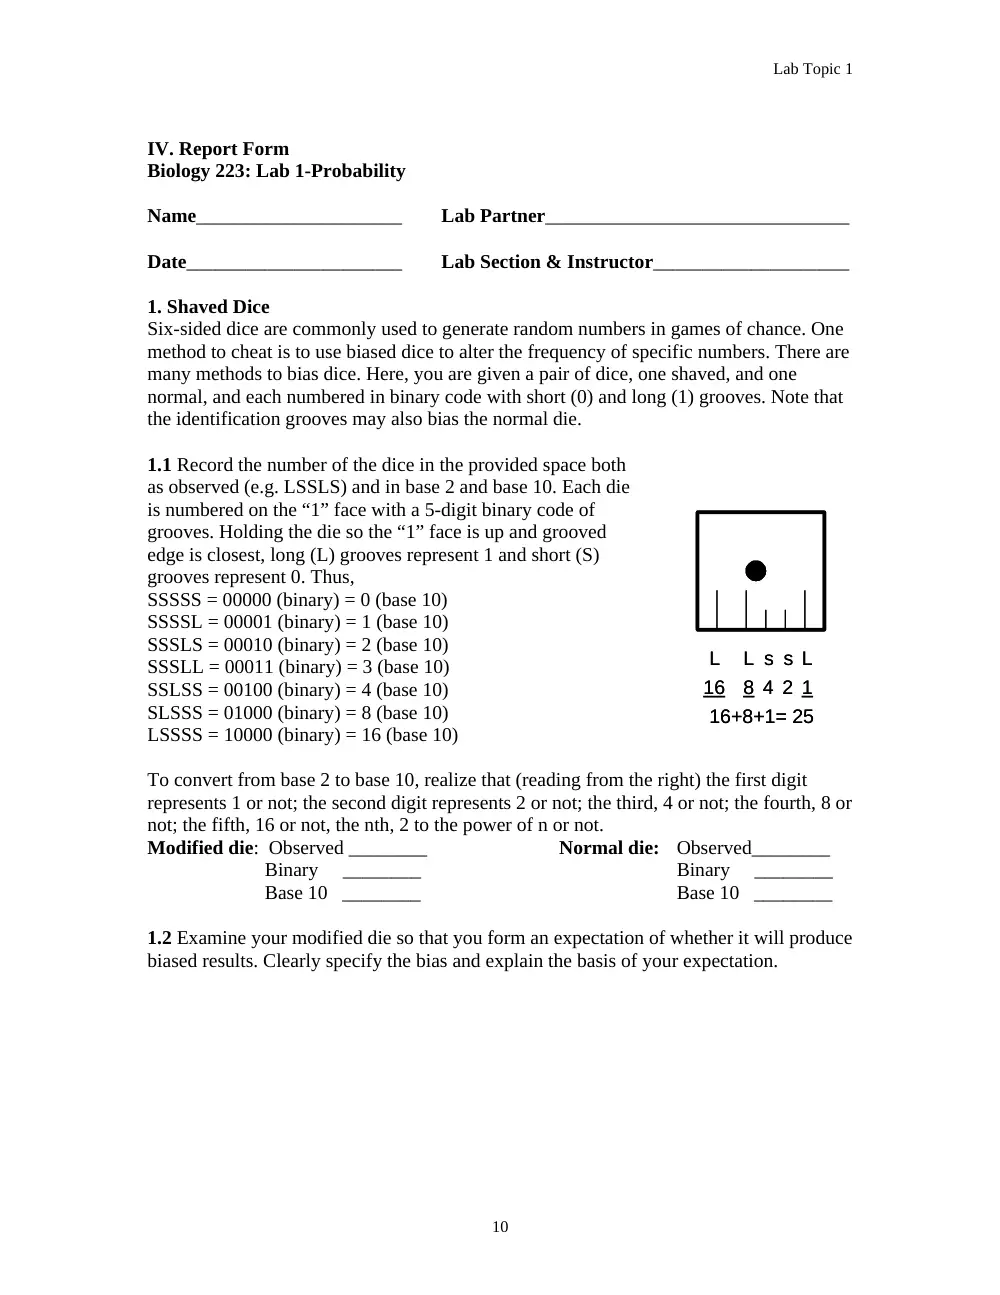
1.1 Record the number of the dice in the provided space both
as observed (e.g. LSSLS) and in base 2 and base 10. Each die
is numbered on the “1” face with a 5-digit binary code of
grooves. Holding the die so the “1” face is up and grooved
edge is closest, long (L) grooves represent 1 and short (S)
grooves represent 0. Thus,
SSSSS = 00000 (binary) = 0 (base 10)
SSSSL = 00001 (binary) = 1 (base 10)
SSSLS = 00010 (binary) = 2 (base 10)
SSSLL = 00011 (binary) = 3 (base 10)
SSLSS = 00100 (binary) = 4 (base 10)
SLSSS = 01000 (binary) = 8 (base 10)
LSSSS = 10000 (binary) = 16 (base 10)
To convert from base 2 to base 10, realize that (reading from the right) the first digit
represents 1 or not; the second digit represents 2 or not; the third, 4 or not; the fourth, 8 or
not; the fifth, 16 or not, the nth, 2 to the power of n or not.
Modified die: Observed ________
Normal die:
Observed________
Binary ________
Binary ________
Base 10 ________
Base 10 ________
1.2 Examine your modified die so that you form an expectation of whether it will produce
biased results. Clearly specify the bias and explain the basis of your expectation.
4
16
8
2 1
L
L
s L
s
16+8+1= 25
4
16
8
2 1
L
L
s L
s
16+8+1= 25
10
Lab Topic 1
1.3 State your expectation as a hypothesis, that you can indirectly test using Chi-square.
What’s the name of this hypothesis?
1.4 State the complementary hypothesis. What is the name of this hypothesis?
1.5 Using a cup, and shaking with reasonable vigor, cast the dice. To make efficient use
of time and to reduce errors, one partner should call the numbers; the other partner should
record the results in the following table. Data should be recorded in non-erasable ink,
errors should be indicated by a single slash through the error, and the corrected result
should be entered next to the error. If a die does not land in the intended area, or does
not land flat, disregard the roll.
roll
die
#
die#
roll
die#
die#
roll
die#
die#
roll
die#
die#
1
25
49
73
2
26
50
3
27
4
28
5
29
6
30
7
8
80
9
10
11
12
60
13
14
15
16
40
17
18
90
19
20
21
22
70
23
11
Lab Topic 1
24
48
72
96
roll
die
#
die#
roll
die#
die#
roll
die#
die#
roll
die#
die#
97
121
145
169
170
100
150
130
180
110
160
140
190
120
144
168
192
12
Lab Topic 1
roll
die
#
die#
roll
die#
die#
roll
die#
die#
roll
die#
die#
193
200
204
1.6 After rolling the dice 204 times, summarize the number of times each face was up,
Die # _____
Die # _____
1.7 For the non-modified die, formulate a hypothesis that you can test using chi-square
1
2
3
4
5
6
1
2
3
4
5
6
13
Lab Topic 1
1.8 Apply a chi-squared test to your hypothesis.
O
E
O-E
(O-E)2
(O-E)2/E
Total
2
1.9 Discuss your results.
1.10 Now test the hypothesis you made for the modified die
O
E
O-E
(O-E)2
(O-E)2/E
Total
2
1.11 Discuss you results. Decide whether you should reconsider your hypothesis, or
whether you have time to increase the confidence of your results by more rolls.
14
Lab Topic 1
2. Random Sampling
You will be given a container with thoroughly mixed equal quantities of beads or beans
of 2 different colors.
Procedure:
2.1 Remove a random sample of the mixture
2.2 Separate and count the beads of different colors
2.3 Record your data:
White:
Colored:
2.4 What are your predictions with respect to the numbers of beads in the sample?
Evaluate the deviations from the predicted values using 2analysis.
O
E
O-E
(O-E)2
(O-E)2/E
Total
2
2.5 How many degrees of freedom do you have in the interpretation of the 2 value?
2.6 What is the probability that the observed deviations are only due to chance?
2.7 Interpret you results
3. Probability Distribution
You will get a large mixture of beads of 2 different colors in exactly equal numbers.
Assume that the beads represent the alleles for pigment production gene; the colored
beads represent the allele for normal pigmentation and the white beads represent the
alleles for albinism.
15
Lab Topic 1
Suppose that you marry a person who has a normal pigmentation just like you, but that
both of you are carriers of the allele for albinism. The 2 alleles will be present in equal
amounts in your gametes.
Procedure:
3.1 Draw 2 beads from the jar to represent the genes in a sperm and an egg.
3.2 Write the genotype of your first child using appropriate gene symbols
3.3 Return the beads to the jar and draw 3 other pairs, one after the other
3.4 Record the genotypes and phenotypes of your 4 children?
First Child
Second Child
Third Child
Fourth Child
Phenotype
Genotype
3.5 What is the ratio of normal to albino phenotypes among your children?
________ Normal:________ Albino
3.6 What is the probability of getting the combination you obtained in a cross between 2
heterozygotes?
3.7 What is the chance of getting each of the 4 other combinations?
16
Lab Topic 1
3.8 Tabulate the results of the entire class
All
Normal
3 Normal:
1 Albino
2 Normal:
2 Albino
1 Normal:
3 Albino
All
Albinos
3.9 Is the hypothesis that the class data approximates the ratio expected from the
binomial expansion accepted or not? Interpret your results.
17
Lab Topic 2
Lab Topic 2-Classical Mendelian Genetics in Drosophila
Layane Hajjar
I. Introduction
Drosophila melanogaster, the common fruit fly, has been subject of extensive genetic
studies since 1909 and is still important. Its success as a model organism is due to many
characteristics: it has a short life cycle passing through complete metamorphosis in 10-
14 days at 20-25˚C, it produces large numbers of offspring (a single female can lay as
many as 500 eggs in 10 days), it is inexpensive, and can be easily raised in the laboratory.
It also shows great genetic variability. Many spontaneous mutations have been identified
in Drosophila and many others have been introduced through radiation. Some of these
mutations produce readily identifiable phenotypes. Also, many aspects of gene
transmission and sex determination are similar to other animals, including humans. In this
lab, you will use Drosophila melanogaster to perform monohybrid and diybrid genetic
crosses and interpret F2 data that illustrate Mendel’s laws of segregation and independent
assortment.
II. Student Learning Outcomes
In completing this activity, students should be able to:
-
Understand and explain why Drosophila melanogaster is a very useful model
organism.
-
Prepare and passage fruit fly cultures.
-
Handle and examine fruit flies with anesthesia and microscopic examination.
-
Design experimental monohybrid and dihybrid crosses to verifiy Mendel’s first
and second laws.
-
Accurately record the results of Drosophila breeding experiment.
-
Interpret F2 data illustrating Mendel’s first and second laws.
-
Statistically test for the goodness of fit of F2 data.
III. Background
A. Drosophila Life Cycle
Drosophila melanogaster is a holometabolous insect (order Diptera, true flies) showing
complete metamorphosis with four different stages: egg, larva, pupa and adult (Figure
2.1). Under optimal conditions, new adults can be produced in 2 weeks: 8 days in the egg
and larval stages, and 6 days in the pupa stage. After their emergence from the puparium,
the adults can live up to 8 weeks. They are ready for mating within 10 hours. The eggs
are very small, about 0.5mm long, and are usually laid on the surface of the culture
medium. One day after the eggs are laid, minute larvae hatch out and start feeding on
yeast cells found in the medium. These first instar larvae double in size within 24 hours.
In 2 days, they undergo a molt, and develop into second instar larvae that will similarly
eat, grow and molt their cuticle to become third instar larvae that are about 5mm long and
can be seen on the culture medium. The third instar larvae then crawl up out of the food
and adhere to a relatively dry surface. Then the larval cuticle hardens and darkens to
become the pupa case or puparium. During pupation, which lasts for about 6 days,
metamorphosis from the larval to the adult form takes place. About one day before the
emergence of the adult, the puparium darkens, the folded wings appear as dark elliptical
18
Lab Topic 2
bodies, and the eye pigment becomes visible through the puparium. The adult emerges by
forcing its way through the anterior end of the pupa case. When it first emerges, it is light
in color with folded wings and a long abdomen. In few hours, the wings expand, the body
becomes more compact and the color gradually darkens. In about 10 hours, the adults
would be ready for mating
Figure 2.1 Drosophila melanogaster life cycle
B. Distinguishing Sex in Drosophila
In order to perform genetic crosses, it is essential to correctly identify the sex of the fruit
flies. This should be done by a close examination of the