
BUSS 235 Midterm, Spring 2003
American University of Beirut · Macro Business Analysis · 13 pages






Showing the first 10 of 13 pages. Download the PDF to see all of it.
More BUSS 235 files
Show the text of this exam
AMERICAN UNIVERSITY OF BEIRUT
School of Business ;
' pppyarRy
ey unseet
-
Name: heii Ss Hk BUSS 305
ame: MID-TERM EXAM April 9. 2003 -
ANSWER ALL QUESTIONS — TIME ALLOWED: 1% hour
I. Multiple Choice — (30 points). Circle the correct answer
1. The modern theory of the firm postulates that the primary objective of
managers is to maximize:
. The firm’s total revenue
b. The value of the firm’s output
€\ The present value of the firm’s expected future profits
a. The firm’s contribution to social welfare
e. The wealth of the firm’s employees and customers.
ws eS
2. Which of the following is the best definition of economic profits?
—_ a, Business profit minus implicit costs <-
) : @ Total revenue minus total explicit costs - C
| A c. Total revenue minus total implicit costs a
r) 4 / \ i d. Business profit minus explicit costs :
U / . e. Explicit revenues minus implicit costs
NYY
/ / 3. If the price of a good increases while the quantity of the good exchange on
\ / markets jficreases also, then the most likely explanation is that there has been: SK
C) An increase in demand
5. A decrease in demand*
c. An increase in supply
d. A decrease in supply
e. A decrease in demand accompanied by an increase in supply 4
thal revenuc is equal tozero,then; . ss,
_/ Total profit is zero also - .
’ Average revenue is zero also
Total revenue is at a maximum:
. Average revenue is at a maximum
e. Total cost is ata minimum
a demand function of the form Q=24-2P. AtP=6, the price
5. Assumi ;
elasticity of demand is: roe 2 Gea (EJ 2 be
€.-4 «x L- -!
ye >
ce -% : , .. ob Le
uc: Oe
d. 2/6
ce. There is not enough information to arrive at an answer.
¥
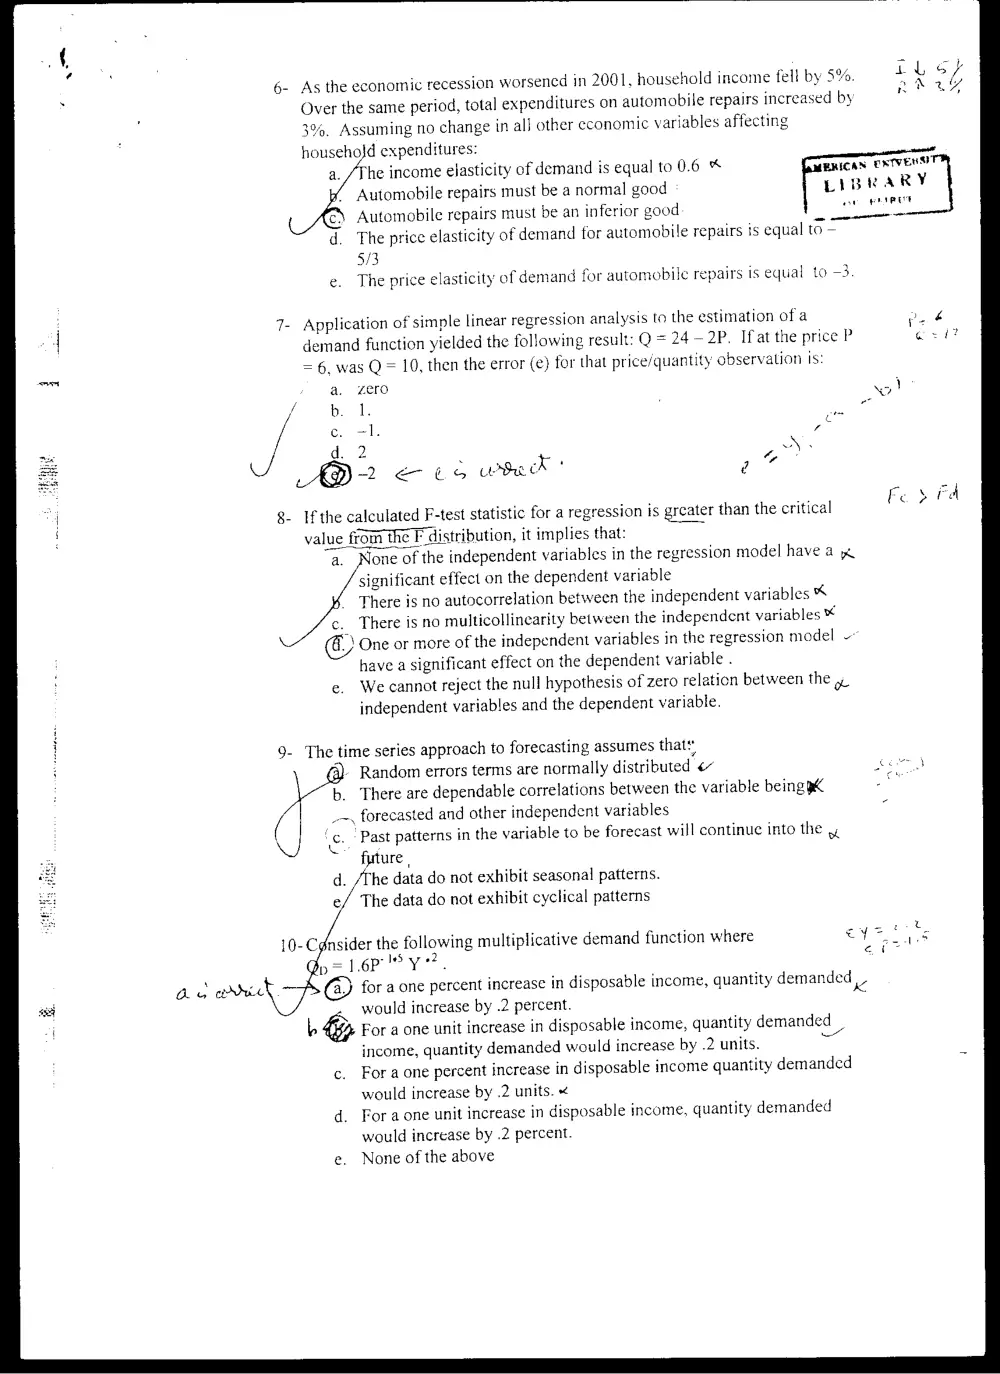
6- As the economic recession worsened in 2001, household income fell by 5%.
Over the same period, total expenditures on automobile repairs increased by
3%, Assuming no change in all other economic variables affecting
househo}d expenditures:
he income elasticity of demand is equal to 0.6 “
Automobile repairs must be a normal good °
Automobile repairs must be an inferior good ‘
. aoe . “ . . . ae cect
The price elasticity of demand for automobile repairs is equal to —
5/3
The price elasticity of demand for automobile repairs is equal to -3.
Application of simple linear regression analysis to the estimation of a
demand function yielded the following result: Q = 24 —2P. Ifat the price P
= 6, was Q = 10, then the error (e) for that price/quantity observation Is:
a. zero
b. 1.
ce. =I.
d. 2
AD2 <— is rsa
8- Ifthe calculated F-test statistic for a regression is greater than the critical
value from thé F distribution, it implies that:
Jone of the independent variables in the regression model have a x
significant effect on the dependent variable
There is no autocorrelation between the independent variables *
c. There is no multicollinearity between the independent variables *
“) One or more of the independent variables in the regression model ~
have a significant effect on the dependent variable .
e. We cannot reject the null hypothesis of zero relation between the y
independent variables and the dependent variable.
9- The time series approach to forecasting assumes thats
- Random errors terms are normally distributed «~
b. There are dependable correlations between the variable being 9K
_~, forecasted and other independent variables
. ’ Past patterns in the variable to be forecast will continue into the
future ,
he data do not exhibit seasonal patterns.
The data do not exhibit cyclical patterns
p= 1.6P 3 Y 12
@ for a one percent increase in disposable income, quantity demanded ,.
would increase by .2 percent.
Lp For a one unit increase in disposable income, quantity demanded
income, quantity demanded would increase by .2 units.
c. Fora one percent increase in disposable income quantity demanded
would increase by .2 units. <
d. Foraone unit increase in disposable income, quantity demanded
would increase by .2 percent.
e. None of the above
™4
}
|
,
i
‘a
TABERICAS CNT ORASET
LIBRARY ]
1]-A demand function is said to be identified if- th eee
a. the supply function contains at least_ one endogenous variable that ts”
not in the demand function
b.) the supply function contains at least one exogenous variable that is
not in the demand function
ce. the demand function contains at least one endogenous variable that *
is not in the supply function
d. the demand function contains at least one exogenous variable that is #
not in the supply function.
12-In usingepression analysis, the objective is to:
estimate the parameters a and b —
estimate the variables Y and X«
Fit a straight line through the scatter data in such a way that the
errors are minimized
Both a andb
Both a and c
13-The law ¢f diminishing marginal returns:
tates that each and every increase in the amount of the variable
factor employed in the production process will yield diminishing °*
marginal returns
_ Isa mathematical theorem that can be logically proved or disproved &
c. Is the rate at which one input may be substituted for another input in
the production process
© Nong’of the above
14- Which of the following is not an assumption of the lincar breakeven model:
‘Constant selling price per unit ~~
( Decreasing variable cost per unit.
~. Fixed costs are independent of the output level ~~
d. A single product ( or a constant mix — of products) is being u~
produced and sold
ec. All costs can be classified as fixed or variable a
a.
15-In pure competition:
a. The optimal price-output solution occurs at the point where marginal <
‘evenue is equal to price
b./A firm’s demand curve is represented by a horizontal line
A firm is a price-taker since the products of every producer are u~
perfect substitutes for the products of every other producer
d. aand’b only
©) a, b, andc.
U- True/ False - 20 points. On your blue book, label each of the following statements as
either T ( true) or F (false) and briefly justify the answer. pre?
€ 1- The value ofa firm is equal to the sum of all future profits that
will be generated by the firm
f 2- Firms that operate in industries with relatively high levels of risk
tend to have lower levels of profit.
3- Marginal revenue reaches a maximum at the same level of output
at which total revenue reaches a maximum.
Fr 4- Ifan increase in the price of one commodity leads to an increase
in the demand for a second commodity, then the two commodities
are complements.
t
< . _ + ~ . r ;
~~ 5- The slope of the demand curve for commodity * repreggmie the
MEHIC.AS TRIVERSIT®
price elasticity of demand for commodity x. i
° | LibLARY
ef PTIRDD
aa 6- Jf Ordinary Least Squares ( OLS) is used to estimate the coefficients of a
linear function, then the sun of the e, (error terms) will always be equal to
zero.
v 7. If two forecasting methods are applied to the same data set, the method that
yields the larger root-mean-square-error (RMSE) ts better.
~ §- Ifa firm is employing combination of inputs that is on its expansion path then
it must be maximizing profits .
~y
A9- Point of inflection of short-run variable cost function corresponds to level of
output where marginal cost is ata minimum .
¢ 10- Survivor technique advanced by George Stigler gives direction and exact
magnitude of the cost curve.
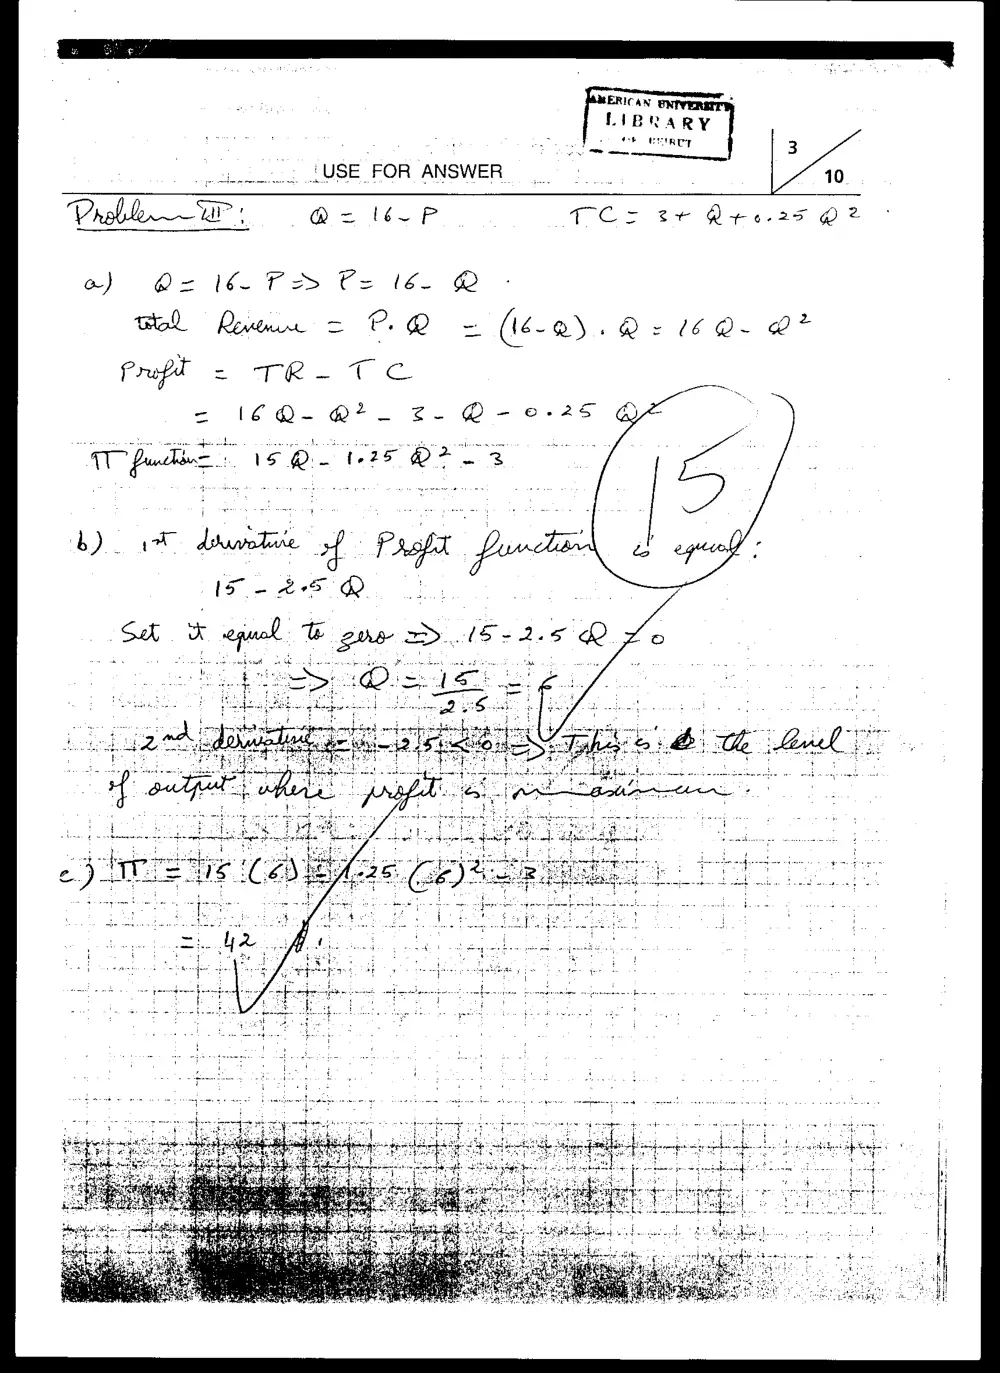
IIL - Problem (15 points) . A firm’s demand function is given as Q= 16—P its total cost
function is given as TC=3+Q4+0.25
a. for 5 points . Determine the firm’s profit function
b. for 5 points. Determine the level of output that produces the ,
profit maximum
c. for 5 points . Determine the level of profit at the optimum output
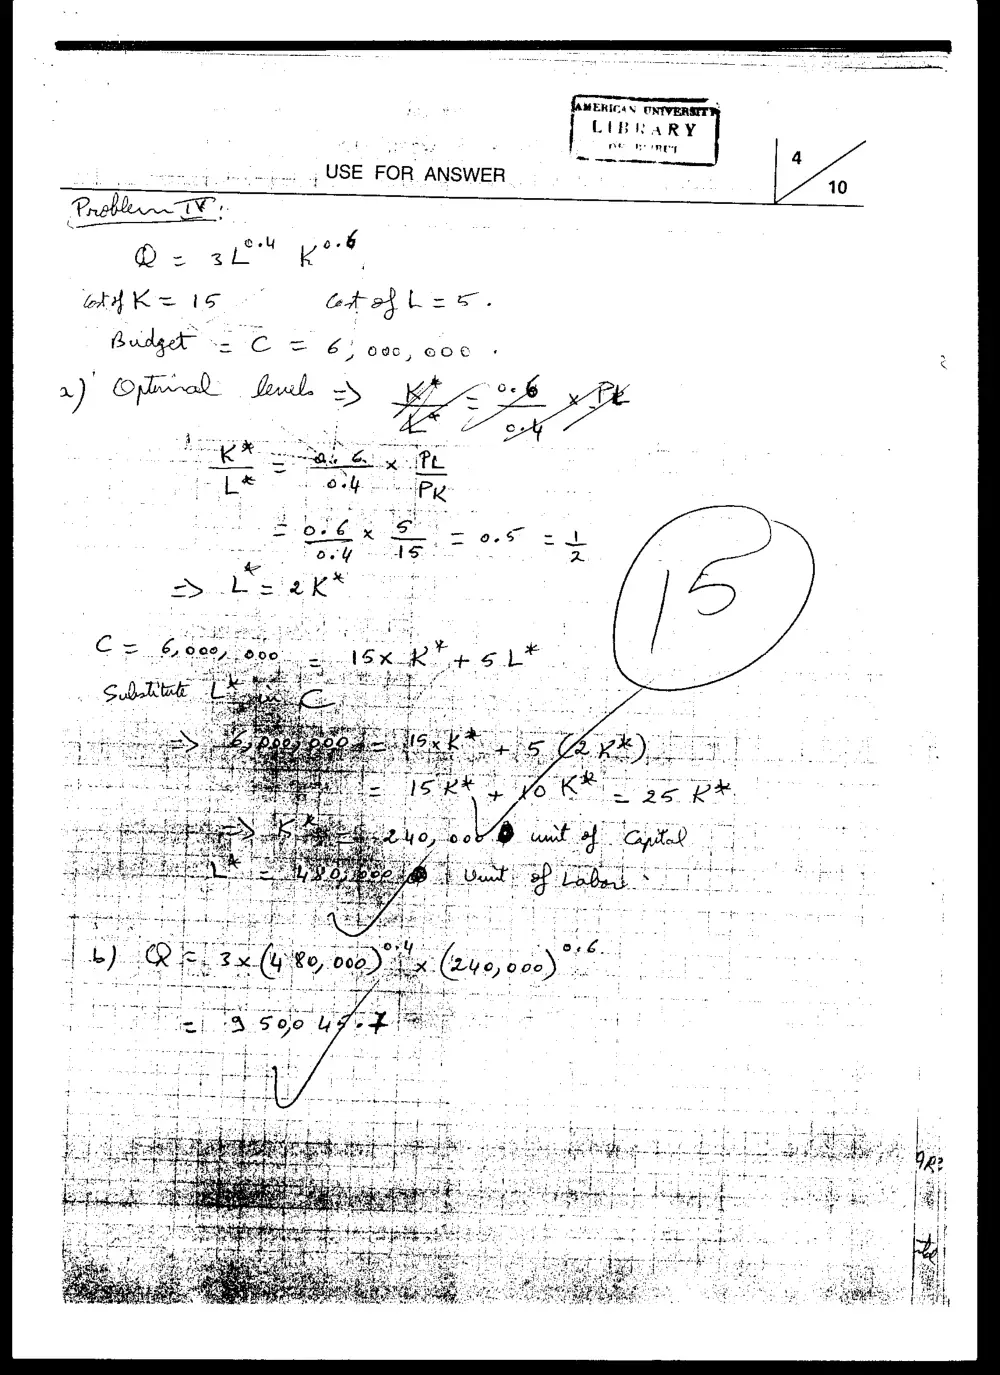
| IV- 15 points for correctly answering parts a and b.
A manager estimated his firm’s production function as:
Q=3L% 04 Ko (3 multiplied by L raised to the power 0.4
multiplied by K raised to the power 0.6).
The unit cots of inputs are K=IS5andL=5
: The firm’s budget for input use is 6 million
a a. For 10 points. Calculate the optimal levels of L and K
b. For 5 points. What would be the level of output corresponding to the
optimal L and K.
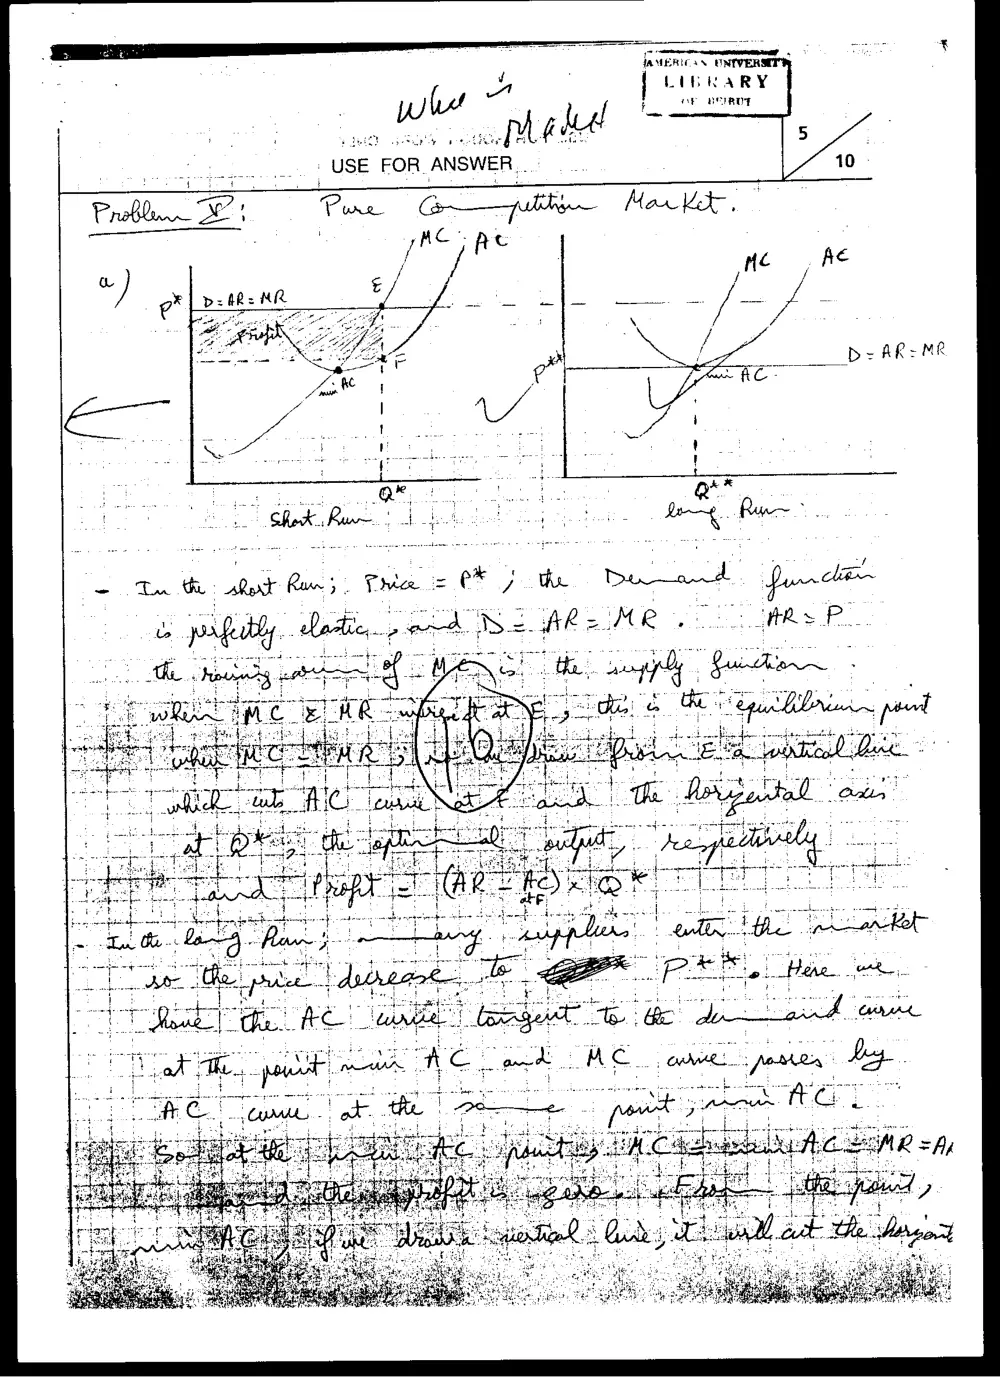
V- (20 points).
a, Explain with the help of a clear diagrams how price and output
, equilibrium levels are determined in a pure competition market. (10
“ points).
! b. Explain how you judge the usefulness of a model particularly if it is
: based on simple assumptions such as pure competition model. (5
points)
What determines the shut-down decision of a firm. Draw a diagram
to illustrate your answer. ( 5 points).
[Cr eeen
T'4ERICAN 4 my]
,; PIP hary
| a ree
co AMERICAN UNIVERSITY OF ~
BEIRUT
EXAMINATION BOOKLET
COURSE No.
oT N OM &F WH
a
COURSE... hb. 8.0. So
: Ak (NAME & NUMBER)
{
“DIVISION OR SECTION:
NAME OF STUDENT...... Beaditbocte. .uE lesen
DATE soon Apih...5.,.282.3.. -
instructions:
1. Complete the above blank spaces.
2. Start each question on a new page.
3. It is not permitted to ask questions during the examination.
: 4, Stop writing wh { You &7¢ tol, ‘otherwise you may lose total credit for the examination
MERICAN .
LIBRARY
at : : Dieu ;
. re — 1
USE FOR ANSWER 10
Fale; ThAabe of a pri of tuod Bt Th sa—~ of Ak
ERICAN BWIVER'
LIBRARY
OF -REIRUT
USE FOR ANSWER
ERICAN .
LIBRARY
oP et need 3
a Netw |
Cecleeetne, USE FOR ANSWER fo) ; 10.
v “Wi = Qa bl P TCr te Qee-25 G2
a) 2-1 TD C= lE CD
CP. @ = (6-0). Qe 16 Q- @a*
(}
fauenicas CRVvERSTR)
LIBRARY
vu, , USE FOR ANSWER 0
SS, ee een 4S
IAMERIC aS ENTVER
{ LIBRARY
USE FOR ANSWER...
AP BOIROT