
CVSP 295 Final, Spring 2005
American University of Beirut · Special Topics in Cultural Studies · 3 pages

More CVSP 295 files
Show the text of this final exam
CVSP 295 AB Cultural Geography of North America
Test Questions for the Final Exam
This will be a take-home exam. Answer four out of the following five questions. Do
not copy long quotations from readings; answer the questions in your own words.
Copying sections from websites is plagiarism and will result in a grade of zero. There is
a limit of eight pages in total (double-spaced, 12 point). Turn in your test to the CASAR
Office (443 College Hall) or attach it to an email and send it to pm07@aub.edu.lb (make
sure you get a reply) by 14 June 2005.
1. More than 20 years after its publication, what are the strengths and weaknesses of
Garreau’s “Nine Nations” hypothesis?
2. To what extent is the Federal Rectangular Survey System an expression of U.S.
culture and society and to what extent has it shaped them?
3. Why do events of the “1960s” loom so large in the debates that demarcate U.S.
political divisions today?
4. According to Cronon, what is “the trouble with wilderness”? If his thesis is correct,
what does this imply about what can be done to repair the “trouble”? Does it have public
policy implications? To what extent do you think he is right, and why?
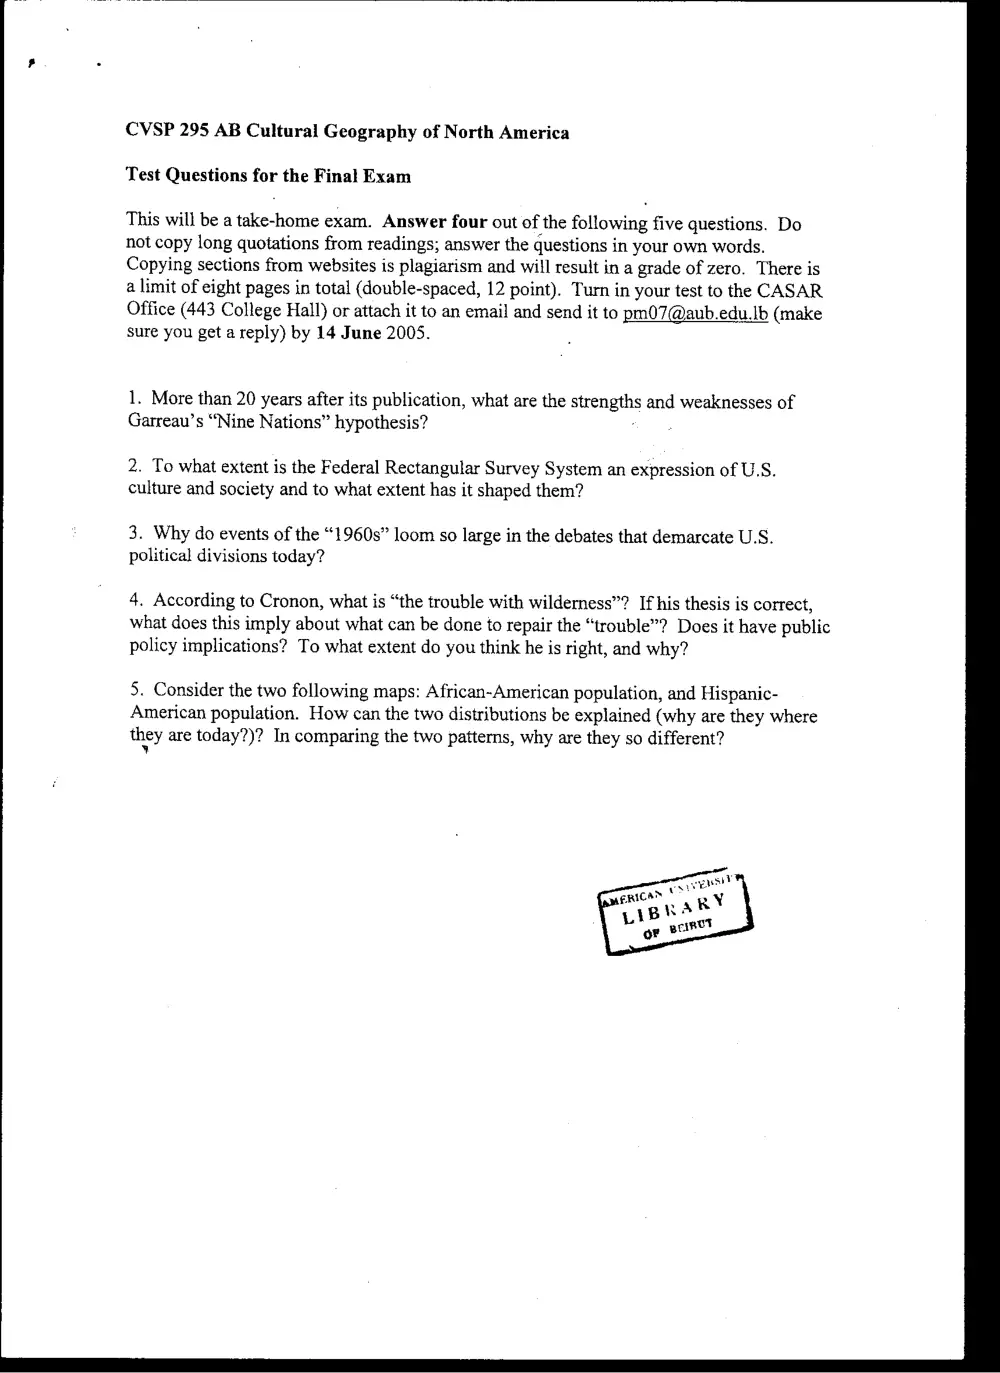
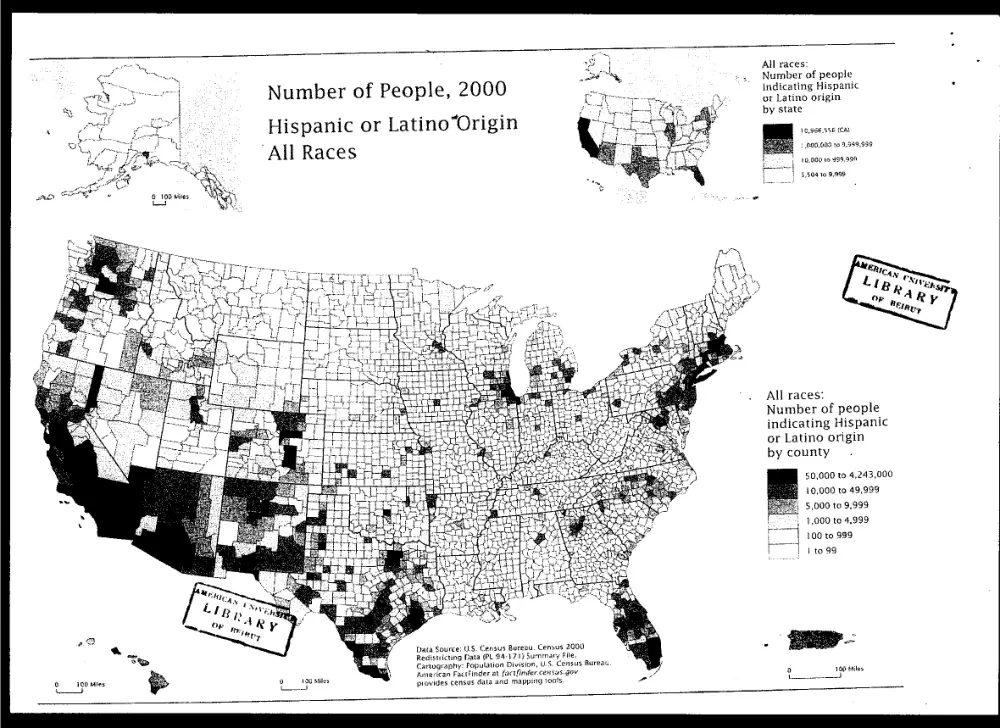
5. Consider the two following maps: African-American population, and Hispanic-
American population. How can the two distributions be explained (why are they where
they are today?)? In comparing the two patterns, why are they so different?
¥
Number of people
indicating exactly one .
race, Black or African
American, by state
Number of People, 2000
One Race: “
Black or African American
1,000,000 to 3,015.000
100,000 to 999,999
10,000 to 99,999
i
2,692 to 9,999
Number of people
indicating exactly
one race, Black or
African American,
by county
50,000 to 1,406,000
10,000 ta 49,999
5,000 to 9,999
| 1,000 to 4,999
| 100 to 999
| oto 99
Data Source: U.S, Census Bureau, Census 2000 4 ° Se
Redistricting Data (PL. 94-171) Summary file.
. \ Cartography: Population Division, U.S. Census Bureau
y : American FactFinder at factfinder.census.gov ° 190 Miles
as |
2 190 Maes
provides census data and mapping tools. 4
j
uses §
—t 4, a
All races:
.. Number of people
indicating Hispanic
or Latino origin
by state
Number of People, 2000
10,856,556 (CA)
Hispanic or Latino“Origin
All Races
£000,000 to 9,989,939
i |, 19,000 ro 989,999
i | 5,504 10 9.998
All races:
Number of people
indicating Hispanic
or Latino origin
by county
50,000 to 4,243,000
10,000 to 49,999,
5,000 to 9,999
1.000 to 4,999
100 to 999
| 1 t0.99
Redistricting Pata (PL 94-171) Summary File,
Population Division, U.S. Census Bureat
Cartgrap!
Finder at factfinder:census.gov ° 100 Hiles
“ es]
0 100 Mies 0 tae ates American Fak
— u provides census data and mapping ‘oats. -