
ECON 212 Notes, Spring 2008
American University of Beirut · Elementary Macroeconomics Theory · 71 pages

Showing the first 10 of 71 pages. Download the PDF to see all of it.
More ECON 212 files
- Syllabus · Spring 2019LabView
- Syllabus Test Bank · Fall 2018LabView
- Useful File Summary · Fall 2017FileView
- Useful File Test Bank · Fall 2017FileView
- Questions Chapters 20 · Fall 2016ChapterView
- Final Practice Test Fall 2016 · Fall 2016Final examView
- Questions Test Banks All Chapters · Fall 2015ChapterView
- Midterm · Fall 2015ExamView
Show the text of this notes
Dr. Hala Freiha Nassif
ECON 212
Lecture Notes
I. WHAT IS (MACRO) ECONOMICS?
* What is economics?
-- The study of the allocation of scarce resources, both by individuals and societies.
---- Does that definition seem a bit vague?
------ A resource is scarce is there is less of it than we (or some of us) would like. Time
is scarce, food is scarce, land is scarce (--> wars), goods are scarce. Good liberal arts
colleges in warm climates are scarce. Even government spending is scarce.
-- How do we allocate society's resources? The political debate is largely an argument
over the allocation of scarce resources: government vs. private sector, current vs. future,
military vs. social spending ("guns vs. butter").
---- But it's not always a zero-sum game. Society's resources are not always used
efficiently. Great Depression an obvious example: ten million unemployed, thousands of
shut-down factories --> How do we reallocate those resources from "idle" to "in use"?
* Two "flavors" of economics:
MICRO (individual firms, households, markets, industries)
and
MACRO aggregates (GDP, unemployment, inflation)
We'll spend most of the next week learning a little micro, since macro grew out of micro,
and it's hard to understand any part of economics without understanding basic micro
concepts like supply and demand, equilibrium, and opportunity cost.
The "big three" variables in macroeconomics are gross domestic product, unemployment,
and inflation.
* Gross domestic product (GDP) (or "national output" or "aggregate output")-- The
total quantity of "final" goods and services produced in an economy in a given
period.
* Unemployment rate-- The percentage of the labor force that is not working and is
actively looking for work.
* Inflation-- The rate of increase in the overall price level
Two types of economic questions: POSITIVE and NORMATIVE:
Def. Positive-- "what is" & how does it work.
-- Ex.: "Since Bill Clinton took office, the U.S. unemployment rate has fallen by more
than a third (from 7.3% to 4.1%)."
Def. Normative-- "what should be"(more touchy-feely); evaluates outcomes as good or
bad, & possibly prescribes solutions or different policies
-- Ex.: "The unemployment rates of certain segments of the population (blacks,
teenagers) are still way too high, and the government should take corrective action-- say,
federal jobs programs or expanding the money supply."
Both micro and macro have elements of the positive and the normative.
The distinction between positive & normative is not always a clear one.
-- Ex.: "The sharp drop in the unemployment rate is evidence that Bill Clinton's economic
program has worked." (Some would disagree; regardless, it's a loaded statement w/ policy
implications. As Clinton himself might say, it depends on what your definition of
"worked" is...)
Macroeconomics is typically in a state of flux. Micro is relatively more stable;
microeconomists tend to agree with each other about a lot more than macroeconomists
do. When people say economists always disagree (the playwright George Bernard Shaw:
"If all the world's economists were laid end to end, they still wouldn't reach a
conclusion"), they typically mean macroeconomists.
Why is macro so controversial?
1) It's a relatively new field, dating back to 1930s (the Great Depression and the
publication of John Maynard Keynes's The General Theory). Micro, by contrast (just
"economics" before 1930s/40s) has been around since 1776 (Adam Smith's The Wealth of
Nations). Before Keynes, everyone was basically a microeconomist and the government
rarely intervened directly in the economy.
2) The issues tend to be more socially and politically charged than in micro. Exs.: taxes,
interest rates, inflation-- these are issues that affect people directly, and virtually any
policy will benefit some people and hurt others.
***
II. INTRODUCTION TO ECONOMIC THEORY
Next week we'll be learning some basic microeconomic theory. Now, what exactly is
theory?
* Economic theory: a statement, or set of related statements, about cause and effect
or action and reaction in economic life
* Model: a formal statement of a theory, often mathematically
* Empirical testing: the use of real-life observation to test economic theory
Now, why do we need all this theory? What does it have to do with the real world? The
answer is that it offers a way of explaining the real world. Without it, someone once said,
we could only stare stupidly at the world, the way cows look up at the sky. Theory is
(ideally) based on observation of the real world. Naturally, any theory is going to have to
leave a few things out. The goal is to "simplify, simplify" in order to expose and analyze
certain aspects of how things operate.
--> A key assumption: "ALL OTHER THINGS EQUAL" (in Latin, ceteris paribus).
For a theory or model to identify some key relation between two variables - say, the
tendency for people to buy more of a good when its price is reduced - we need to hold
other things constant.
---- For example, a reduction in the price of Porsche sports cars should increase the
demand for Porsches, but you might not notice that effect if you don't take into account
changes in the prices of other cars, changes in the general price level, or changes in
people's income or tastes.
Economics without theory is kinda like rock music without guitars. It can be done, but
what's the point?
III. INTRODUCTION TO MACROECONOMICS
The major players in our economy are: households, firms, the government, and the "rest
of the world" (i.e., other countries with which we trade goods and services). A good way
to identify those major players in our economy and how they relate to each other is
through something called THE CIRCULAR-FLOW DIAGRAM of production and
income.
-- The circular-flow diagram shows how households supply labor and savings to firms,
who use that labor and invest those savings so as to produce goods and services, which
they in turn sell back to those households. In other words, resources flow from
households to firms in the form of labor services and savings, and they flow back from
firms to households in the form of goods and services. Or we could think of income
flowing from firms to households in the form of wages, interest, and dividends, and then
flowing back to firms in the form of revenues for the goods they produce and sell.
Recall from last time: the "big three" variables in macro are GDP (national output),
unemployment, and inflation. "Economic growth," which all politicians claim to be for,
relates to the first of those, GDP.
Defn. Economic growth: An increase in real (inflation-adjusted) output (or real per
capita output, which means real output per person).
-- We need to adjust key measures like GDP for changes in prices, so that we can be sure
that an increase in GDP actually represents more output being produced, not just higher
prices (inflation).
The economy, as measured by real GDP, typically grows from year to year, and the U.S.
economy has shown very impressive growth over long periods of time. It does not always
grow at the same constant rate, however. Sometimes it grows very rapidly, sometimes
less rapidly, and sometimes it actually falls. A key theme of macroeconomics is this one:
We must distinguish between trend economic growth and business cycle fluctuations.
Defn. Business cycle: the more or less regular fluctuations of GDP around its long-
run trend, along with associated changes in levels of employment, unemployment,
and prices
The best, most precise ways to describe the ups and downs of economic activity:
Defn. Contraction: a period over which real GDP steadily falls. (Also sometimes
called a RECESSION.)
Defn. Expansion: a period over which real GDP steadily rises. (Also sometimes called
a RECOVERY.)
Two less precise, but very common, ways to describe the ups and downs of economic
activity:
Defn. Recession: (no universally accepted definition, but)
(1) conventionally, a period in which real output declines for two consecutive
quarters.
(2) Alternatively, a period in which actual GDP falls well short of the trend level of
GDP (this trend level is roughly the same thing as "potential GDP," a concept that will be
introduced later).
Defn. Boom: a prolonged period when actual GDP exceeds the trend level of GDP.
IV. NATIONAL INCOME & NATIONAL PRODUCT
"National income" and "national output" are roughly the same thing. They reflect the two
different approaches to calculating GDP (gross domestic product). They are:
* the product, or expenditure, approach: add up the values of everything that is produced
* the income approach: add up everybody's wages, salaries, interest income, company
profits, etc.
-- These two approaches are both valid because every expenditure by a buyer is at the
same time income for the seller. We see this in the circular-flow diagram, where the
flow of households' consumption spending equals the flow of firms' revenues from that
consumption.
Defns.:
National product: total output of goods and services.
National income: total payments to factors of production.
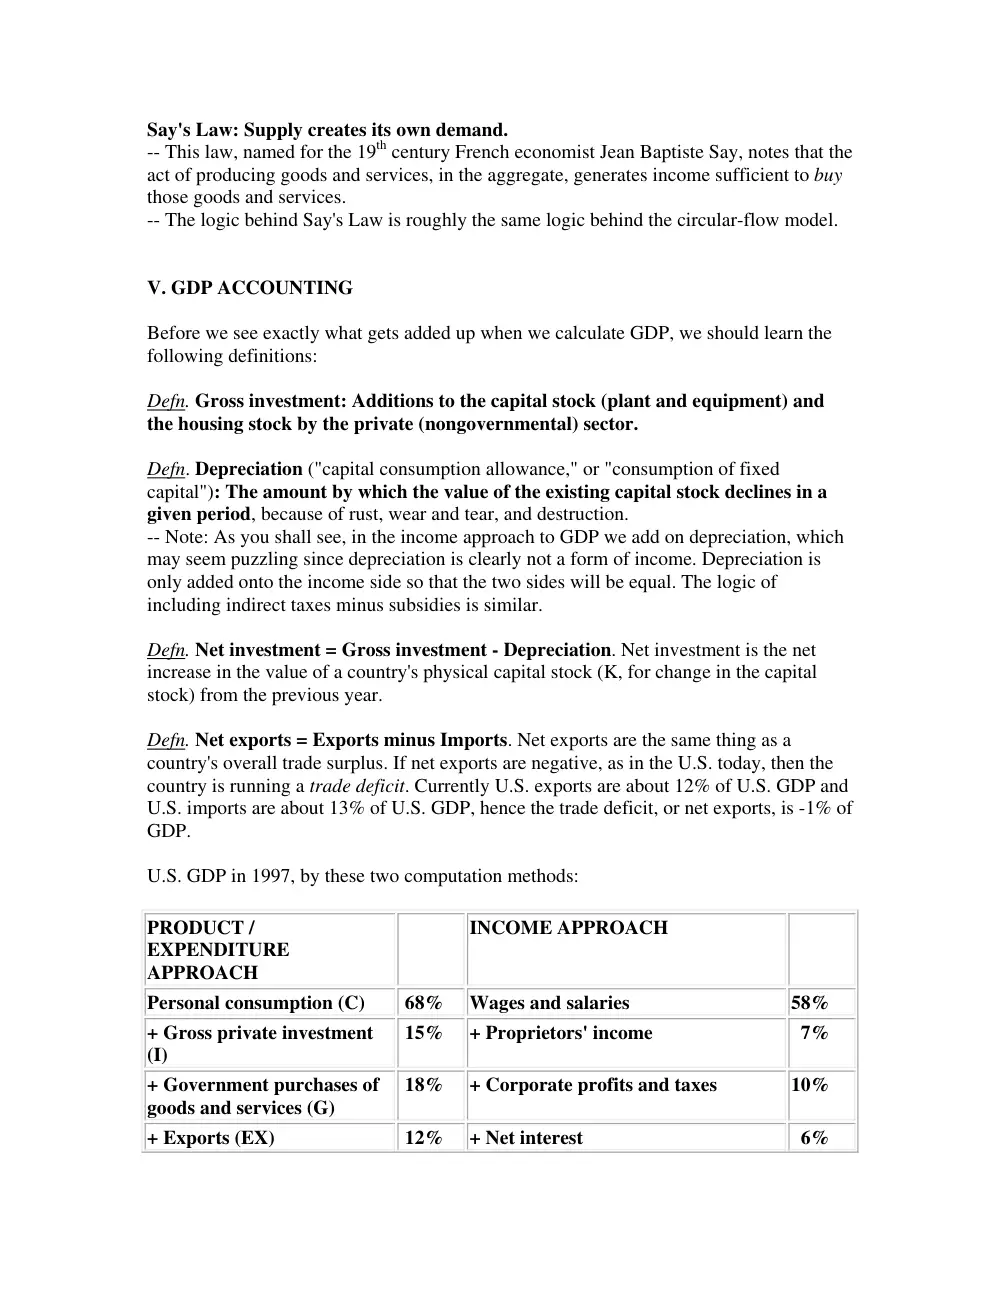
Say's Law: Supply creates its own demand.
-- This law, named for the 19th century French economist Jean Baptiste Say, notes that the
act of producing goods and services, in the aggregate, generates income sufficient to buy
those goods and services.
-- The logic behind Say's Law is roughly the same logic behind the circular-flow model.
V. GDP ACCOUNTING
Before we see exactly what gets added up when we calculate GDP, we should learn the
following definitions:
Defn. Gross investment: Additions to the capital stock (plant and equipment) and
the housing stock by the private (nongovernmental) sector.
Defn. Depreciation ("capital consumption allowance," or "consumption of fixed
capital"): The amount by which the value of the existing capital stock declines in a
given period, because of rust, wear and tear, and destruction.
-- Note: As you shall see, in the income approach to GDP we add on depreciation, which
may seem puzzling since depreciation is clearly not a form of income. Depreciation is
only added onto the income side so that the two sides will be equal. The logic of
including indirect taxes minus subsidies is similar.
Defn. Net investment = Gross investment - Depreciation. Net investment is the net
increase in the value of a country's physical capital stock (K, for change in the capital
stock) from the previous year.
Defn. Net exports = Exports minus Imports. Net exports are the same thing as a
country's overall trade surplus. If net exports are negative, as in the U.S. today, then the
country is running a trade deficit. Currently U.S. exports are about 12% of U.S. GDP and
U.S. imports are about 13% of U.S. GDP, hence the trade deficit, or net exports, is -1% of
GDP.
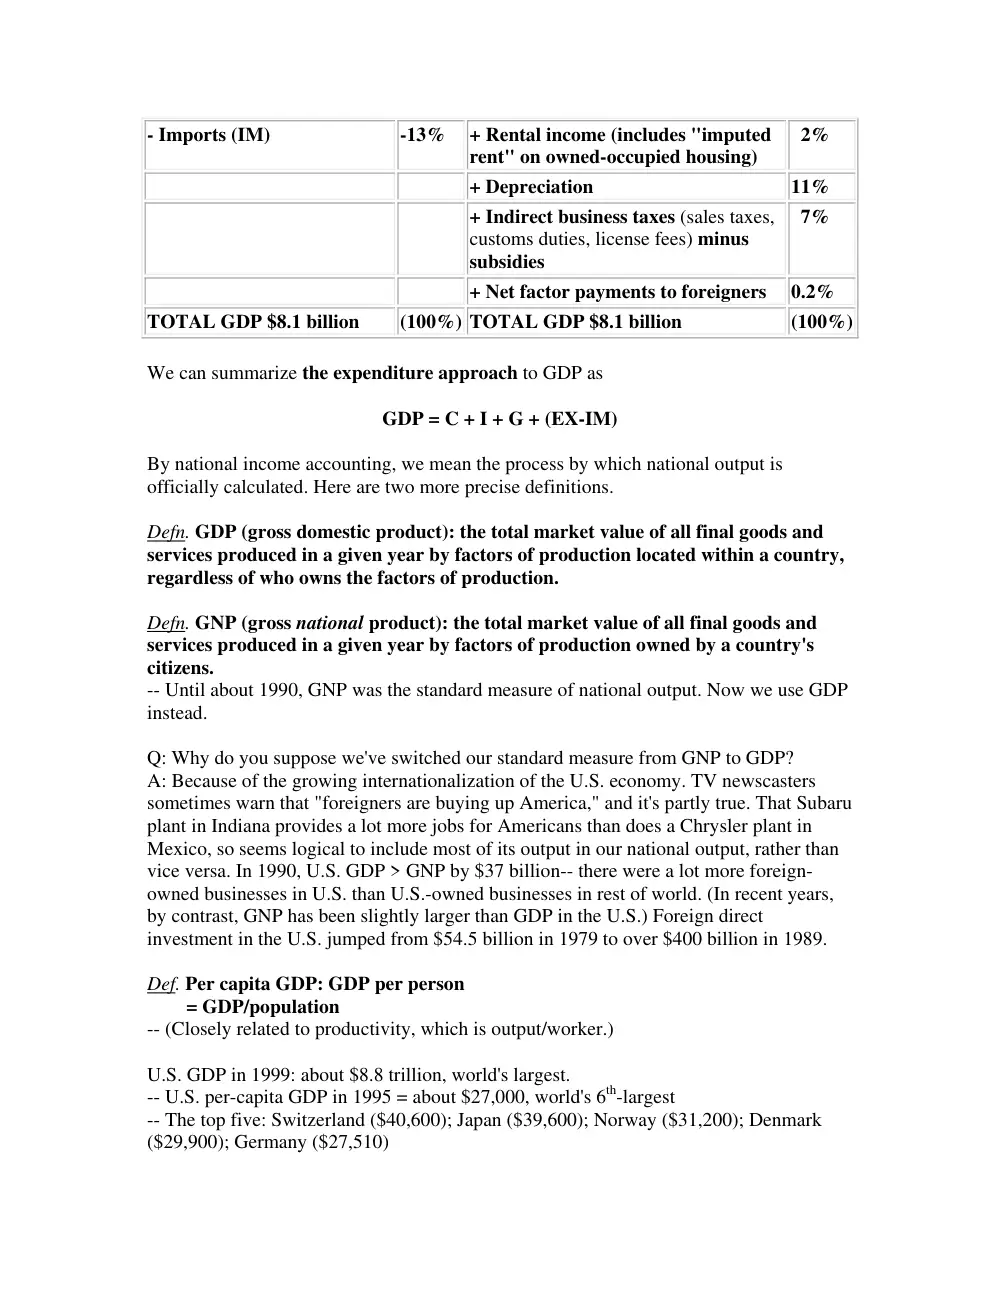
U.S. GDP in 1997, by these two computation methods:
PRODUCT /
EXPENDITURE
APPROACH
INCOME APPROACH
Personal consumption (C)
68%
Wages and salaries
58%
+ Gross private investment
(I)
15%
+ Proprietors' income
7%
+ Government purchases of
goods and services (G)
18%
+ Corporate profits and taxes
10%
+ Exports (EX)
12%
+ Net interest
6%
- Imports (IM)
-13%
+ Rental income (includes "imputed
rent" on owned-occupied housing)
2%
+ Depreciation
11%
+ Indirect business taxes (sales taxes,
customs duties, license fees) minus
subsidies
7%
+ Net factor payments to foreigners 0.2%
TOTAL GDP $8.1 billion
(100%) TOTAL GDP $8.1 billion
(100%)
We can summarize the expenditure approach to GDP as
GDP = C + I + G + (EX-IM)
By national income accounting, we mean the process by which national output is
officially calculated. Here are two more precise definitions.
Defn. GDP (gross domestic product): the total market value of all final goods and
services produced in a given year by factors of production located within a country,
regardless of who owns the factors of production.
Defn. GNP (gross national product): the total market value of all final goods and
services produced in a given year by factors of production owned by a country's
citizens.
-- Until about 1990, GNP was the standard measure of national output. Now we use GDP
instead.
Q: Why do you suppose we've switched our standard measure from GNP to GDP?
A: Because of the growing internationalization of the U.S. economy. TV newscasters
sometimes warn that "foreigners are buying up America," and it's partly true. That Subaru
plant in Indiana provides a lot more jobs for Americans than does a Chrysler plant in
Mexico, so seems logical to include most of its output in our national output, rather than
vice versa. In 1990, U.S. GDP > GNP by $37 billion-- there were a lot more foreign-
owned businesses in U.S. than U.S.-owned businesses in rest of world. (In recent years,
by contrast, GNP has been slightly larger than GDP in the U.S.) Foreign direct
investment in the U.S. jumped from $54.5 billion in 1979 to over $400 billion in 1989.
Def. Per capita GDP: GDP per person
= GDP/population
-- (Closely related to productivity, which is output/worker.)
U.S. GDP in 1999: about $8.8 trillion, world's largest.
-- U.S. per-capita GDP in 1995 = about $27,000, world's 6th-largest
-- The top five: Switzerland ($40,600); Japan ($39,600); Norway ($31,200); Denmark
($29,900); Germany ($27,510)
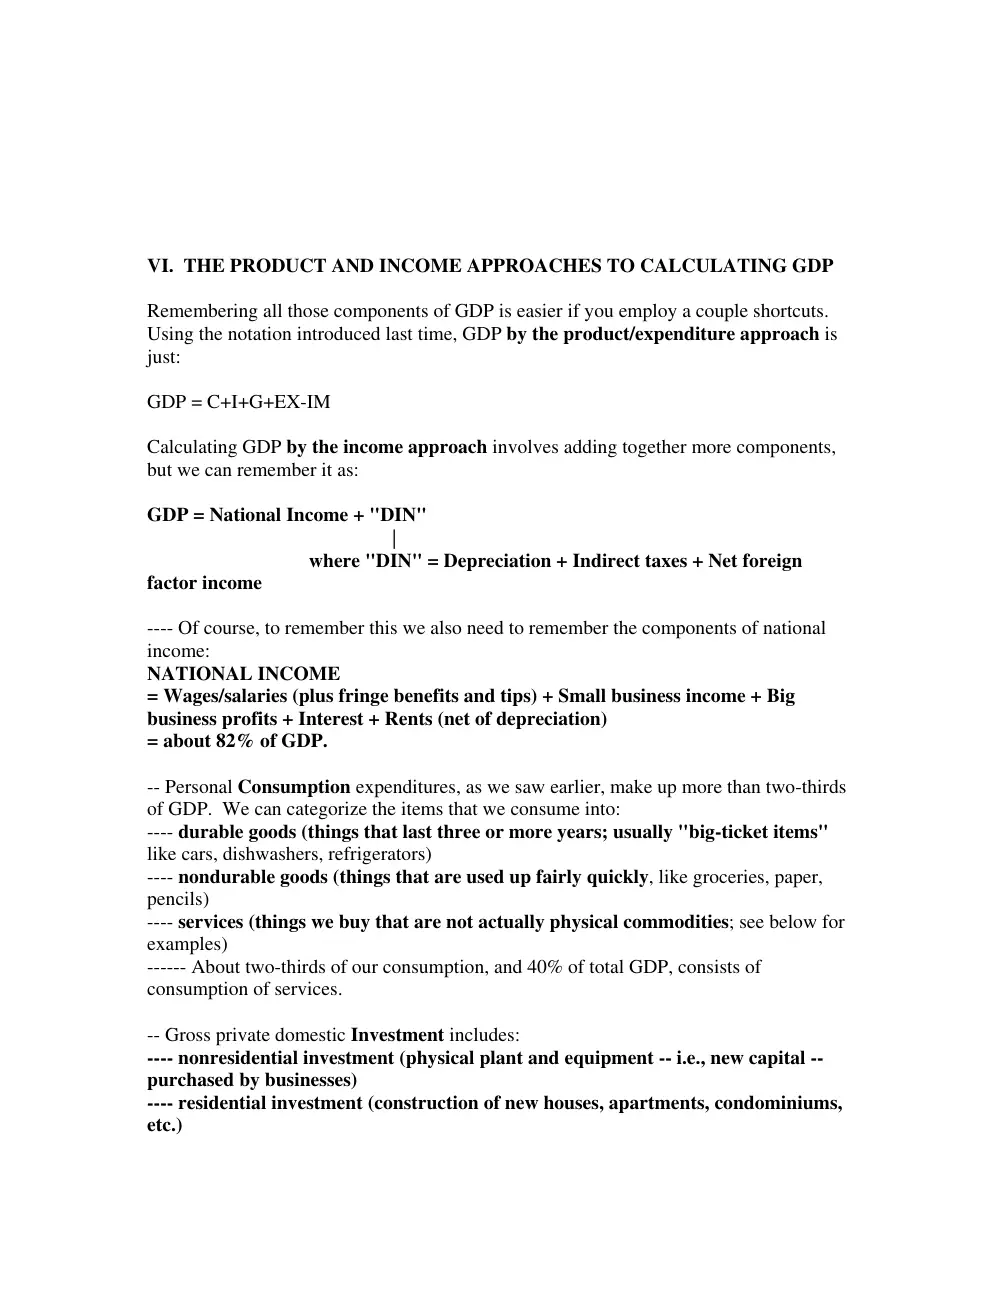
VI. THE PRODUCT AND INCOME APPROACHES TO CALCULATING GDP
Remembering all those components of GDP is easier if you employ a couple shortcuts.
Using the notation introduced last time, GDP by the product/expenditure approach is
just:
GDP = C+I+G+EX-IM
Calculating GDP by the income approach involves adding together more components,
but we can remember it as:
GDP = National Income + "DIN"
|
where "DIN" = Depreciation + Indirect taxes + Net foreign
factor income
---- Of course, to remember this we also need to remember the components of national
income:
NATIONAL INCOME
= Wages/salaries (plus fringe benefits and tips) + Small business income + Big
business profits + Interest + Rents (net of depreciation)
= about 82% of GDP.
-- Personal Consumption expenditures, as we saw earlier, make up more than two-thirds
of GDP. We can categorize the items that we consume into:
---- durable goods (things that last three or more years; usually "big-ticket items"
like cars, dishwashers, refrigerators)
---- nondurable goods (things that are used up fairly quickly, like groceries, paper,
pencils)
---- services (things we buy that are not actually physical commodities; see below for
examples)
------ About two-thirds of our consumption, and 40% of total GDP, consists of
consumption of services.
-- Gross private domestic Investment includes:
---- nonresidential investment (physical plant and equipment -- i.e., new capital --
purchased by businesses)
---- residential investment (construction of new houses, apartments, condominiums,
etc.)
---- change in business inventories (goods produced by businesses but not sold within
the same year; see below)
-- Government purchases of goods and services are almost twice as large at the state &
local level (11.5% of GDP) than at the federal level (6.5% of GDP).
-- Net exports in the U.S. are negative and have been since about 1980, meaning that
the U.S. has been running a trade deficit (importing more than it exports). Economists
tend to think that the trade deficit is somewhat overblown as a national problem.
Two additional, and also useful, measures of national output or income are:
Defn. Net domestic product (NDP) = GDP - Depreciation
-- This is arguably a more useful measure than GDP, since depreciation in a sense makes
us poorer, by reducing our capacity to produce goods and services in the future. The only
problem with NDP is that depreciation is hard to measure precisely, so we can get a more
precise measure of GDP (using the expenditure approach) than we can of NDP.
Defn. Disposable income (after-tax income) = Income - Taxes
-- This is the part of your income that you are able to spend as you see fit. The part that
goes into income, payroll, and other taxes is technically income that you've earned but it's
income that you never see, so many people consider their disposable income to be the
most relevant measure of their income.
VII. WHAT GETS COUNTED IN GDP AND WHAT DOESN'T?
Repeating two key definitions from last time:
Defn. GDP (gross domestic product): the total market value of all final goods and
servicesproduced in a given year by factors of production located within a country
(regardless of who owns the factors of production).
Defn. GNP (gross national product): the total market value of all final goods and
services produced in a given year by factors of production owned by a country's
citizens.
Let's dissect the above definitions:
* "market"-- i.e., the good has to be bought and sold (or available for sale) in an
"above-ground" market. The market must be legal, and the income or transaction must
be reported to the government (for tax purposes).
-- Ex.: I get a haircut. If a barber cut it and reported the income to the government, my
payment for it would be counted in GDP. If my wife cut it and didn't report the income,
my payment would not be counted in GDP.
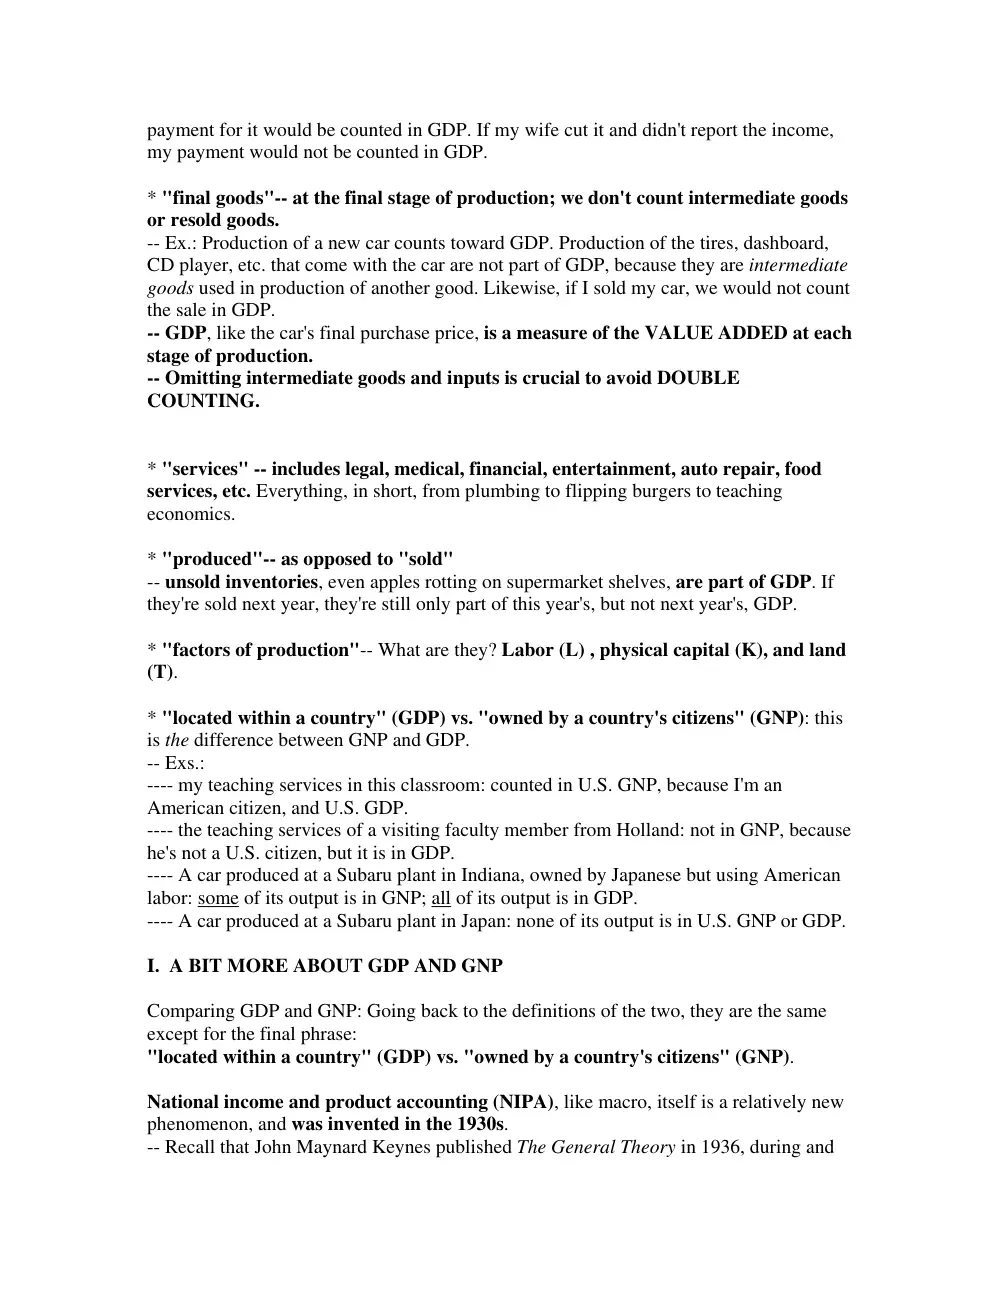
* "final goods"-- at the final stage of production; we don't count intermediate goods
or resold goods.
-- Ex.: Production of a new car counts toward GDP. Production of the tires, dashboard,
CD player, etc. that come with the car are not part of GDP, because they are intermediate
goods used in production of another good. Likewise, if I sold my car, we would not count
the sale in GDP.
-- GDP, like the car's final purchase price, is a measure of the VALUE ADDED at each
stage of production.
-- Omitting intermediate goods and inputs is crucial to avoid DOUBLE
COUNTING.
* "services" -- includes legal, medical, financial, entertainment, auto repair, food
services, etc. Everything, in short, from plumbing to flipping burgers to teaching
economics.
* "produced"-- as opposed to "sold"
-- unsold inventories, even apples rotting on supermarket shelves, are part of GDP. If
they're sold next year, they're still only part of this year's, but not next year's, GDP.
* "factors of production"-- What are they? Labor (L) , physical capital (K), and land
(T).
* "located within a country" (GDP) vs. "owned by a country's citizens" (GNP): this
is the difference between GNP and GDP.
-- Exs.:
---- my teaching services in this classroom: counted in U.S. GNP, because I'm an
American citizen, and U.S. GDP.
---- the teaching services of a visiting faculty member from Holland: not in GNP, because
he's not a U.S. citizen, but it is in GDP.
---- A car produced at a Subaru plant in Indiana, owned by Japanese but using American
labor: some of its output is in GNP; all of its output is in GDP.
---- A car produced at a Subaru plant in Japan: none of its output is in U.S. GNP or GDP.
I. A BIT MORE ABOUT GDP AND GNP
Comparing GDP and GNP: Going back to the definitions of the two, they are the same
except for the final phrase:
"located within a country" (GDP) vs. "owned by a country's citizens" (GNP).
National income and product accounting (NIPA), like macro, itself is a relatively new
phenomenon, and was invented in the 1930s.
-- Recall that John Maynard Keynes published The General Theory in 1936, during and
largely as an answer to the Great Depression.
Historical note: In the 1940s, during World War II, the U.S. and England had national
income accounting, and Hitler's Germany did not. That knowledge about national
production capabilities made a tremendous contribution to the Allies' military victory.
Calculating the level of GNP or GDP is not easy -- the U.S. Commerce Department
employs huge teams of economists and accountants to crunch out the "National Income
and Product Accounts" (NIPA).
VIII. PROS AND CONS OF GDP
Q: Why should you care about what the level of GDP is?
A: GDP has been called a country's "economic report card." It's not bad as a bottom-
line measure of how a nation is doing economically.
Per-capita GDP is a reasonable measure of a country's standard of living. In fact,
"standard of living" and "per capita GDP" have come to be virtually synonymous. Higher
per capita GDP <==> on average, people eating better, living in better dwellings,
healthier, better clothed, better educated, consuming more luxuries, etc.
A large absolute GDP ==> a powerful country (politically, militarily, diplomatically)
-- The U.S., with the world's largest GDP by far, is also "the world's only remaining
superpower." Like the 900-pound gorilla that sits wherever it wants, an economic
powerhouse like the U.S. wields enormous influence in world politics.
Also, you should care because it's an essential part of macro. Economics is about
measuring social data as well as interpreting it. Most people would agree that interpreting
the data is a lot more fun-- e.g., arguing over whether Reagan's supply-side policies
worked or didn't work -- and we'll get to that soon in this course. But for now, let's learn a
bit about what the data looks like and where it comes from.
GDP as the nation's "economic report card"? Obviously a bit limited. Economist Paul
Krugman, by contrast, stresses three "Roots of Economic Welfare":
1. Productivity Growth
-- (Productivity = Output per worker, or Output per worker-hour)
-- very similar to per-capita GDP (= GDP/population)
2. Income Distribution (i.e., should not be too skewed in favor of rich)
3. Job Creation
-- Krugman: "If these things are satisfactory, not much else can go wrong [in the
economy]. If they are not, nothing can go right."
-- Note: #1 and #3 are closely related to GDP growth. Productivity growth generally
translates into per-capita GDP growth, and rising GDP is generally associated with rising
employment.
-- #2 implicitly makes the obvious point that if most of the gains in national income are
going to a very small slice of the population, then most people's "economic welfare"
won't be improving much. And, in fact, according to economist Paul Krugman, in the
1980s, 66% of the after-tax gains went to the top 1% of wage-earners.
-- In an earlier lecture we noted that the distribution of U.S. income is very uneven. The
distribution of world income, as measured by GDP, is even more uneven.
-- The U.S., "Euroland," and Japan together account for 71% of world economic output.
---- ("Euroland" = the 11 Western European countries that are adopting a common
currency, the "Euro")
Other limitations of GDP and NDP:
1. They omit depreciation of the environment.
-- Ex.: If a 3rd-World country cuts down 1 million acres of rainforest in a year to sell
timber, the depreciation of the chainsaws and the logging trucks is counted as
depreciation, but the depreciation of the rainforest itself is not.
-- Ex.: Exxon Valdez spill was good for GDP! Poisoning of Prince Wm. Sound does not
count against GDP, but payments to cleanup crew count towards GDP.
2. They omit important household services, especially those that are normally
performed by women (e.g., child-rearing, cooking, and cleaning).
-- Such activities are only counted when you pay someone else to do them (and report
that income/payment to the government). Granted, the word "market" doesn't apply to
these services when homemakers perform them for free, but when a household hires a
maid or a nanny or a cook, those services are counted in GDP. Moreover, not every entry
in GDP is a transaction where money changes hands-- ex., "imputed" rent from owner-
occupied houses.
-- Ex.: 1950s family: Dad earns $50,000/year, Mom raises their two children, cooks,
cleans, etc. Then, Dad gets laid off and takes a lower-paying job and Mom takes job, such
that both now earn $25,000/year. They pay a nanny $10,000/year, a cook $10,000/year,
and a maid $10,000/year. The family is almost certainly worse off, yet they're now
contributing a lot more to GDP than before.
-- Ex.: Two welfare mothers who currently stay home and take care of their kids. Neither
is contributing to GDP. Under new reforms, they leave welfare and get jobs, taking care
of each other's kids. Now the work they do is counted in GDP.
3. They count military and wartime spending that provide no tangible good or
service. While one could think of military spending as providing a service (or "public
good") in the form of protection against foreign aggressors, GDP pioneer Simon Kuznets
himself advocated a "peacetime" concept of GDP and said:
"there is little sense in talking of protection of life and limb against external enemies as
an economic service to individuals -- it is a precondition of such service, not a service in
itself."
4. They omit the value of leisure time.
-- If many Americans are "running faster and faster just to stay in place" -- i.e., working
ever-longer hours without seeing much of a rise in their pay -- they are probably worse
off, yet GDP wouldn't reflect their forgone leisure time.
-- In a recent book called The Overworked American, Harvard economist Juliet Schor
argues that Americans' work weeks are the longest of any major industrialized country
and that the typical American's work week has gotten much longer in recent years.
-- Historical example: After Emancipation in 1865, the total labor supply of former slaves
in the American South fell by one-third. Per-capita income per capita went down because
people -- namely the ex-slaves were better off. Instead of being compelled to work in the
fields from sunup till sundown, they now had the options of working less (consuming
leisure) or spending more time in household production (fixing up their houses, sewing
their own clothes, etc.). Clearly their quality of life had greatly improved, yet the South's
per-capita GDP would have fallen off greatly.
Alternative measures of economic well-being:
Net Economic Welfare (N.E.W.), invented by two Yale economists, William Nordhaus
and James Tobin, in 1972.
-- Start with NNP (Net National Product), modify as follows:
+ value of leisure time
+ underground economy (excludes illegal activities, but includes under-the-table
services such as babysitting, etc.)
- environmental damages
...
==> N.E.W. has been growing steadily, but also more slowly, than NNP since 1929.
Since 1940, N.E.W. < NNP.
Genuine Progress Indicator (GPI), created in the 1990s by a group in San Francisco
(Redefining Progress). Like the N.E.W., it takes into account environmental damages
and leisure time. It also adds in the value of unpaid household production and subtracts
out spending on services like anti-theft devices and private bodyguards that are purchased
merely as protections against social ills like crime.
IX. NOMINAL VS. REAL GDP
Defn. REAL: adjusted for inflation; relative to the prices of other goods or other
years.
Defn. NOMINAL: measured in current dollars, without regard to other prices or
purchasing power.
Defn. NOMINAL GDP: GDP measured in current dollars; computed by adding up
the market value of all final goods and services produced.
-- How we compute nominal GDP: For each good or service, total up the quantity
produced (q) and multiply it by the price (p) of that good or service. Then add all of those
values together (the product, p*q, of each good), and their sum is nominal GDP.
-- Shorthand: nominal GDP = Σpiqi, where i is each good or service.
|
Σ is the Greek letter "sigma" and it means "summation," or "sum of."
-- Ex.: A small island economy, which produces just three goods -- beer, pretzels, and
bicycles. Using hypothetical prices and quantities of those goods, we can compute
nominal GDP as follows:
Commodity
p
q
p times q
Case of beer
$20 100 $2000
Bag of pretzels $1
100 + $100
Bicycle
$200 10 + $2000
TOTAL GDP
$4100
Defn. REAL GDP: GDP measured in constant dollars, i.e. the prices of a "base"
year. Ex.: 1992 nominal GDP was $6 trillion, 1992 real GDP was $5 trillion in 1987
dollars.
Now for some notation:
Q = real GDP
P = price index
-- P = 100 for a base year (say, 1992) that we use to compute real GDP
\
The price index is really a percentage of the base year's price level. So it's equal
to 100% in the base year.
-- The price index we'll be using today is the GDP price index, or GDP deflator, which is
used for converting nominal GDP into real GDP. It's also our broadest measure of the
general price level.
Now, here's how to compute real GDP from nominal GDP:
Real GDP = (Nominal GDP)/[(GDP Price Index)/100]
or, writing the same thing in our shorthand notation:
Q = (Nominal GDP)/(P/100)
-- In the base year, when P=100, nominal GDP and real GDP will always be equal.
-- In years when P > 100, real GDP will be less than nominal GDP.
-- In years when P < 100, real GDP will be greater than nominal GDP.
To compute nominal GDP from the GDP price index (P) and real GDP (Q):
Nominal GDP = (P/100) * Q
To compute the GDP price index (P) from nominal GDP and real GDP (Q):
P = [(nominal GDP)/(real GDP)] *100
-- Exs.:
Year Nominal GDP
(billions$)
Real GDP
(billions$) GDP price index
1992 6244.4
6244.4
100.00
1993 6558.1
6389.6
______
1995 7265.4
______
107.76
-- The base year is 1992. We know that because the price index (P) = 100 in 1992.
-- Now, let's fill in the blanks:
---- Real GDP in 1995 = (nominal GDP)/(P/100) = 7265.4/(107.76/100) = 7265.4/1.0776
= 6741.3
---- GDP price index in 1993 = ((nominal GDP)/Q) * 100 = 6558.1/6389.6 (*100) =
1.0264 * 100 = 102.64
X. CALCULATING REAL GDP AND THE GDP PRICE INDEX: AN EXAMPLE
1998 1998 1998
1999 1999 1999
Commodity
p
q
p * q
p
q
p * q
Cases of beer
$20 100 $2000
$22
95
$2090
Bags of pretzels
$1
100 + $100 $1.20 90
+ $108
Bicycles
$200 10
+ $2000 $210 10
+$2100
======
=====
NOMINAL GDP
$4100
in 1998
$4298
in 1999
Lakeland's nominal GDP was $198 (=$4298-$4100) higher in 1999 than in 1998, an
increase of 4.8% [= 100% * (($4298-$4100)/$4100))], but we can see that the quantities
produced two of the commodities (beer, pretzels) are actually smaller than before and the
quantity of the other commodity (bicycles) is the same as before. Thus the increase in
nominal GDP gives the misleading impression that Lakeland's economy has gotten
bigger, when in fact i