
ECON 213 Final, Spring 2008
American University of Beirut · Economics Statistics I · 6 pages


More ECON 213 files
Show the text of this final exam
Economic Statistics I
Dr. Nisreen Salti
American University of Beirut
Fall 2006
Mock …nal: Solutions
1
Problem 1
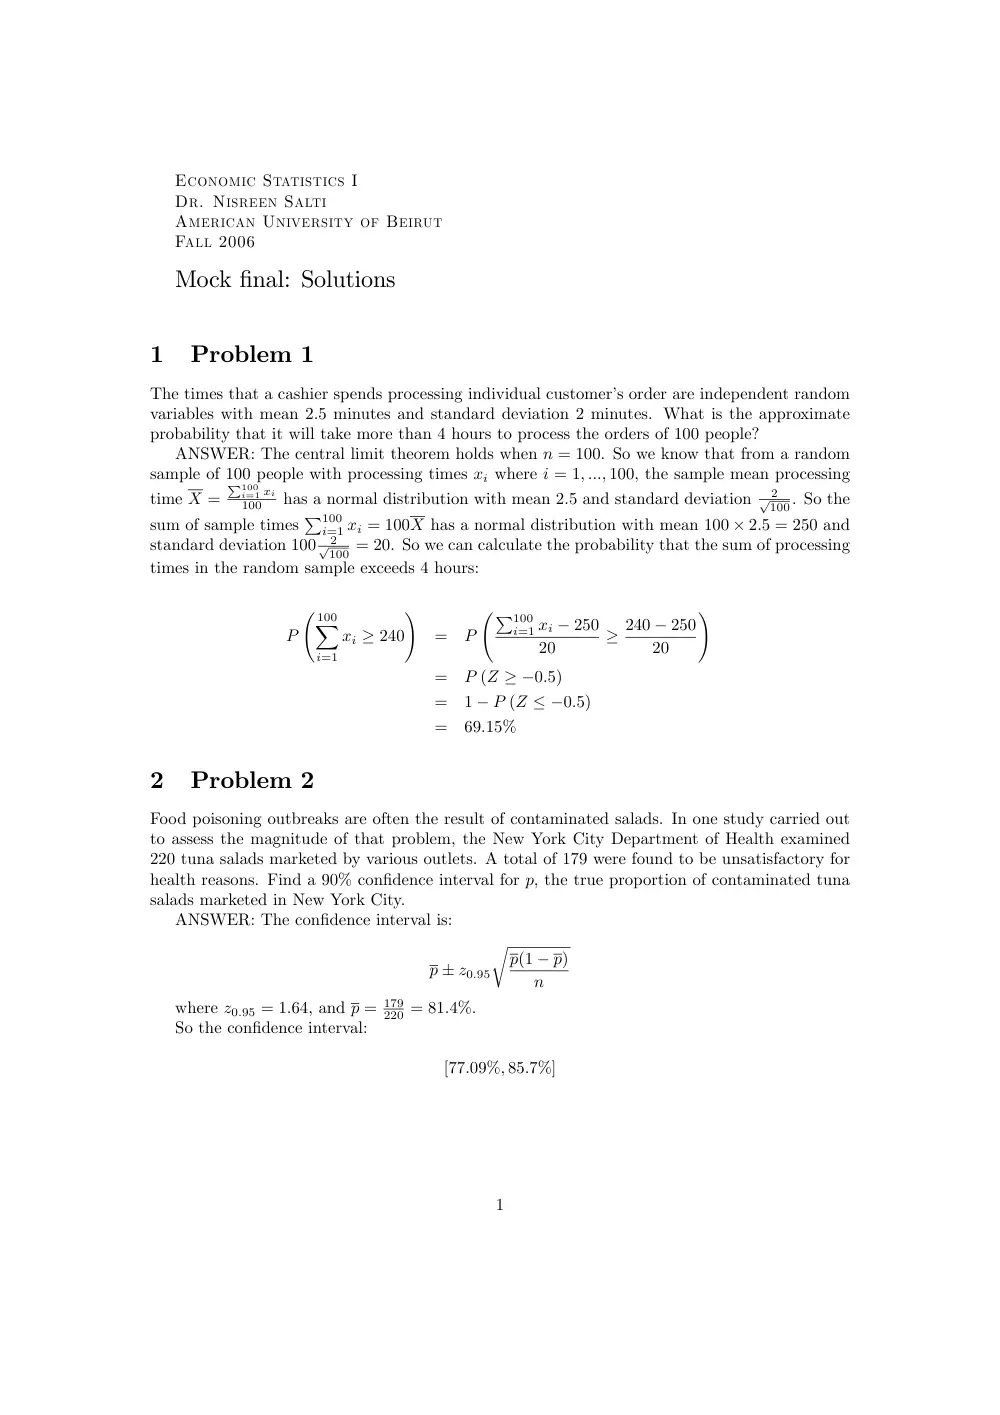
The times that a cashier spends processing individual customer’s order are independent random
variables with mean 2:5 minutes and standard deviation 2 minutes. What is the approximate
probability that it will take more than 4 hours to process the orders of 100 people?
ANSWER: The central limit theorem holds when n = 100. So we know that from a random
sample of 100 people with processing times xi where i = 1; :::; 100, the sample mean processing
time X =
P100
i=1 xi
100
has a normal distribution with mean 2:5 and standard deviation
2
p
100. So the
sum of sample times P100
i=1 xi = 100X has a normal distribution with mean 100 � 2:5 = 250 and
standard deviation 100
2
p
100 = 20. So we can calculate the probability that the sum of processing
times in the random sample exceeds 4 hours:
P
100
X
i=1
xi � 240
!
=
P
P100
i=1 xi � 250
20
� 240 � 250
20
!
=
P (Z � �0:5)
=
1 � P (Z � �0:5)
=
69:15%
2
Problem 2
Food poisoning outbreaks are often the result of contaminated salads. In one study carried out
to assess the magnitude of that problem, the New York City Department of Health examined
220 tuna salads marketed by various outlets. A total of 179 were found to be unsatisfactory for
health reasons. Find a 90% con…dence interval for p, the true proportion of contaminated tuna
salads marketed in New York City.
ANSWER: The con…dence interval is:
p � z0:95
r
p(1 � p)
n
where z0:95 = 1:64, and p = 179
220 = 81:4%.
So the con…dence interval:
[77:09%; 85:7%]
1
3
Problem 3
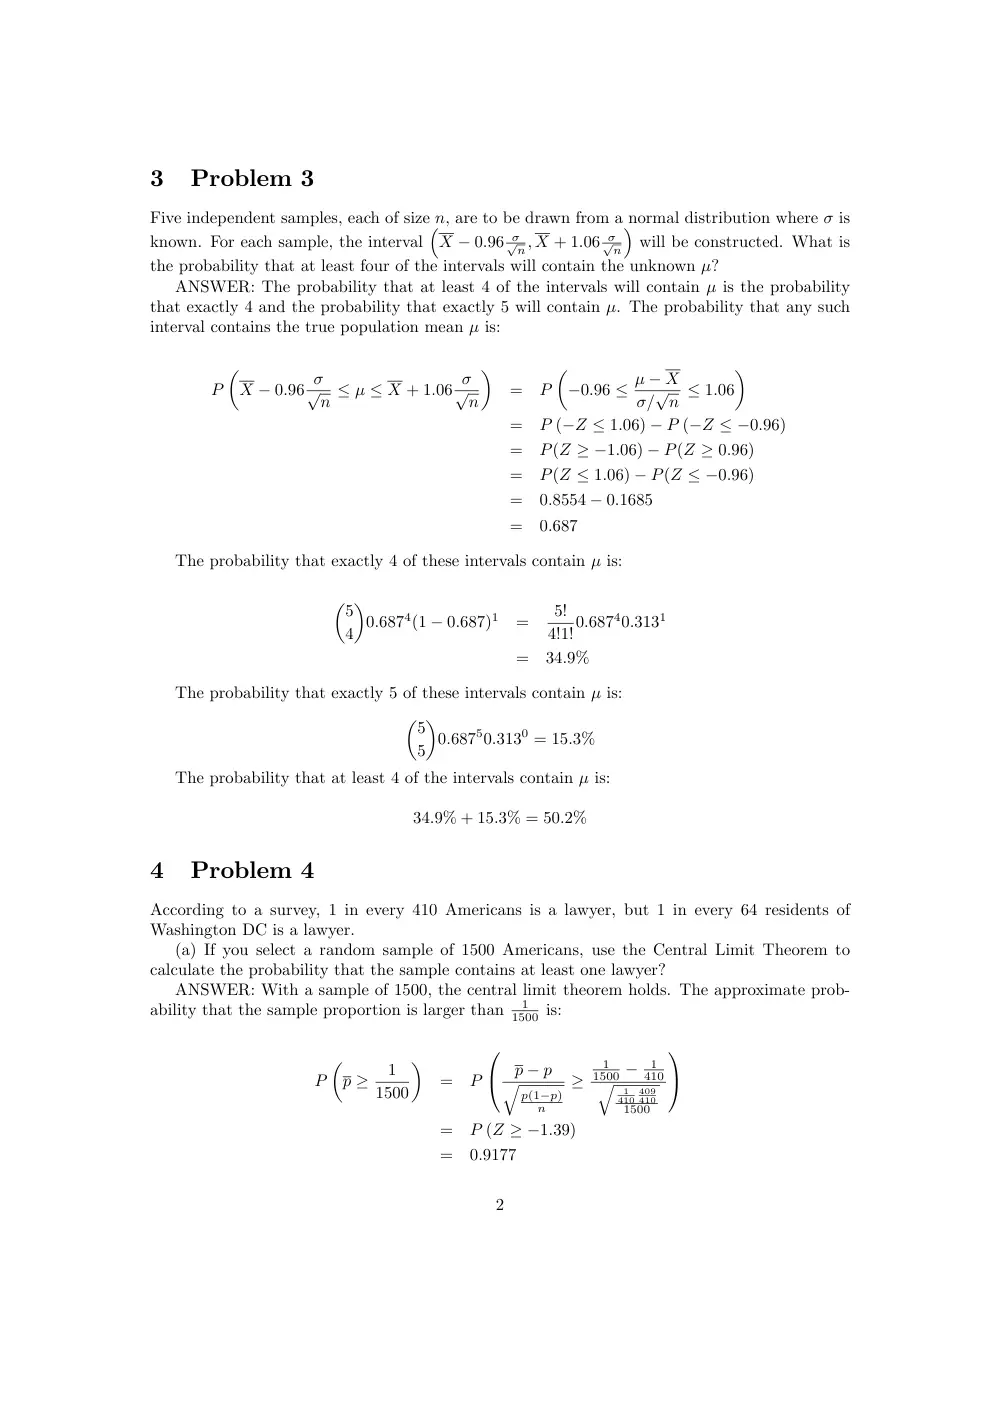
Five independent samples, each of size n, are to be drawn from a normal distribution where � is
known. For each sample, the interval
�
X � 0:96 �
pn; X + 1:06 �
pn
�
will be constructed. What is
the probability that at least four of the intervals will contain the unknown �?
ANSWER: The probability that at least 4 of the intervals will contain � is the probability
that exactly 4 and the probability that exactly 5 will contain �. The probability that any such
interval contains the true population mean � is:
P
�
X � 0:96 �
pn � � � X + 1:06 �
pn
�
=
P
�
�0:96 � � � X
�=pn � 1:06
�
=
P (�Z � 1:06) � P (�Z � �0:96)
=
P(Z � �1:06) � P(Z � 0:96)
=
P(Z � 1:06) � P(Z � �0:96)
=
0:8554 � 0:1685
=
0:687
The probability that exactly 4 of these intervals contain � is:
�5
4
�
0:6874(1 � 0:687)1
=
5!
4!1!0:68740:3131
=
34:9%
The probability that exactly 5 of these intervals contain � is:
�5
5
�
0:68750:3130 = 15:3%
The probability that at least 4 of the intervals contain � is:
34:9% + 15:3% = 50:2%
4
Problem 4
According to a survey, 1 in every 410 Americans is a lawyer, but 1 in every 64 residents of
Washington DC is a lawyer.
(a) If you select a random sample of 1500 Americans, use the Central Limit Theorem to
calculate the probability that the sample contains at least one lawyer?
ANSWER: With a sample of 1500, the central limit theorem holds. The approximate prob-
ability that the sample proportion is larger than
1
1500 is:
P
�
p �
1
1500
�
=
P
0
@
p � p
q
p(1�p)
n
�
1
1500 �
1
410
q
1
410
409
410
1500
1
A
=
P (Z � �1:39)
=
0:9177
2
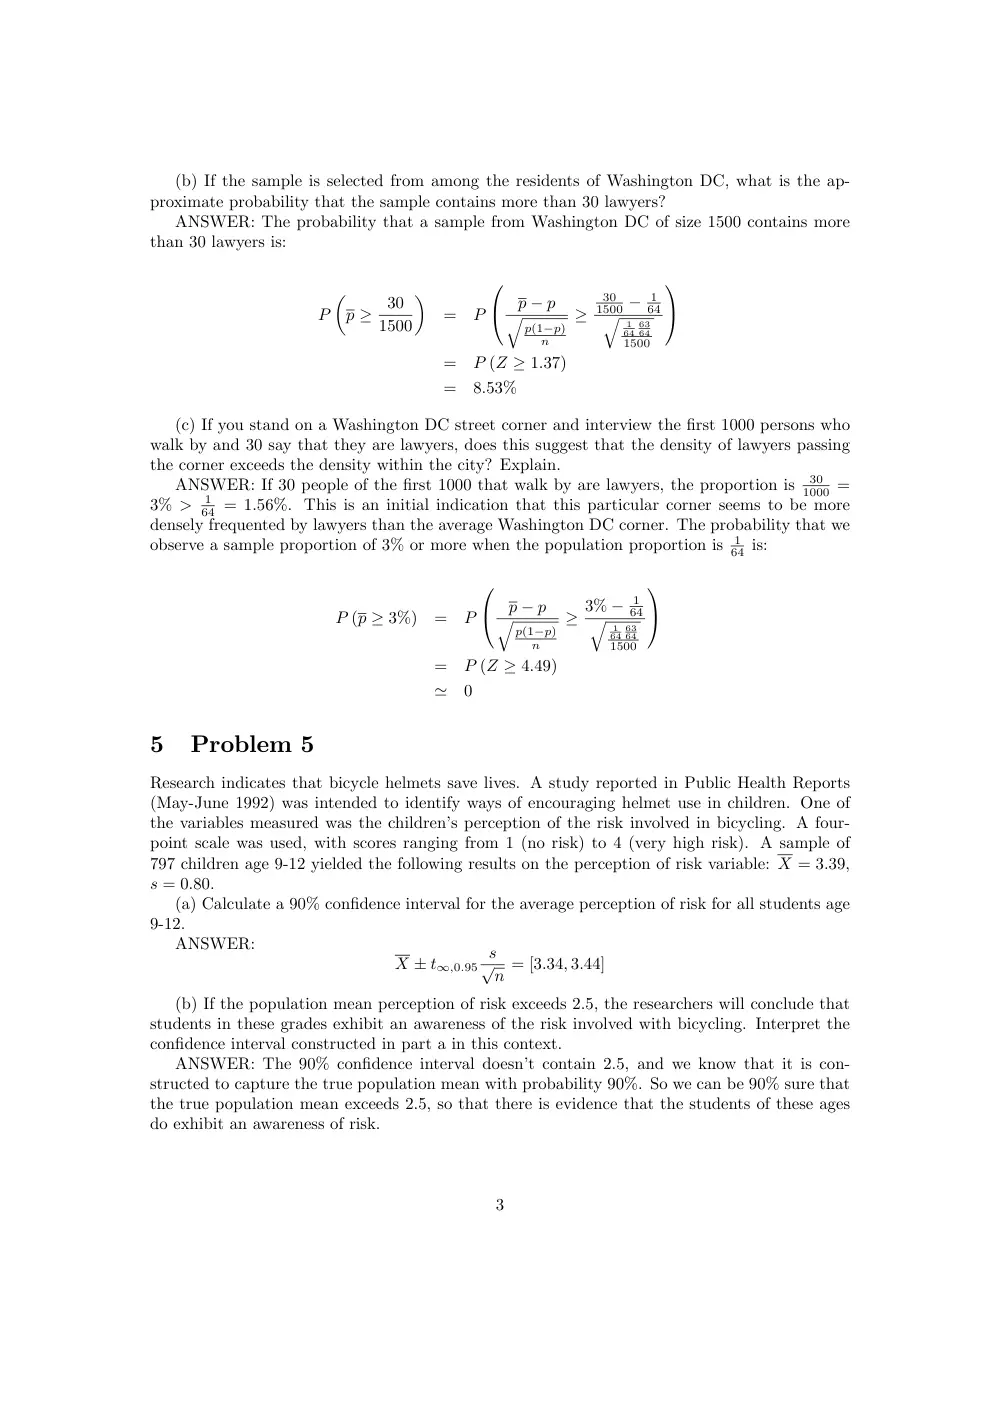
(b) If the sample is selected from among the residents of Washington DC, what is the ap-
proximate probability that the sample contains more than 30 lawyers?
ANSWER: The probability that a sample from Washington DC of size 1500 contains more
than 30 lawyers is:
P
�
p �
30
1500
�
=
P
0
@
p � p
q
p(1�p)
n
�
30
1500 � 1
64
q
1
64
63
64
1500
1
A
=
P (Z � 1:37)
=
8:53%
(c) If you stand on a Washington DC street corner and interview the …rst 1000 persons who
walk by and 30 say that they are lawyers, does this suggest that the density of lawyers passing
the corner exceeds the density within the city? Explain.
ANSWER: If 30 people of the …rst 1000 that walk by are lawyers, the proportion is
30
1000 =
3% >
1
64 = 1:56%. This is an initial indication that this particular corner seems to be more
densely frequented by lawyers than the average Washington DC corner. The probability that we
observe a sample proportion of 3% or more when the population proportion is
1
64 is:
P (p � 3%)
=
P
0
@
p � p
q
p(1�p)
n
� 3% � 1
64
q
1
64
63
64
1500
1
A
=
P (Z � 4:49)
'
0
5
Problem 5
Research indicates that bicycle helmets save lives. A study reported in Public Health Reports
(May-June 1992) was intended to identify ways of encouraging helmet use in children. One of
the variables measured was the children’s perception of the risk involved in bicycling. A four-
point scale was used, with scores ranging from 1 (no risk) to 4 (very high risk). A sample of
797 children age 9-12 yielded the following results on the perception of risk variable: X = 3:39,
s = 0:80.
(a) Calculate a 90% con…dence interval for the average perception of risk for all students age
9-12.
ANSWER:
X � t1;0:95
s
pn = [3:34; 3:44]
(b) If the population mean perception of risk exceeds 2.5, the researchers will conclude that
students in these grades exhibit an awareness of the risk involved with bicycling. Interpret the
con…dence interval constructed in part a in this context.
ANSWER: The 90% con…dence interval doesn’t contain 2.5, and we know that it is con-
structed to capture the true population mean with probability 90%. So we can be 90% sure that
the true population mean exceeds 2.5, so that there is evidence that the students of these ages
do exhibit an awareness of risk.
3
6
Problem 6
Greenpeace wants to test a randomly selected sample of n water specimens and estimate the mean
daily rate of pollution produced by a mining operation. If Greenpeace wants a 95% con…dence
interval estimate with a bound on the error of 1 milligram per liter (mg/L), how many water
specimens are required in the sample? Assume priori knowledge indicates that pollution readings
in water samples taken during a day are approximately normally distributed with a standard
deviation equal to 5mg=L.
ANSWER: � = 5mg=L: We are trying to …gure out the appropriate sample size that gives a
con…dence interval of width 2. The width of a 95% con…dence interval is 1:96 5
pn � 1.
n � 96
7
Problem 7
SAT scores, which have fallen slowly since the inception of the test, have now begun to rise. Orig-
inally, a score of 500 was intended to be average. The mean scores for 1991 were approximately
422 for the verbal test and 470 for the mathematics test. A random sample of the test scores
of 20 baccalaureate students from urban secondary schools produced the means and standard
deviations listed in this table:
Verbal
Mathematics
Sample mean
419
445
Sample standard deviation
57
69
(a) Find a 90% con…dence interval for the mean verbal SAT scores for students from urban
schools, knowing that the population scores of students are normally distributed.
ANSWER:
�
X � t19;0:95
s
pn
�
= [396:96; 441:04]
(b) Does the interval you found in part (a) include the value 422, the true mean of the SAT
score for 1991? What can you conclude?
ANSWER: The 90% con…dence interval calculated includes the value 422, and since this
con…dence interval has a 90% chance of capturing the true population mean, we cannot rule out
the possibility that the population mean verbal SAT score for students from urban schools is the
same as for the general population of test takers.
(c) Construct a 90% con…dence interval for the mean mathematics score for the urban sec-
ondary school baccalaureate students. Does the interval include 470, the true mean mathematics
score for 1991? What can you conclude?
ANSWER:
[418:32; 471:78]
The interval above also includes 470 which means that we cannot, with 90% con…dence, rule
out that the true population mean for the mathematics score of urban students is the same as
for the general population of test takers.
(d) Test at the 5% level of signi…cance the null hypothesis that urban students do better on
the verbal test than the overall population of students taking the test.
ANSWER: The hypothesis to test is speci…ed in the question to be that urban students do
better than the general population of test takers on average:
H0 : � > 422
4
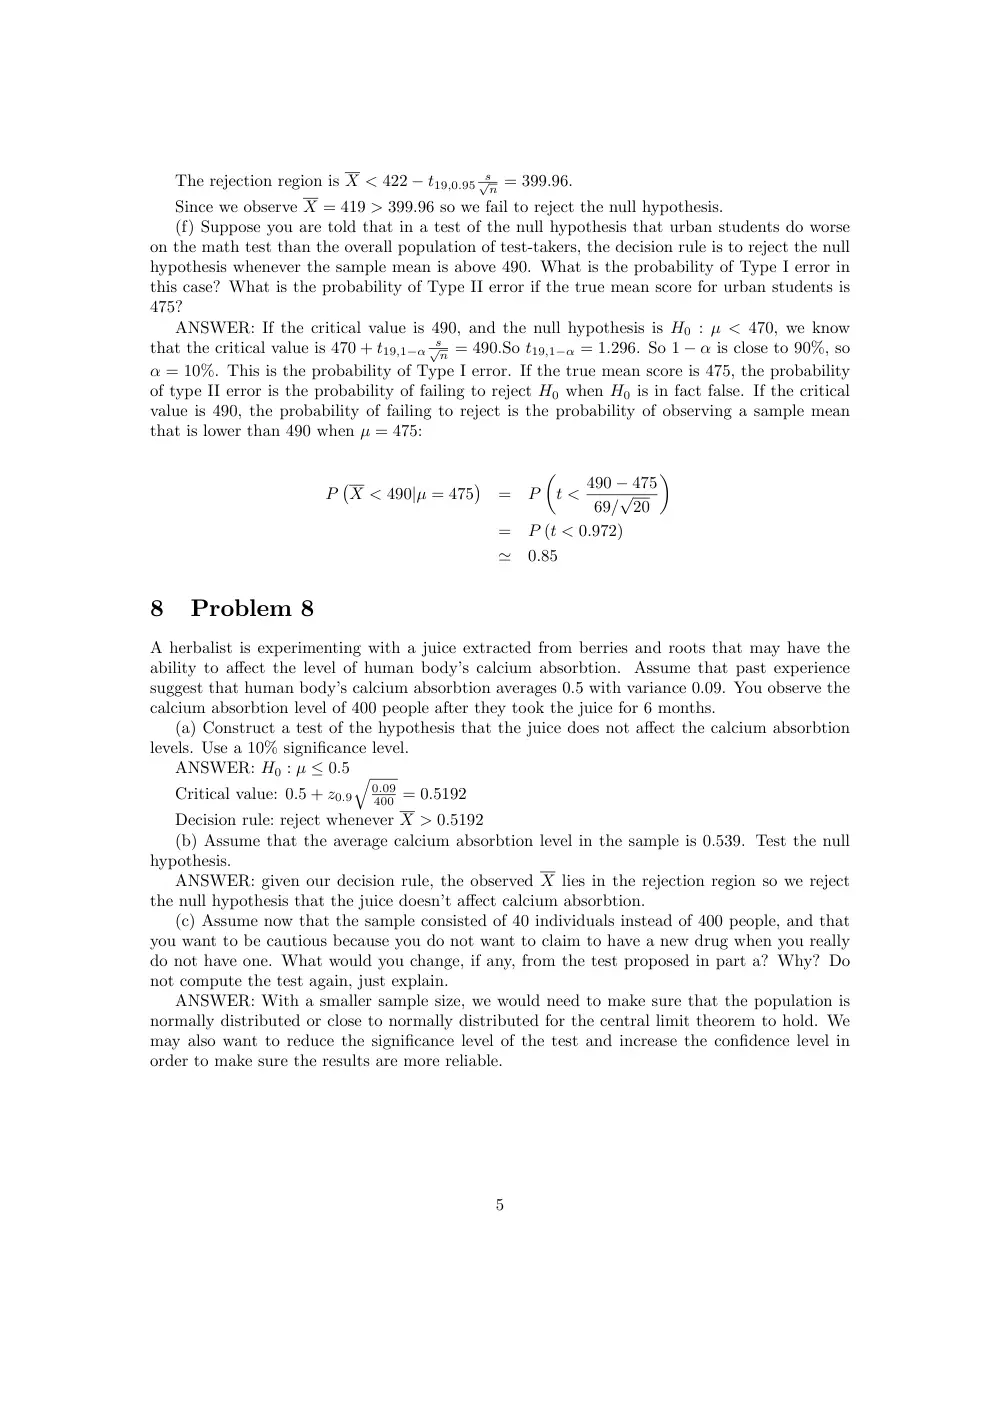
The rejection region is X < 422 � t19;0:95 s
pn = 399:96.
Since we observe X = 419 > 399:96 so we fail to reject the null hypothesis.
(f) Suppose you are told that in a test of the null hypothesis that urban students do worse
on the math test than the overall population of test-takers, the decision rule is to reject the null
hypothesis whenever the sample mean is above 490. What is the probability of Type I error in
this case? What is the probability of Type II error if the true mean score for urban students is
475?
ANSWER: If the critical value is 490, and the null hypothesis is H0 : � < 470, we know
that the critical value is 470 + t19;1�� s
pn = 490:So t19;1�� = 1:296. So 1 � � is close to 90%, so
� = 10%. This is the probability of Type I error. If the true mean score is 475, the probability
of type II error is the probability of failing to reject H0 when H0 is in fact false. If the critical
value is 490, the probability of failing to reject is the probability of observing a sample mean
that is lower than 490 when � = 475:
P
�
X < 490j� = 475
�
=
P
�
t < 490 � 475
69=
p
20
�
=
P (t < 0:972)
'
0:85
8
Problem 8
A herbalist is experimenting with a juice extracted from berries and roots that may have the
ability to a¤ect the level of human body’s calcium absorbtion. Assume that past experience
suggest that human body’s calcium absorbtion averages 0.5 with variance 0.09. You observe the
calcium absorbtion level of 400 people after they took the juice for 6 months.
(a) Construct a test of the hypothesis that the juice does not a¤ect the calcium absorbtion
levels. Use a 10% signi…cance level.
ANSWER: H0 : � � 0:5
Critical value: 0:5 + z0:9
q
0:09
400 = 0:5192
Decision rule: reject whenever X > 0:5192
(b) Assume that the average calcium absorbtion level in the sample is 0.539. Test the null
hypothesis.
ANSWER: given our decision rule, the observed X lies in the rejection region so we reject
the null hypothesis that the juice doesn’t a¤ect calcium absorbtion.
(c) Assume now that the sample consisted of 40 individuals instead of 400 people, and that
you want to be cautious because you do not want to claim to have a new drug when you really
do not have one. What would you change, if any, from the test proposed in part a? Why? Do
not compute the test again, just explain.
ANSWER: With a smaller sample size, we would need to make sure that the population is
normally distributed or close to normally distributed for the central limit theorem to hold. We
may also want to reduce the signi…cance level of the test and increase the con…dence level in
order to make sure the results are more reliable.
5
9
Problem 9
The placebo e¤ect describes the phenomenon of improvement in the condition of a patient taking
a placebo –a pill that looks and tastes real but contains no medically active chemicals. Physicians
at a clinic gave what they thought were drugs to 7,000 asthma, ulcer, and heartburn patients.
Although the doctors later learned that the drugs were really placebos, 70% of the patients
reported an improved condition. Use this information to test (at � = 0:05) the placebo e¤ect
at the clinic. Assume that if the placebo is ine¤ective, the probability of a patient’s condition
improving is 0.5.
ANSWER: We are asked to test the placebo e¤ect. And the hypothesis that gets tested is the
null hypothesis. So if p is the true proportion of patients who do better after taking a placebo
pill, the null hypothesis here is:
H0 : p > 0:5
The critical value is: 0:5 � z0:95
q
0:5(1�0:5)
7000
= 0:49.
The rejection region is bp < 0:49. In our case bp = 0:7 > 0:49 so our sample provides ample
evidence at the 95% con…dence level of the presence of a placebo e¤ect.
6