
EDUC 227 Final, Fall 2005
American University of Beirut · Statistics in Education · 5 pages

More EDUC 227 files
Show the text of this final exam
EDUC 227
FINAL, FALL 05
NAME: SECTION:
1. At a major restaurant, the manager collected data about the amount spent per
customer for dinner for a sample of 49 customers over a 3-week period. He found that
the sample mean is $12.6 and the sample standard deviation is $2.8
4% (a) What is the standard error of the mean?
8% (b) Construct the 95% confidence interval for the population mean
4% (c) Test the hypothesis H0 =11 against the alternative hypothesis H1
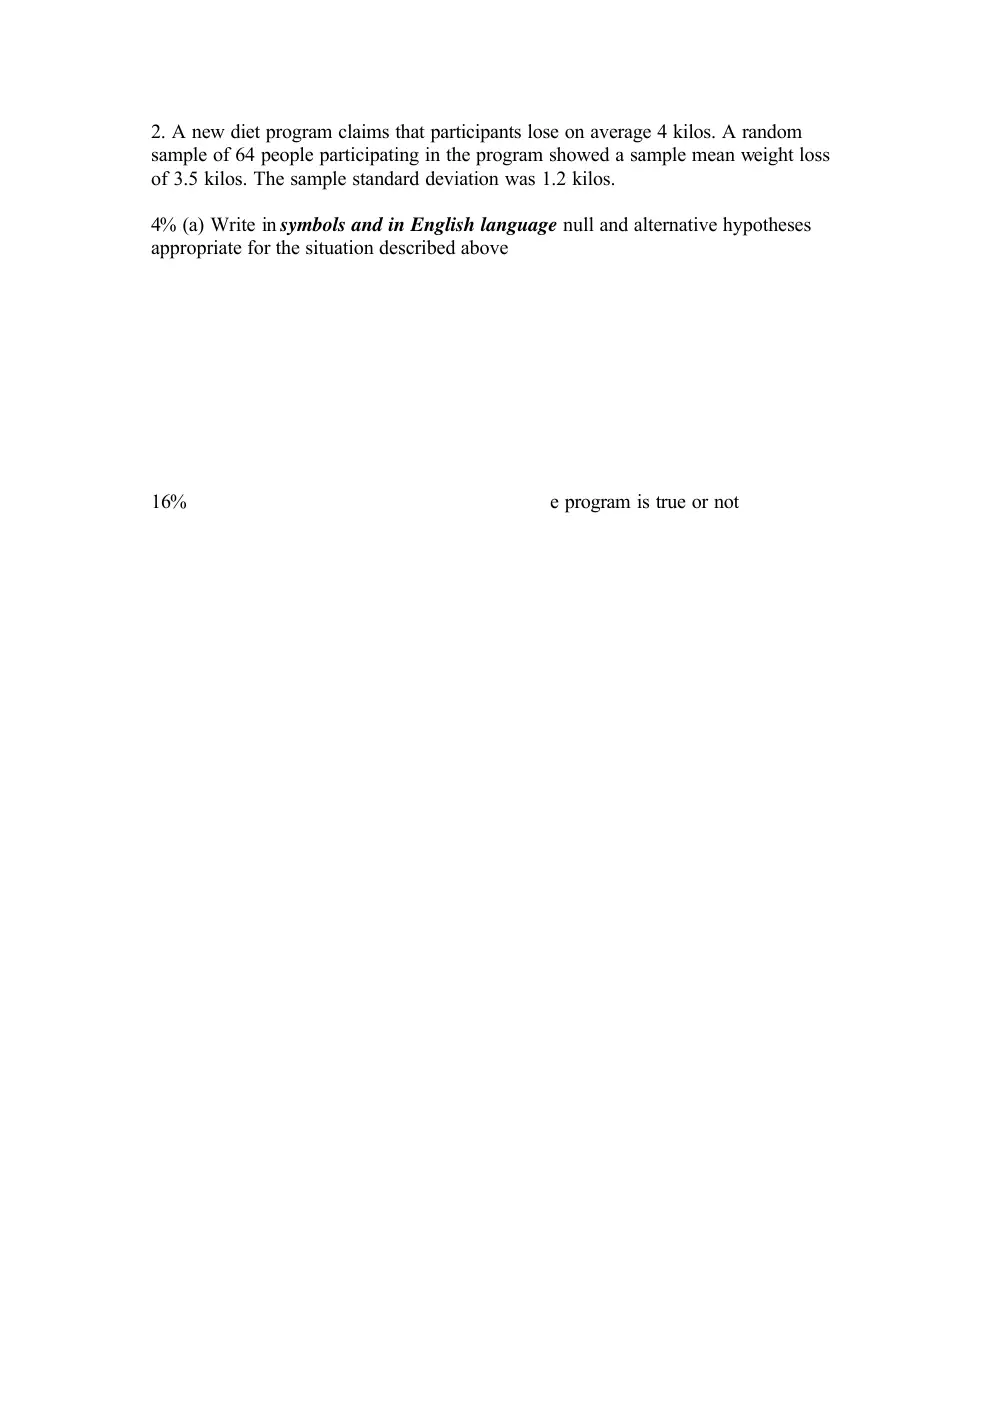
2. A new diet program claims that participants lose on average 4 kilos. A random
sample of 64 people participating in the program showed a sample mean weight loss
of 3.5 kilos. The sample standard deviation was 1.2 kilos.
4% (a) Write in symbols and in English language null and alternative hypotheses
appropriate for the situation described above
16%
e program is true or not
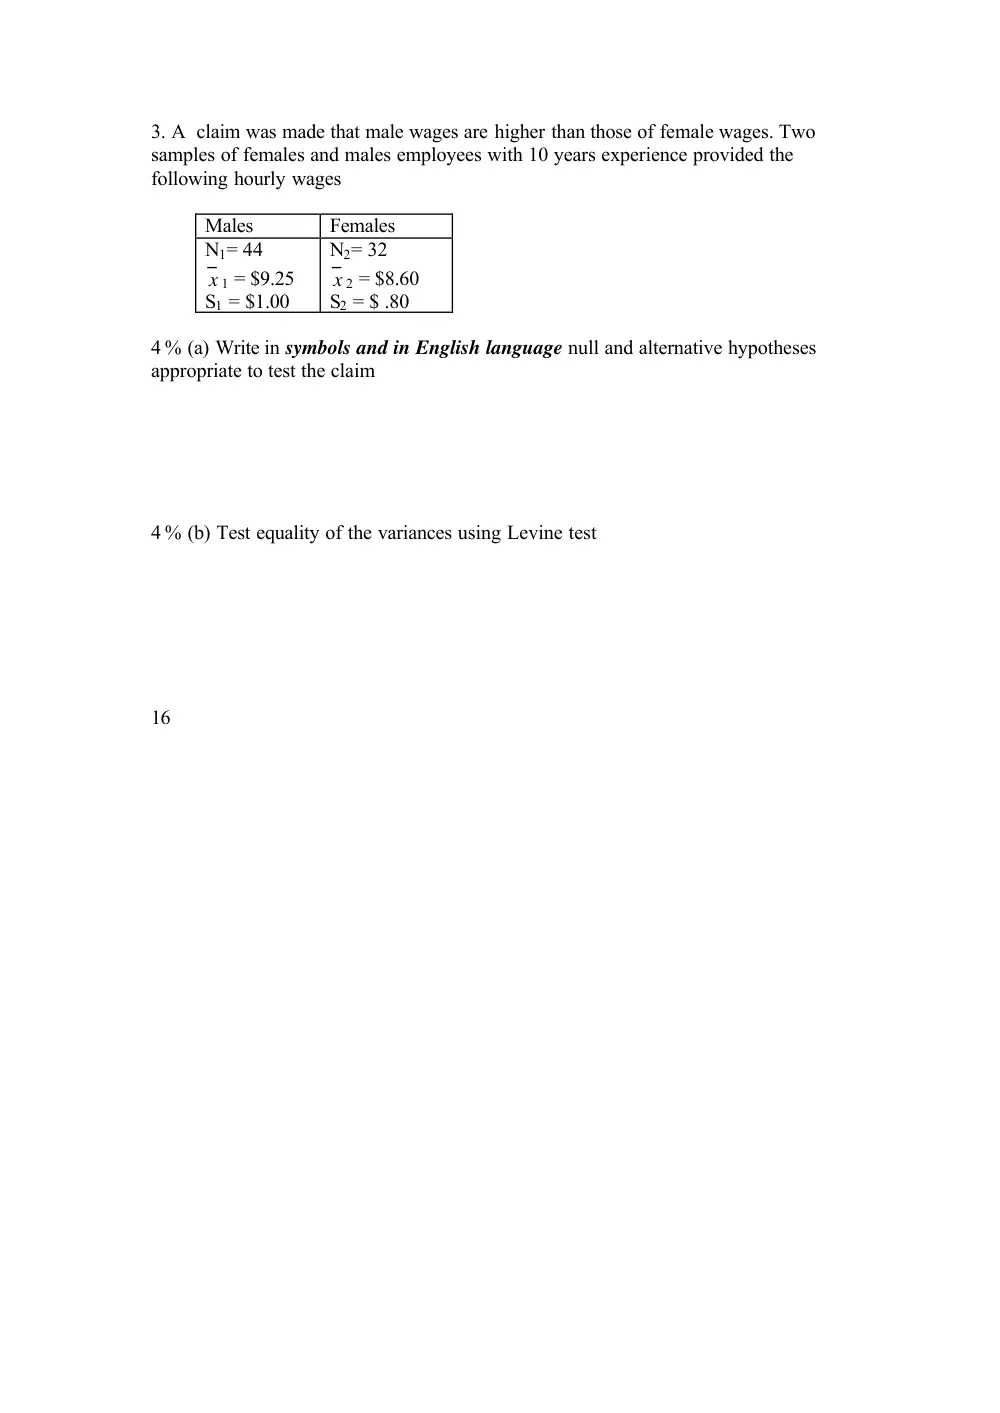
3. A claim was made that male wages are higher than those of female wages. Two
samples of females and males employees with 10 years experience provided the
following hourly wages
Males
Females
N1= 44
x 1 = $9.25
S1 = $1.00
N2= 32
x 2 = $8.60
S2 = $ .80
4 % (a) Write in symbols and in English language null and alternative hypotheses
appropriate to test the claim
4 % (b) Test equality of the variances using Levine test
16
8 % (d) Write the 99% confidence interval for the difference of the males and females
population means
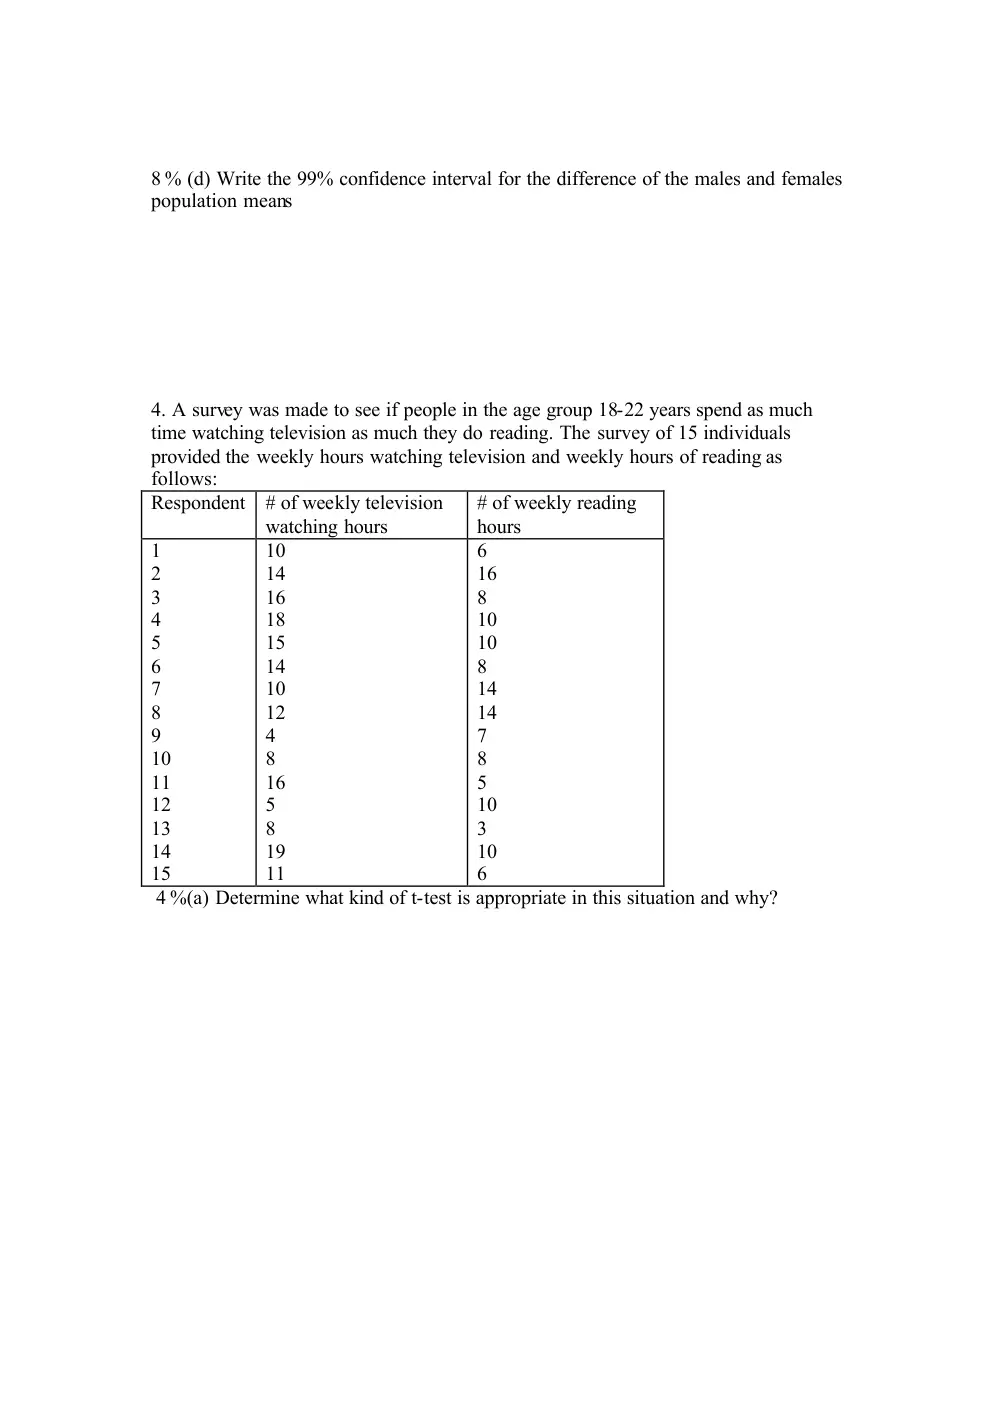
4. A survey was made to see if people in the age group 18-22 years spend as much
time watching television as much they do reading. The survey of 15 individuals
provided the weekly hours watching television and weekly hours of reading as
follows:
Respondent # of weekly television
watching hours
# of weekly reading
hours
1
2
3
4
5
6
7
8
9
10
11
12
13
14
15
10
14
16
18
15
14
10
12
4
8
16
5
8
19
11
6
16
8
10
10
8
14
14
7
8
5
10
3
10
6
4 %(a) Determine what kind of t-test is appropriate in this situation and why?
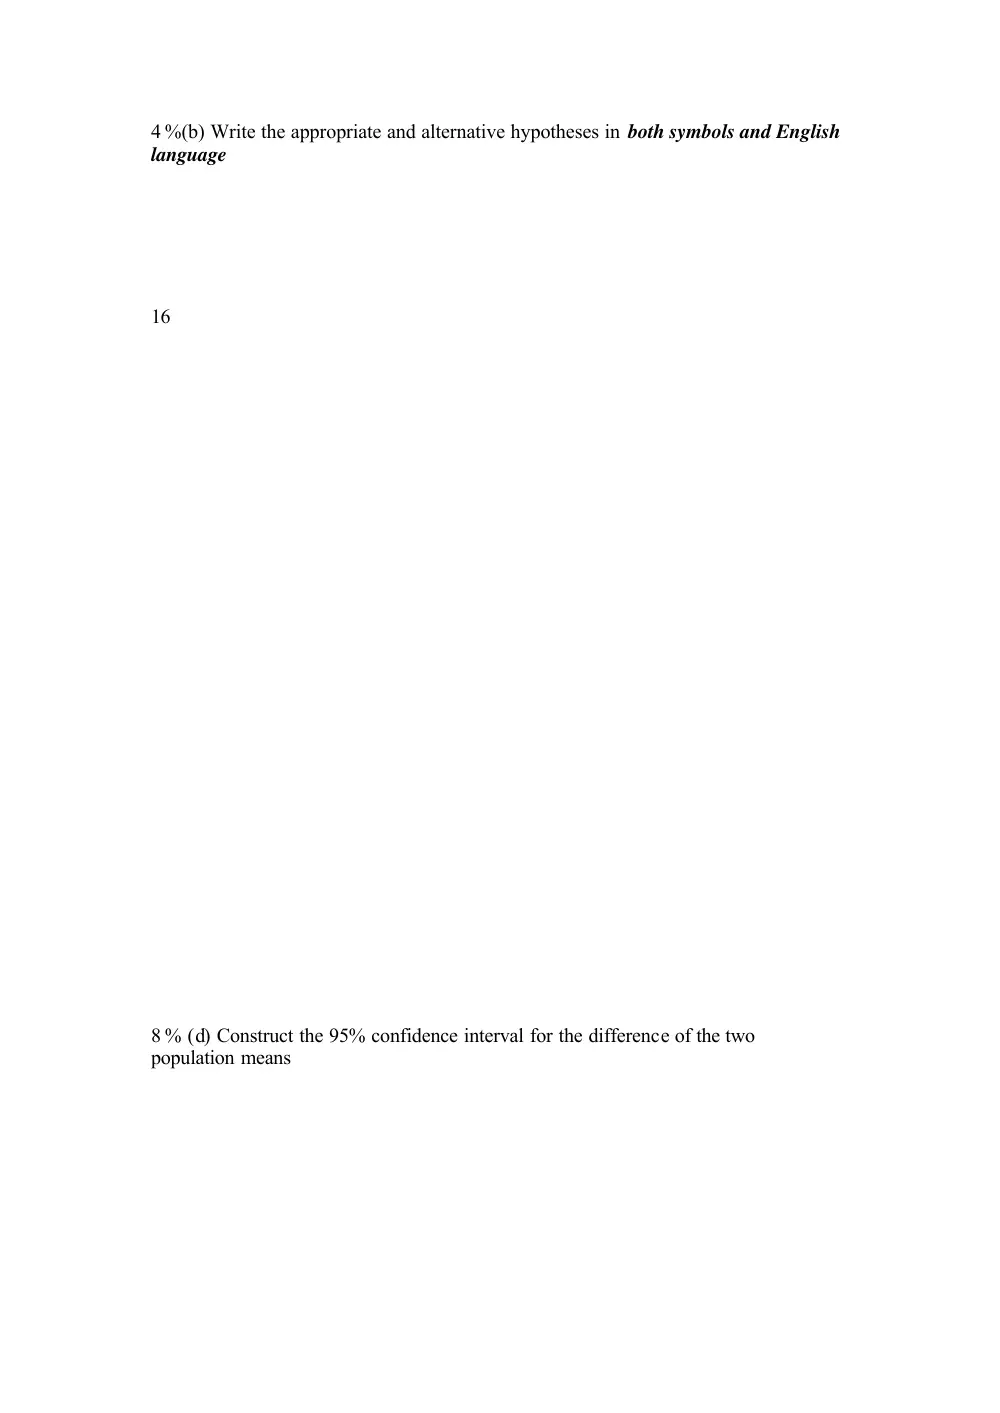
4 %(b) Write the appropriate and alternative hypotheses in both symbols and English
language
16
8 % (d) Construct the 95% confidence interval for the difference of the two
population means