
EECE 290 Homework, Spring 2008
American University of Beirut · Analog Signal Processing · 20 pages


Showing the first 10 of 20 pages. Download the PDF to see all of it.
More EECE 290 files
- Homework 1 To 14 · Spring 2016HomeworkView
- Homework 12 · Spring 2015HomeworkView
- Homework 1 · Spring 2015HomeworkView
- Homework 15 · Spring 2015HomeworkView
- Homework 10 · Spring 2015HomeworkView
- Homework 11 · Spring 2015HomeworkView
- Homework 13 · Spring 2015HomeworkView
- Homework 14 · Spring 2015HomeworkView
Show the text of this homework
é
13.59
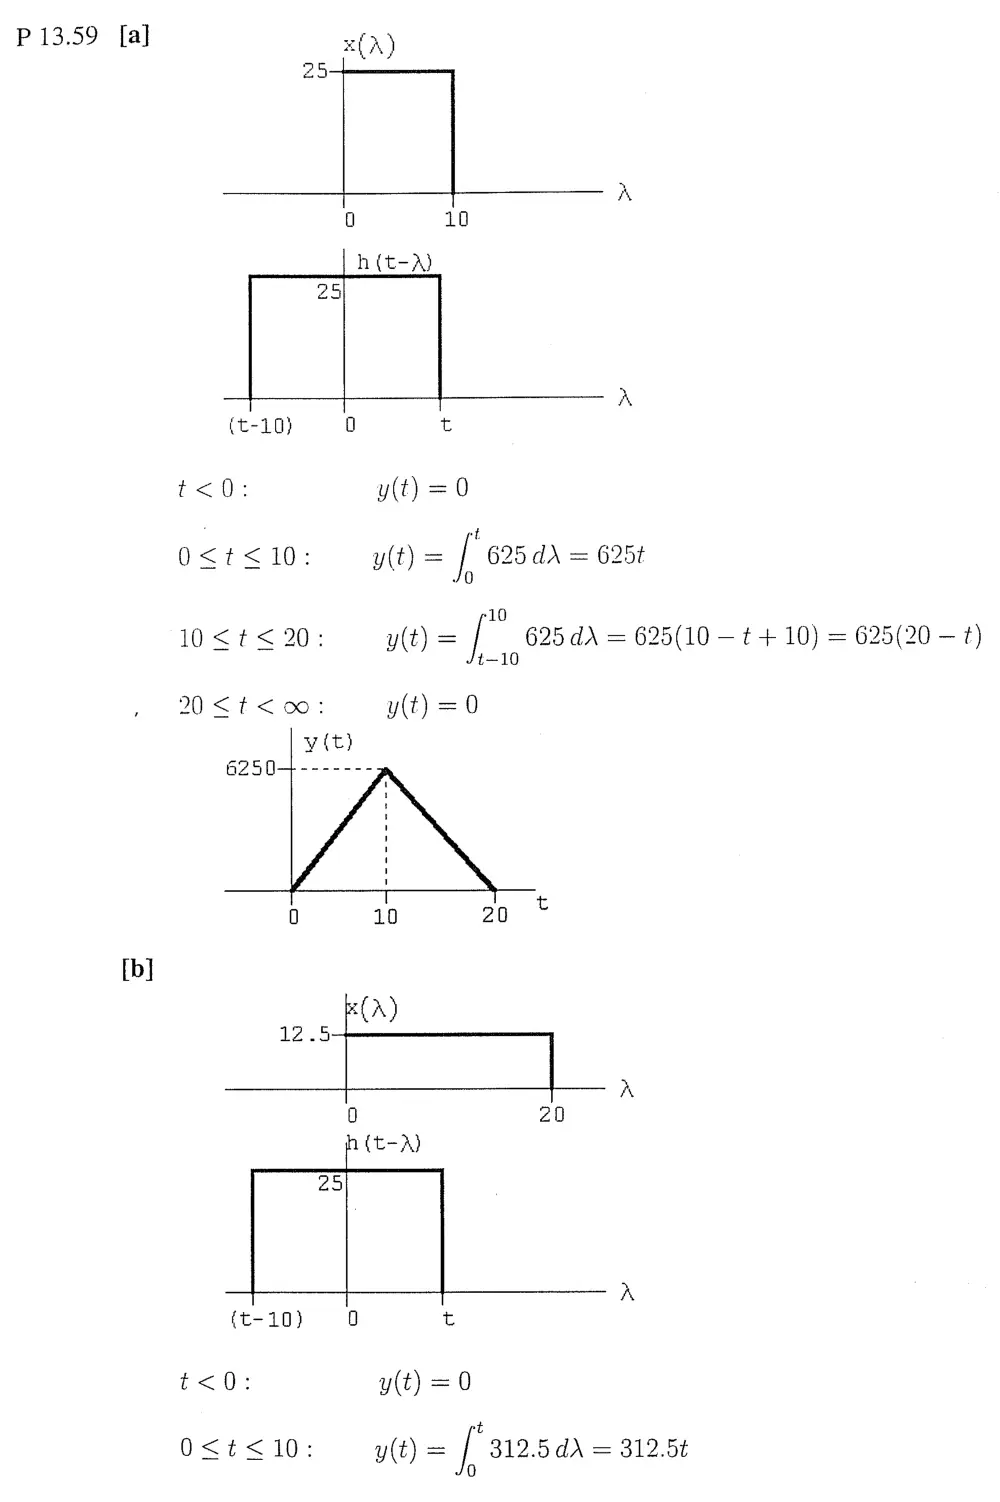
Find f(t) * x(t) when h(t) and x(t) are the
rectangular pulses shown in Fig. P13.59(a).
b) Repeat (a) when x(r) changes to the rect-
angular pulse shown in Fig. P13.59(b).
c) Repeat (a) when A(t) changes to the rect-
angular pulse shown in Fig. P13.59(c).
Figure P13.59
,
A(t) x(t)
25 25
t t
0 10 0 10
(a)
x(t) A(t)
25
12.5 : |
0 2° Olt ‘
(b) (c)
P 13.59 [a] x(A)
25
h(t-A)
25
A
(t-10) 0 t
t<0: y(t) =0
[b]
(A)
12.5
A
0 20
Ih (t-A)
25
A
(t-10) i) t
t<0 y(t) =0
[c]
ot
y(t) =| 312.5d\ = 3125
t
—10
y(t) = / 312.5 d\ = 312.5(30 — t)
t
2125
t
d
h(t-))
n
(t-1)} Ot
t<0 y(t) =0
t
0<t<1 y(t) = [625 aa = 628
ie}
t
1<t<10: y(t)=/ 625a\ = 625
t-1
10
l<t<u y(t) = [| 625d = 625(11 — 8)
t-1
ll<t<o: y(t) =0
ct)
625
T T t
AY 13.61
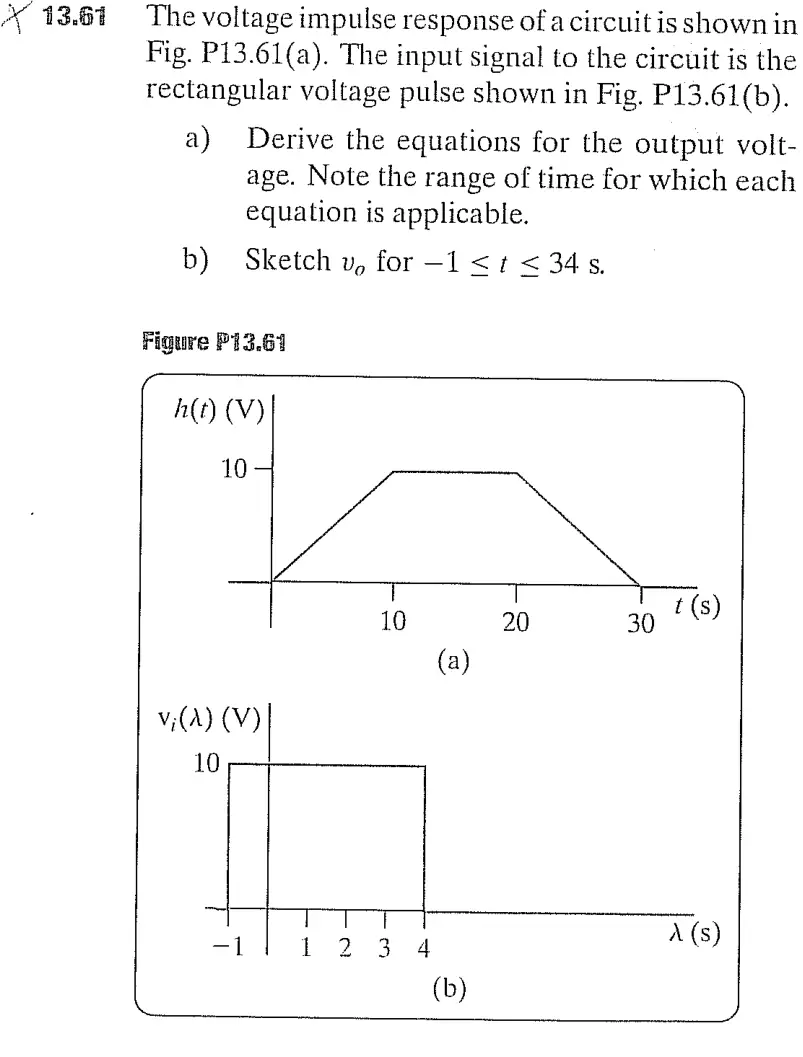
The voltage impulse response of a circuit is shown in
Fig. P13.61(a). The input signal to the circuit is the
rectangular voltage pulse shown in Fig. P13.61(b).
a) Derive the equations for the output volt-
age. Note the range of time for which each
equation is applicable.
b) Sketch v, for -1 <1 <345,
Figure P13.61
A(t) (V)
10
T T T
10 20 30 9)
(a)
vi(A) (V)
10
ali234 ro)
(b)
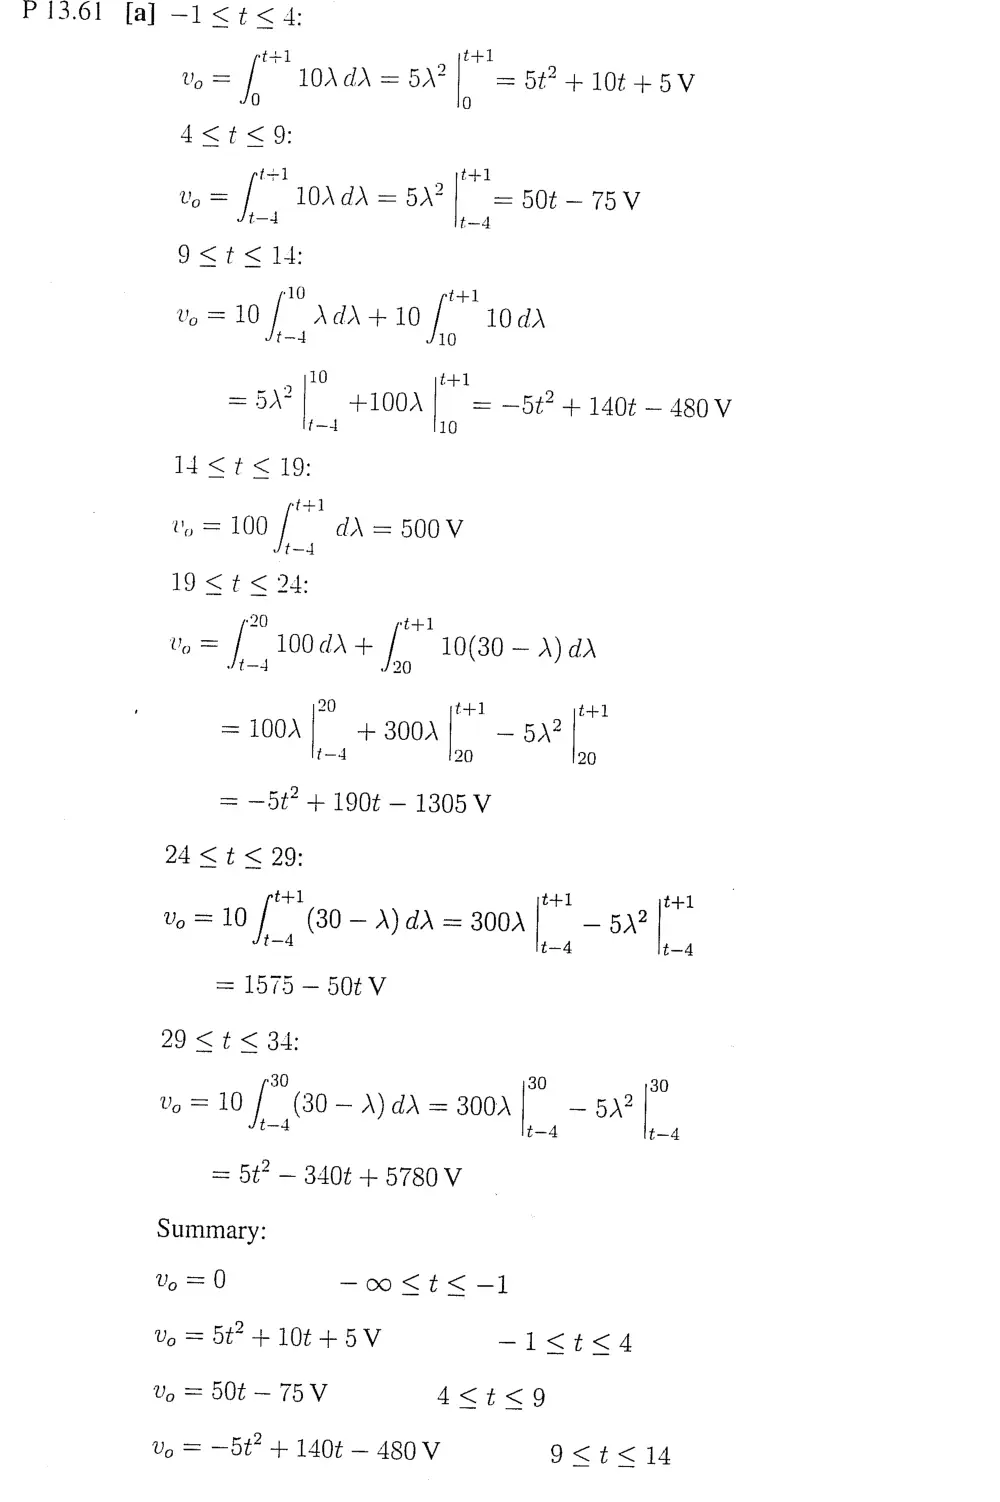
P13.61 [a] -l1<t<4;
t+1 > |}
Up = LOAd\ = 5A?) = 5t? + 10t+5V
0 0
A<t<9:
t+1 5 tl
Up = 1W\dA\=5\?} =50t—75V
t-—4 t—4
9<t<l4:
10 t+]
vo=10/ Ad\+10 10d)
t-4 10
10 t+1
=5)\? +100A | = —5t? + 140¢ — 480 V
t—4 10
1d<t<19:
rt]
vy = 100 d\ = 500V
t-4
19<t< 24:
+20 t+1
v= | 0d + | 10(30 — A) da
J/t—4 J20
20 t+1 t+1
= 100\ + 300A —5\?
t-4 20 20
= —5t? + 190t — 1305 V
24<t< 29:
t+1 t+1 t+1
U=10/ (30—A)dA=300A} — 5?
t—4 t-4 t-—4
= 1575 — 50tV
29<t< 34:
30 30 30
Ve=10/ (30—A)d\=300A| —5)?
t—4 t—4 t—4
= 5¢? — 340¢ + 5780 V
Summary:
Ug = 0 -o<t<-l
Uo = St? +10 +5V -1<t<4
Up = 50t — 75 V 4<t<9
Up = —5t? + 140t — 480 V 9<t<14
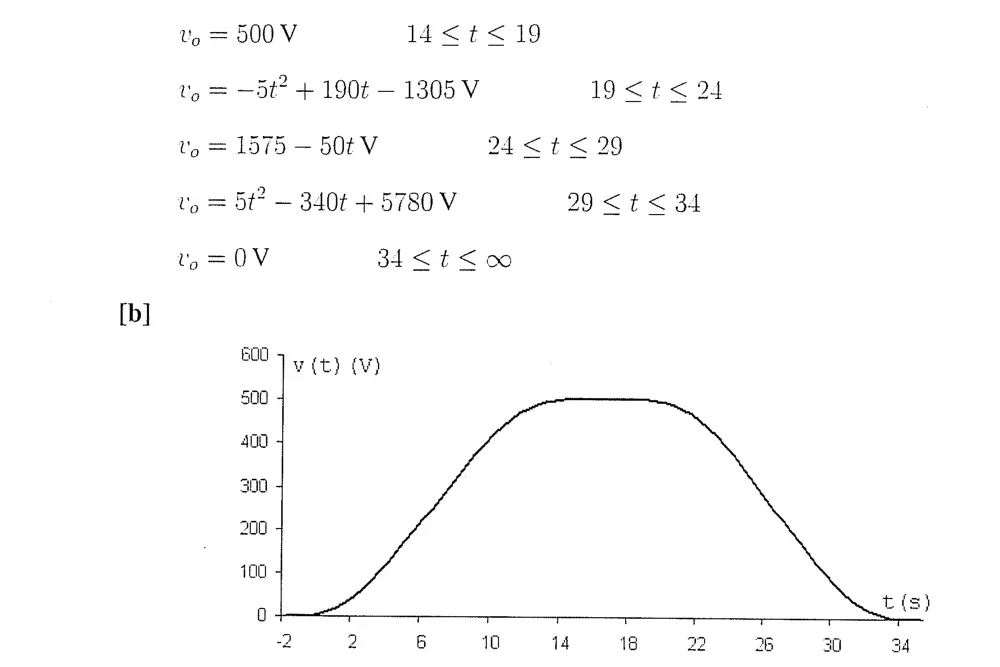
[b]
Ug = 500 V l4<t<19
Up = —5t? + 190¢ — 1305 V 19<t<24
ty = 1575 — 50tV 24 <t < 29
Up = 5t? — 340¢ + 5780 V 29<t< 34
lo = OV 384<t< oo
600 5 v(t) (Vv)
500 +
400 4
200 4
200 3
400
no
tu
a
Ss
=
a
nq
26
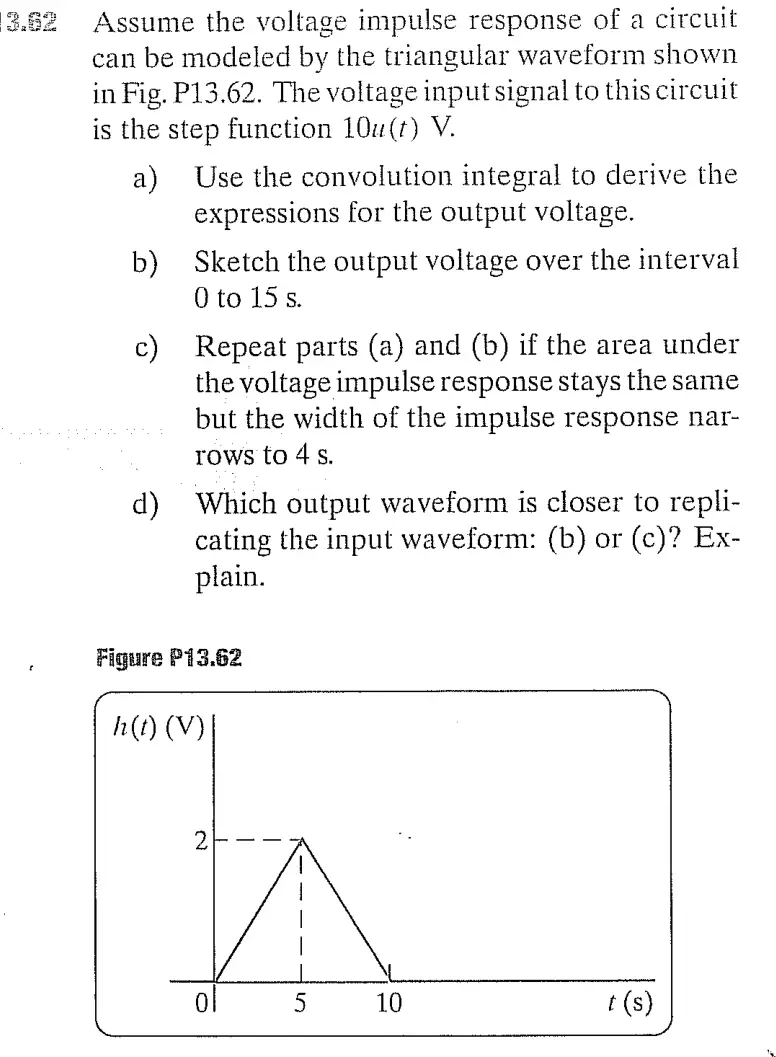
Assume the voltage impulse response of a circuit
can be modeled by the triangular waveform shown
in Fig. P13.62. The voltage input signal to this circuit
is the step function 10u(t) V.
a) Use the convolution integral to derive the
expressions for the output voltage.
b) Sketch the output voltage over the interval
Otol5s.
c) Repeat parts (a) and (b) if the area under
the voltage impulse response stays the same
but the width of the impulse response nar-
rows to 4s.
d) Which output waveform is closer to repli-
cating the input waveform: (b) or (c)? Ex-
plain.
: Figure P13.62
h(t) (V)
2 on
|
|
|
|
|
ol 5 10 t(s)
2
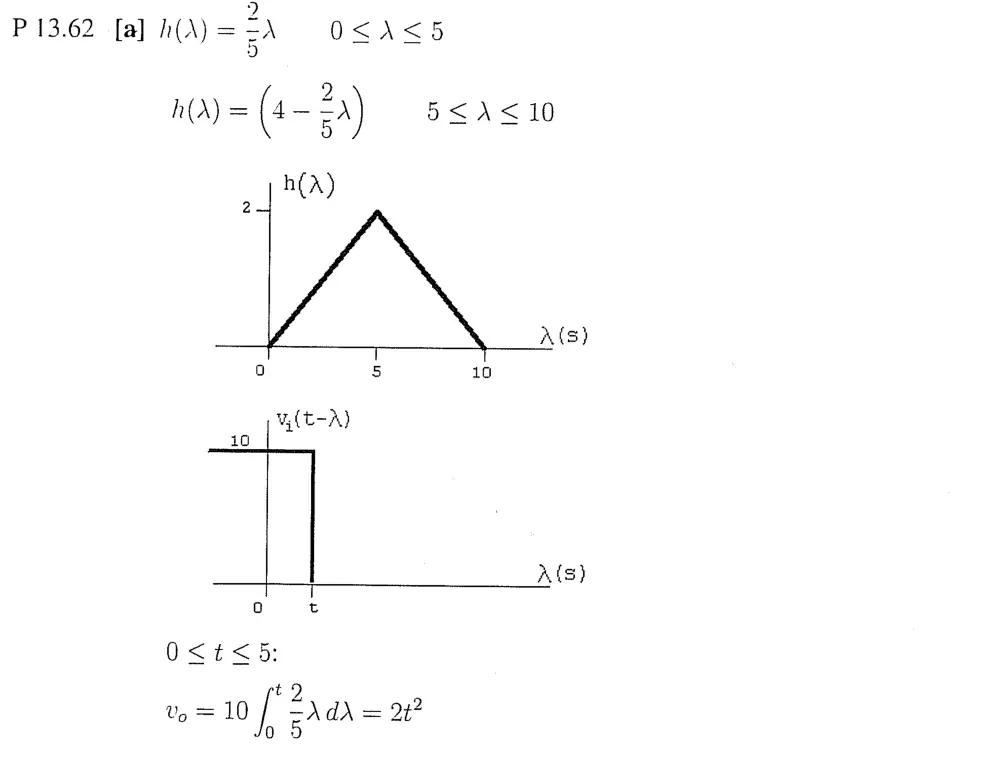
P 13.62 fa] h(\)= =A O<AK<5
5
2
h(A) = (4-5) 5<A< 10
r8)
h(A)
2-4
ACs)
oO 5 10
uy (t-A)
id
As)
oO t
O<t<5:
t2
Up =10 f =A\d\ = 20?
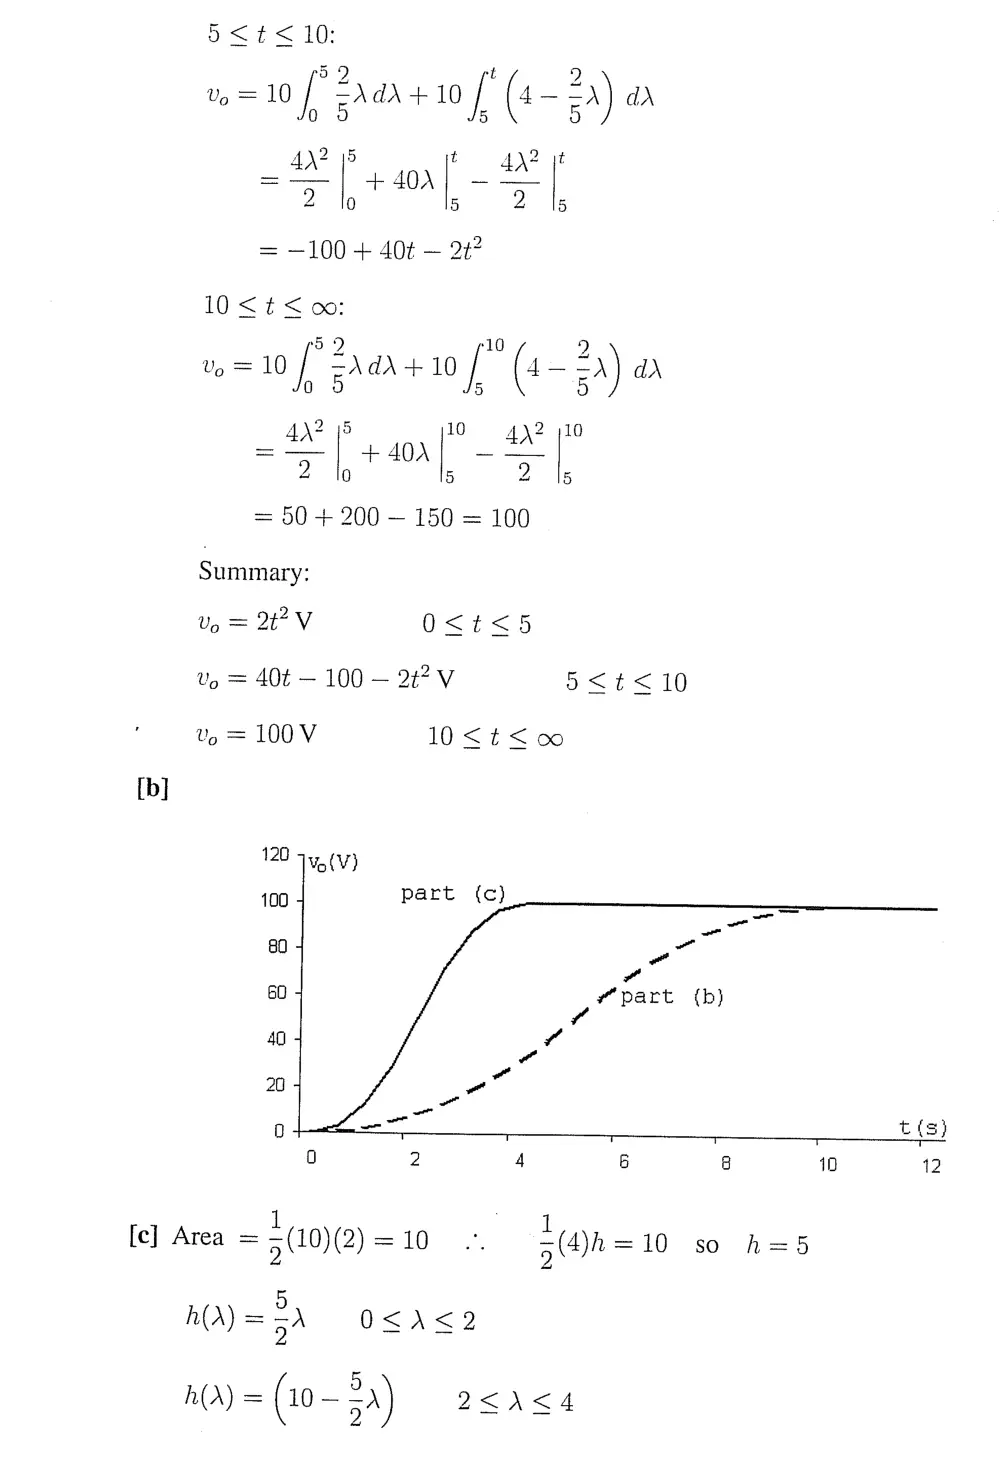
095
5
= —100 + 40¢ — 2%?
10 <t< ow:
5D 10 2
vo =10 | =\d\ +10 (4 - =A) dd
0 5 5 5
5
+ 40A
0
= 50 + 200 — 150 = 100
10 4)?
5
_ 4\?
2
4
bo
Summary:
Up = 2t?V 0<t<5
Up = 40¢ — 100 — 2%? V 5<t<
Up = 100 V 10<t<co
[b]
120 Juecv)
100 - part (c)
ao 4
oa
60 5 Mpart {(b)
40 4 vw
“
rae
20 4
a4 : t(s)
0 2 4 6 10 12
1 1
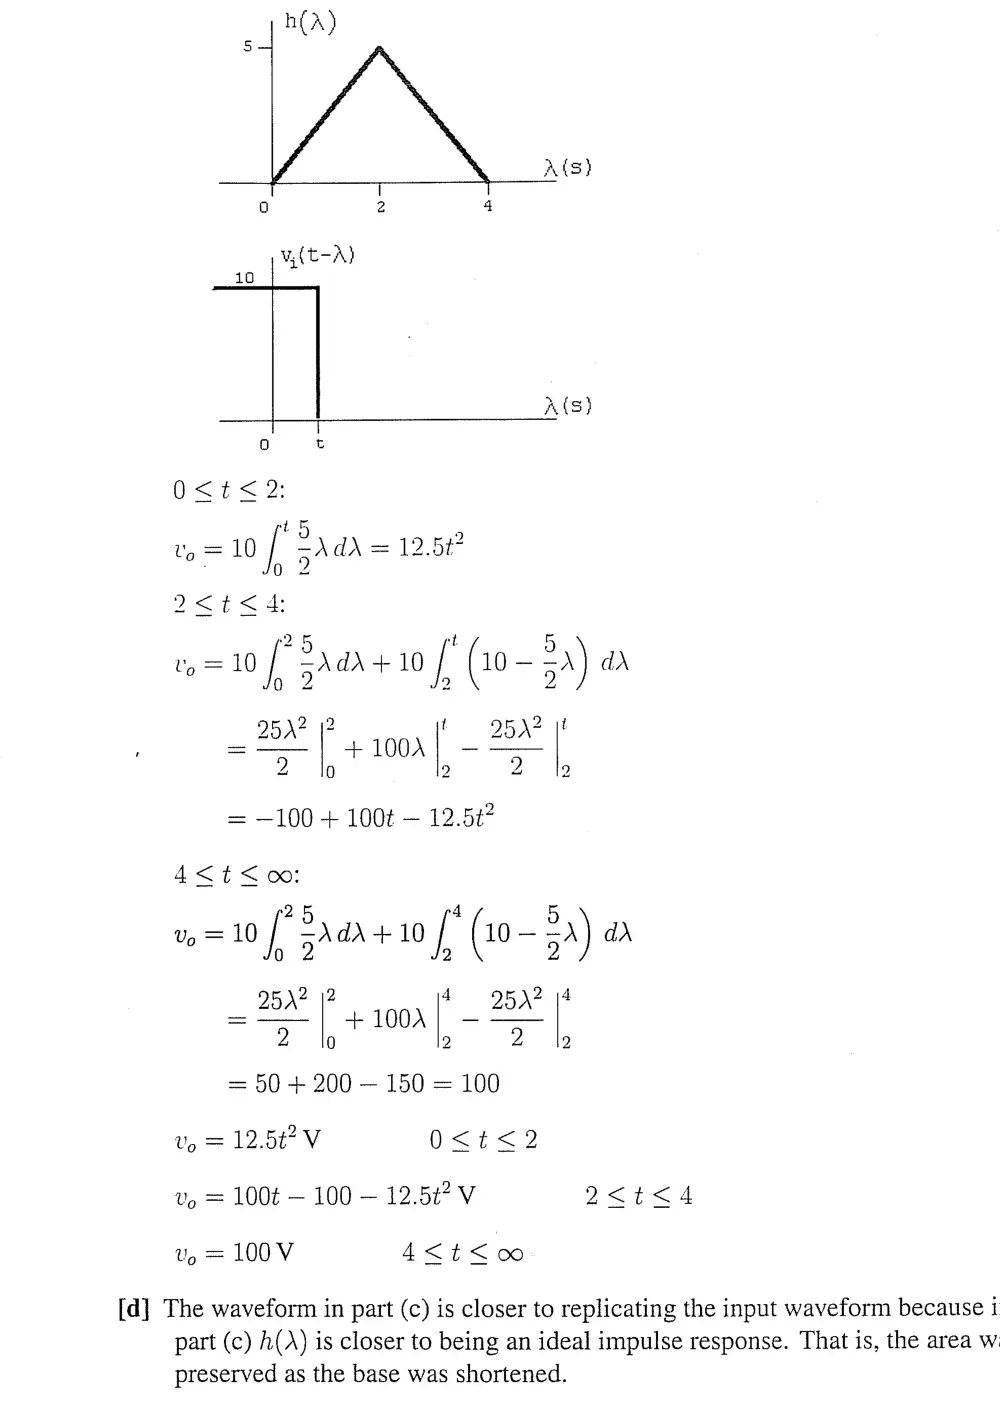
{c] Area = 5 (10) (2) = 10 g (4h =10 h=5
0 2 4
y(t-A)}
10
ACS)
0 6
0<t<2
5 7 5
vo =10 [ S\d\+ 10 [ (10 - 5) dd
25d? |!
wo
= —100 + 100t — 12.5¢?
4<t<o:
25 4 5
vo =10 | sda +10 [ (10- =a) dD
0 2 2 2
2 12 4 R\2 14
_ 254 +1002 _ 25A
2 0 2 2 2
= 50 + 200 — 150 = 100
Up = 12.5t?V 0<t<2
Up = 100¢ — 100 — 12.5%? V 2<t<4
Up = 100 V 4<t<oo
[d] The waveform in part (c) is closer to replicating the input waveform because i
part (c) h(A) is closer to being an ideal impulse response. That is, the area w
preserved as the base was shortened.