
ENHL 232 Project Refrence, Fall 2013
American University of Beirut · Instrumentation, Analytical Techniques, and Sampling · 13 pages




Showing the first 10 of 13 pages. Download the PDF to see all of it.
More ENHL 232 files
Show the text of this project
Method of Standard
Additions (MSA/SA)
Definition
The standard addition technique involves
adding known amounts of standard to one or
more aliquots of the processed sample
solution, compensating for a sample
constituent that enhances or depresses the
analyte signal.
For multi-point, the absorbance of each
solution is determined and then plotted on
the vertical axis of a graph, with the
concentrations of the known standards
plotted on the horizontal axis.
Definition Cont.
When the resulting line is extrapolated to
zero absorbance, the point of interception of
the abscissa is the endogenous
concentration of the analyte in the sample.
The abscissa on the left of the ordinate is
scaled the same as on the right side, but in
the opposite direction from the ordinate.
SW-846 7000B/7010 Section 9.7
SW-846 7000B/7010 Section 9.7
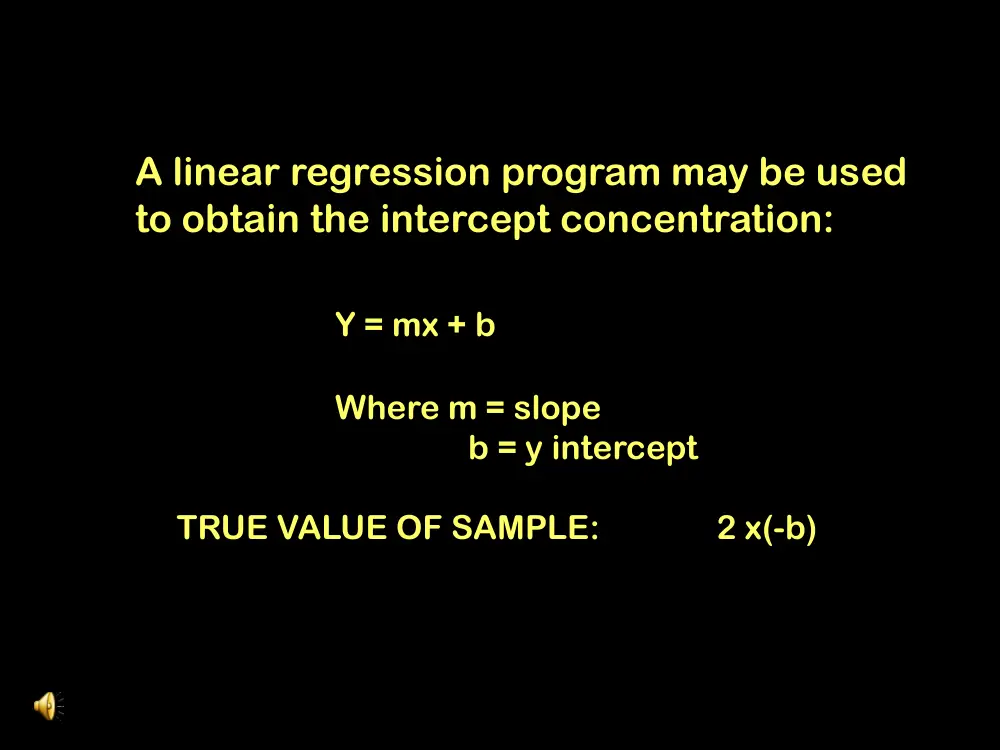
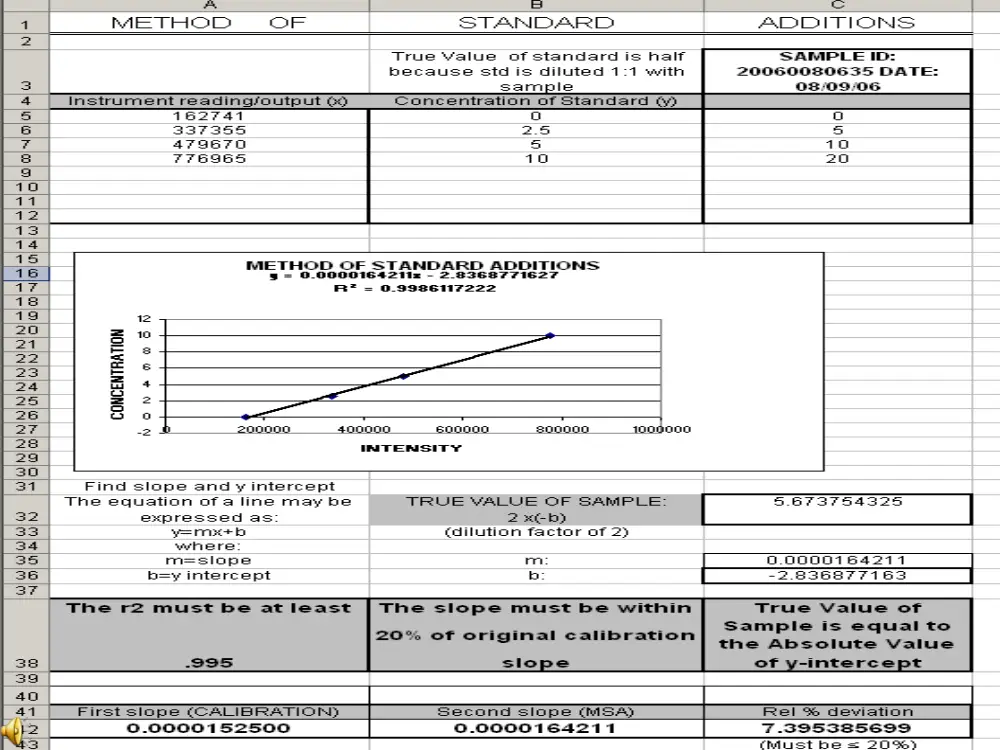
A linear regression program may be used
to obtain the intercept concentration:
Y = mx + b
Where m = slope
b = y intercept
TRUE VALUE OF SAMPLE: 2 x(-b)
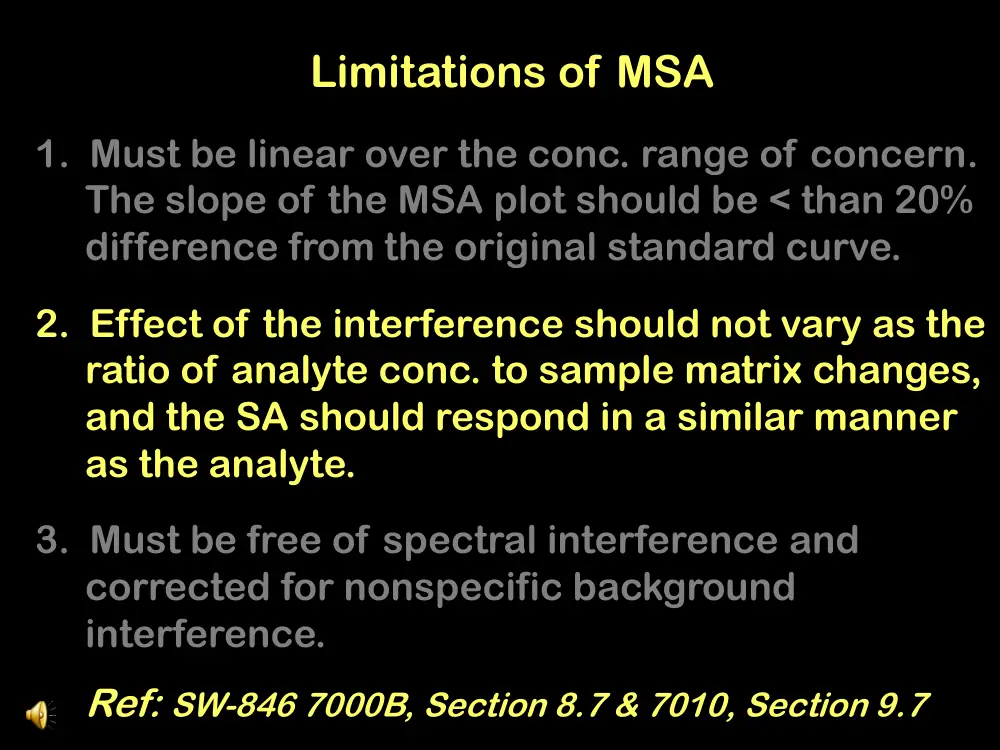
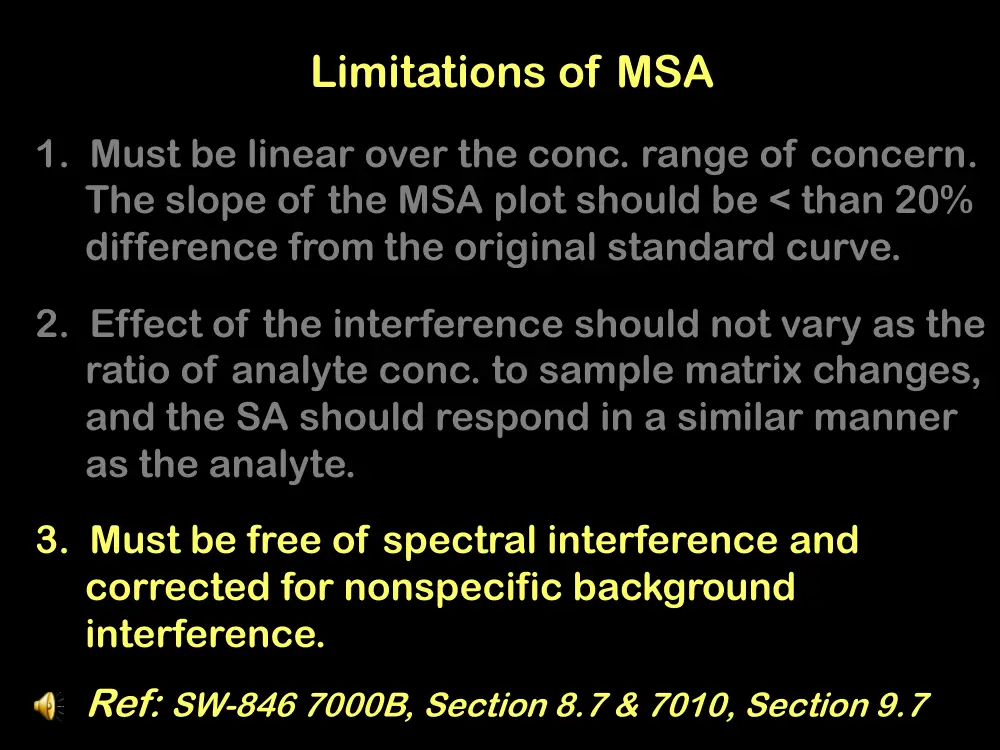
Limitations of MSA
1. Must be linear over the conc. range of concern.
The slope of the MSA plot should be < than 20%
difference from the original standard curve.
2. Effect of the interference should not vary as the
ratio of analyte conc. to sample matrix changes,
and the SA should respond in a similar manner
as the analyte.
3. Must be free of spectral interference and
corrected for nonspecific background
interference.
Ref: SW-846 7000B, Section 8.7 & 7010, Section 9.7
Benefit
When matrix effects appear or are to be expected
and matrix-matched calibration samples are not
available, the standard addition method (SAM)
can be the calibration method of choice.
IUPAC 1998, Pure and Applied Chemistry70,993-1014
Disadvantages
1. Time consuming to perform a full calibration
for one sample.
2. It will not correct for additive interferences
which cause a baseline shift.
3. Inaccuracies in preparing the spiked samples
can seriously affect the slope of the line,
causing errors to be made in the
determining the original concentration.
Ref: Kelley, William D.; Ratliff, Jr., Thomas A.; and
Nenadic, Charles. (1992). Basic Statistics For
Laboratories: A Primer for Laboratory Workers.
Revised