
PHYS 205L Final, Fall 2007
American University of Beirut · Modern Physics for Life Sc. Lab · 7 pages





More PHYS 205L files
Show the text of this final exam
Physics 205L Final exam
January 17, 2008
Name:____________________________
Section number:___________________
Instructor’s Name:__________________
ID number:_________________________
DO NOT START THE EXAM BEFORE YOU ARE TOLD TO BEGIN
Grading
I
II-1
II-2
II-3
TOTAL
The duration of this exam is 60 minutes.
No notes or books allowed.
Scientific calculators are allowed
All results should be given with the exact number of significant figures.
1
I.
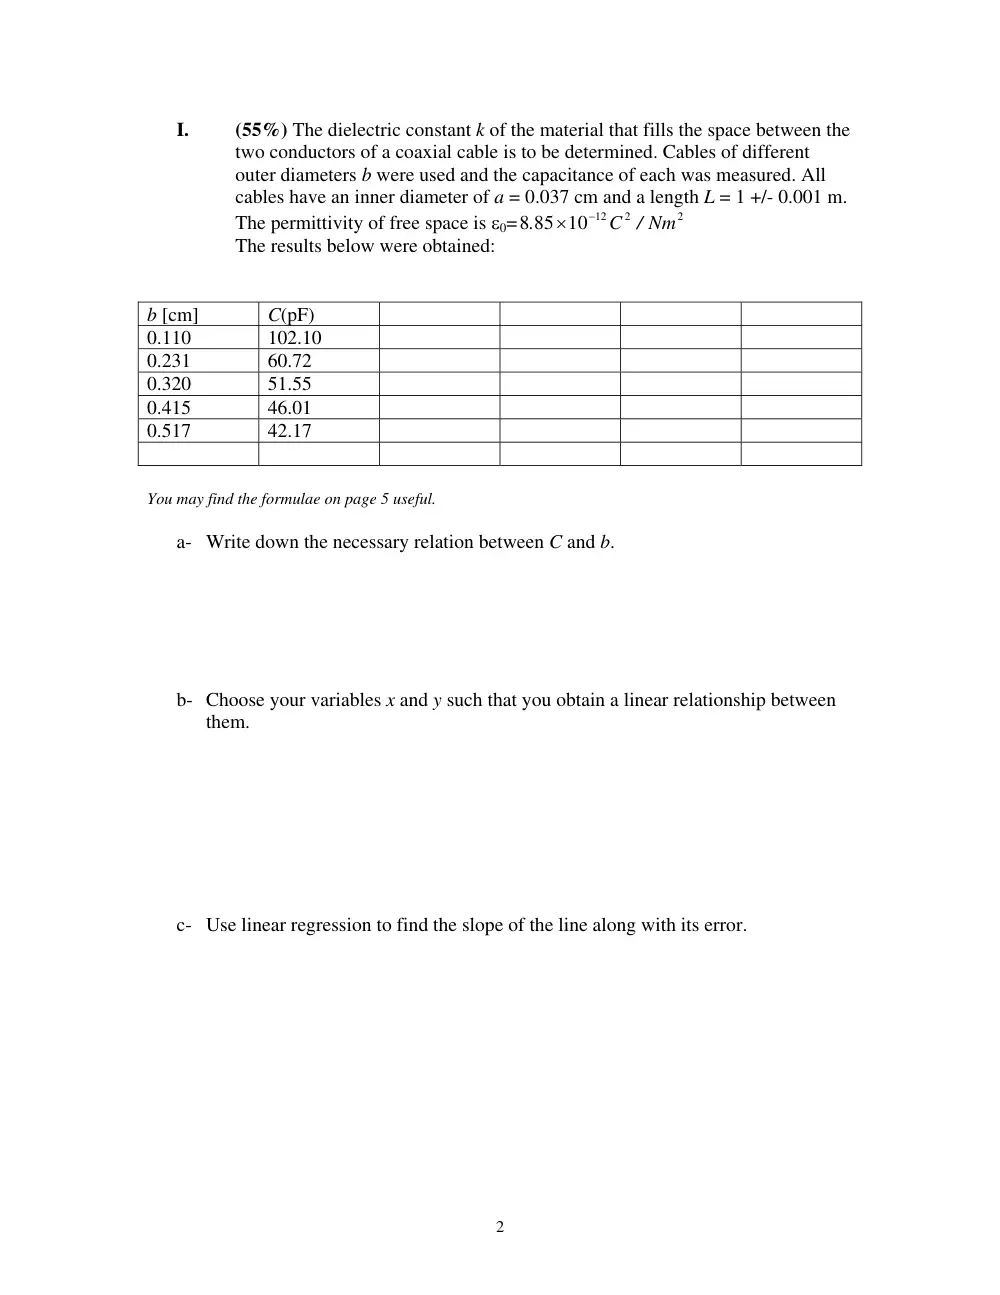
(55%) The dielectric constant k of the material that fills the space between the
two conductors of a coaxial cable is to be determined. Cables of different
outer diameters b were used and the capacitance of each was measured. All
cables have an inner diameter of a = 0.037 cm and a length L = 1 +/- 0.001 m.
The permittivity of free space is ε0=
2
2
8 85 10 12
C / Nm
.
−
×
The results below were obtained:
b [cm]
C(pF)
0.110
102.10
0.231
60.72
0.320
51.55
0.415
46.01
0.517
42.17
You may find the formulae on page 5 useful.
a- Write down the necessary relation between C and b.
b- Choose your variables x and y such that you obtain a linear relationship between
them.
c- Use linear regression to find the slope of the line along with its error.
2
d- Determine the dielectric constant k along with its error.
3
4
Linear Regression
The method of least squares is used to fit a curve (find a theoretical equation) to a set of experimental data.
First assume that a linear relation exists between y and x
y = Ax + B (1)
Substitution of x = xi will in general not give the value of yi. The “errors” will be
ei = y – yi = Axi + B – yi (2)
To determine the best straight line that fits the N, sets of data, A and B have to be chosen so that the sum of
the squares of the “errors” is minimized. This means that the simultaneous equations, obtained by equating
the partial derivatives of (y – yi)2 with respect to A and B to zero, should be solved. This condition leads
then to the following results
Δ
−
= ∑
∑ ∑
i
i
i i
y
x
( x y )
N
A
(3)
and
Δ
−
= ∑ ∑
∑ ∑
)
(
i
i
i
i
i
x y
x
y
x
B
2
(4)
where
2
2
(∑ )
∑
−
Δ =
i
i
x
x
N
(5)
The correlation coefficient r provides an indicator of how good a fit the best straight line is. This
coefficient is defined as
∑
∑
∑
−
−
−
−
=
2
2
)
(
)
(
)
)(
(
y
y
x
x
y
y
x
x
r
i
i
i
i
(6)
For r = 0, the values of x and y are independent of one another and there is no linear correlation. The closer
r is to +1 or to –1, the better the linear correlation is.
Finally, the error in A is given by:
Δ
−
=
∑
2
2
2
i
A
e
N
N
σ
5
II.
Questions
1. In the “Planck’s Constant Experiment” (15%)
a- We used the equation
e
e f
h
VS
− φ
=
( )
in order to determine h andφ .
Explain how.(10%)
b- Define the photoelectric effect. (5%)
2. In the e/m experiment, why did we tilt the Helmholtz coils and kept them
at that orientation throughout the experiment? (10%)
6
7
3. In “Ohm’s Law” experiment, explain how the resistivity of metal rods
were determined. Include necessary equations. (20%)