
PHYS 211L Final, Fall 2007
American University of Beirut · Electricity and Magnetism Laboratory · 7 pages


More PHYS 211L files
- Useful File For Lab Reports and for the Final Exam · Fall 2015Final examView
- Final · Fall 2005Final examView
- Notes Data Analysis Formula Paper · Spring 2017NotesView
- Syllabus · Spring 2016LabView
- Useful File Reading a Vernier Caliper · Spring 2016FileView
- Useful File Physics Lab Emergency Procedures · Spring 2016FileView
- Useful File Reading a Micrometer Caliper · Spring 2016FileView
- Useful File Lab Introduction + Error Analysis · Spring 2016FileView
Show the text of this final exam
Physics 211L Final exam
January 9, 2008
Name:____________________________
Section number:___________________
Instructor’s Name:__________________
ID number:_________________________
DO NOT START THE EXAM BEFORE YOU ARE TOLD TO BEGIN
Grading
I
II-1
II-2
II-3
TOTAL
The duration of this exam is 60 minutes.
No notes or books allowed.
Scientific calculators are allowed
All results should be given with the exact number of significant figures.
_____________________________________________________________________
1
I.
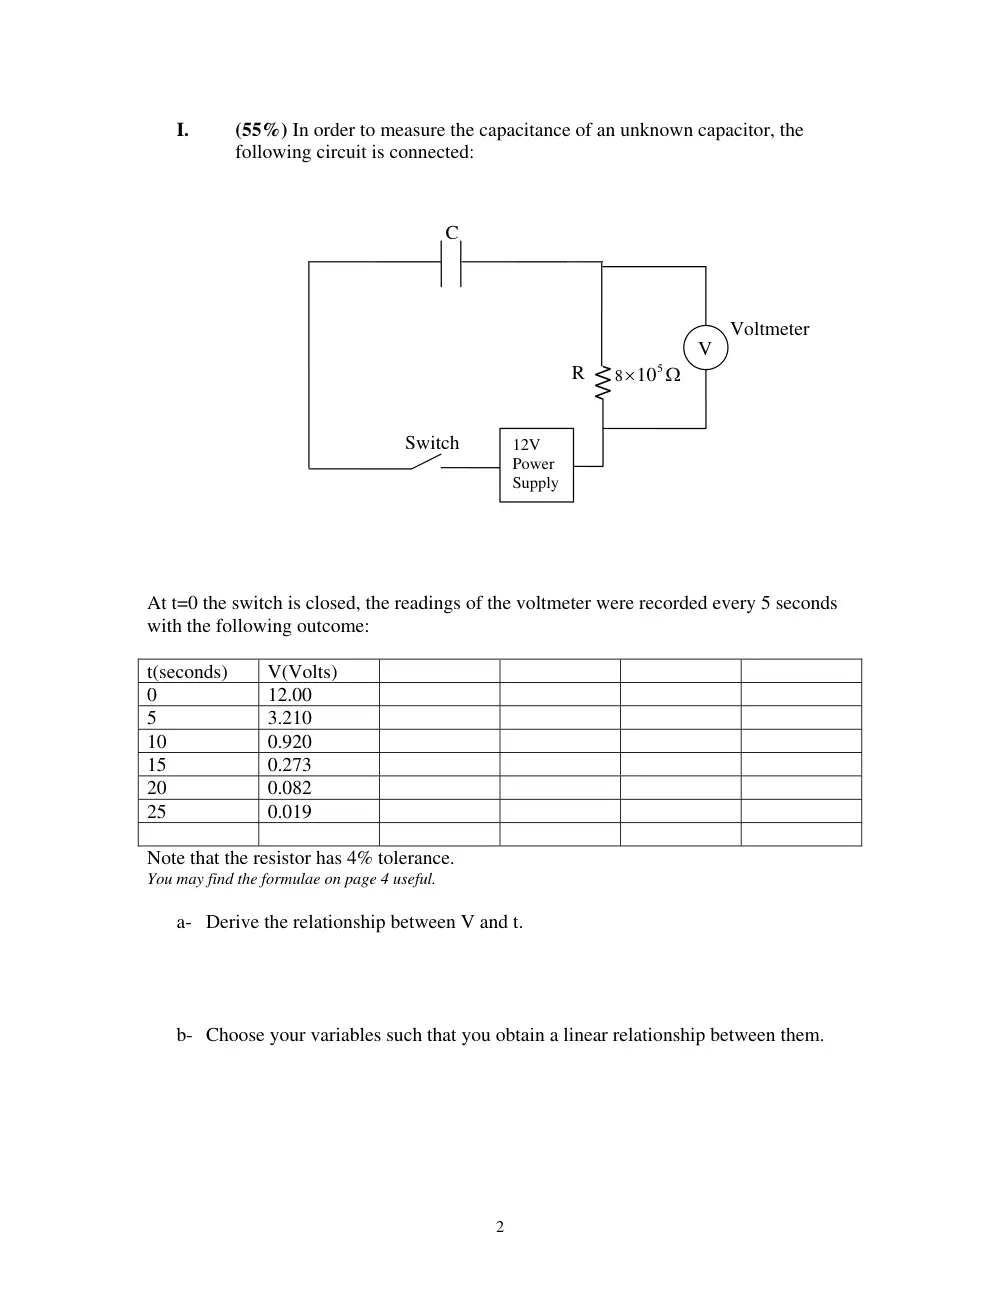
(55%) In order to measure the capacitance of an unknown capacitor, the
following circuit is connected:
At t=0 the switch is closed, the readings of the voltmeter were recorded every 5 seconds
with the following outcome:
t(seconds)
V(Volts)
0
12.00
5
3.210
10
0.920
15
0.273
20
0.082
25
0.019
Note that the resistor has 4% tolerance.
You may find the formulae on page 4 useful.
a- Derive the relationship between V and t.
b- Choose your variables such that you obtain a linear relationship between them.
Switch
C
Voltmeter
R
V
8
Ω
×
105
12V
Power
Supply
2
c- Use linear regression to find the slope of your line along with its error.
d- Determine the capacitance C along with its error.
3
4
Linear Regression
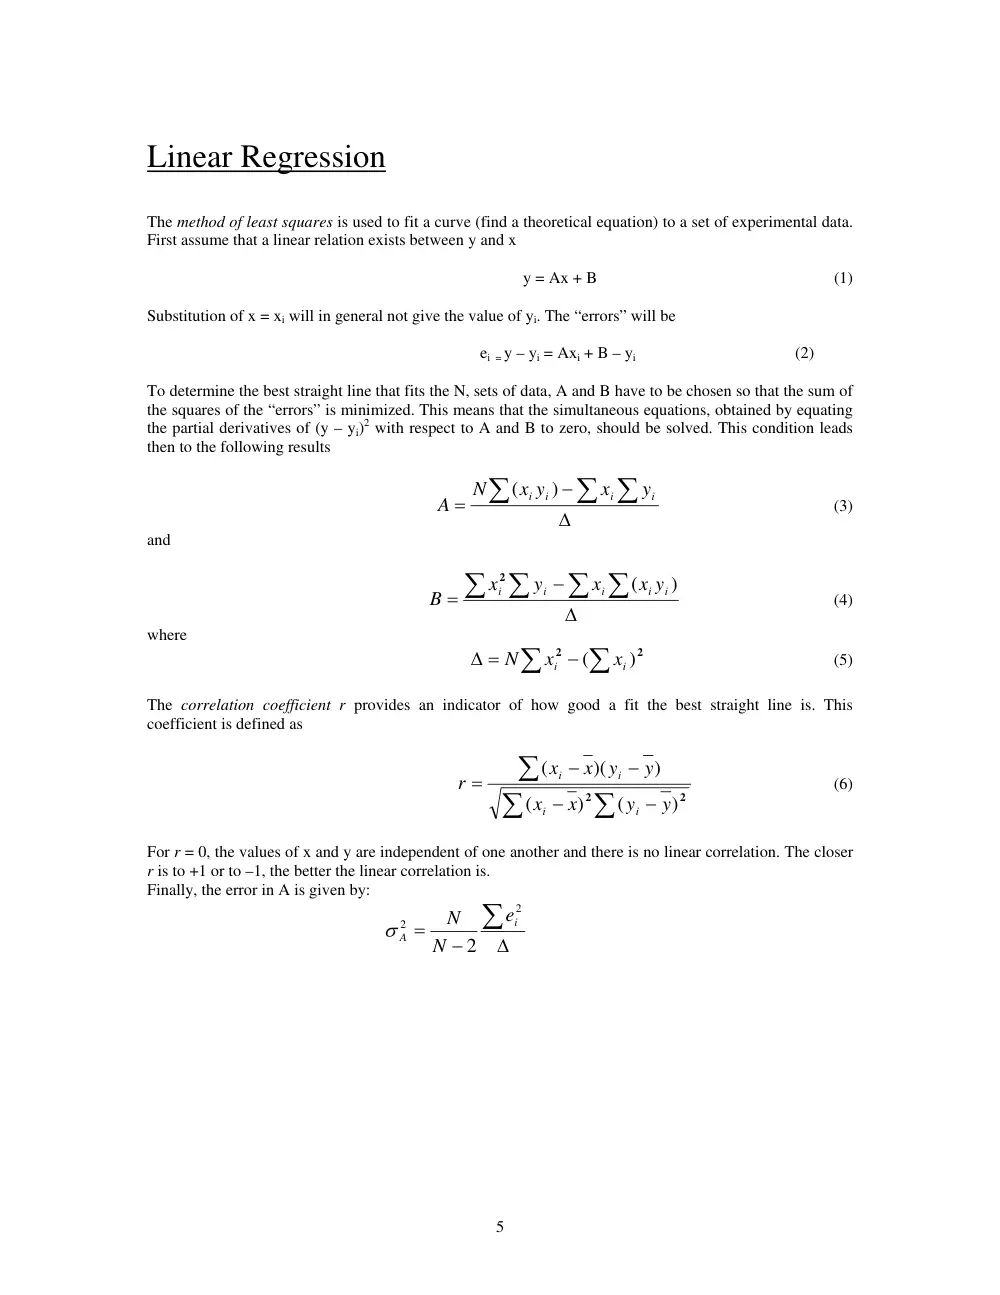
The method of least squares is used to fit a curve (find a theoretical equation) to a set of experimental data.
First assume that a linear relation exists between y and x
y = Ax + B (1)
Substitution of x = xi will in general not give the value of yi. The “errors” will be
ei = y – yi = Axi + B – yi (2)
To determine the best straight line that fits the N, sets of data, A and B have to be chosen so that the sum of
the squares of the “errors” is minimized. This means that the simultaneous equations, obtained by equating
the partial derivatives of (y – yi)2 with respect to A and B to zero, should be solved. This condition leads
then to the following results
Δ
−
= ∑
∑ ∑
i
i
i i
y
x
x y
N
A
)
(
(3)
and
Δ
−
= ∑ ∑
∑ ∑
)
(
i
i
i
i
i
x y
x
y
x
B
2
(4)
where
2
2
(∑ )
∑
−
Δ =
i
i
x
x
N
(5)
The correlation coefficient r provides an indicator of how good a fit the best straight line is. This
coefficient is defined as
∑
∑
∑
−
−
−
−
=
2
2
)
(
)
(
)
)(
(
y
y
x
x
y
y
x
x
r
i
i
i
i
(6)
For r = 0, the values of x and y are independent of one another and there is no linear correlation. The closer
r is to +1 or to –1, the better the linear correlation is.
Finally, the error in A is given by:
Δ
−
=
∑
2
2
2
i
A
e
N
N
σ
5
II.
Questions
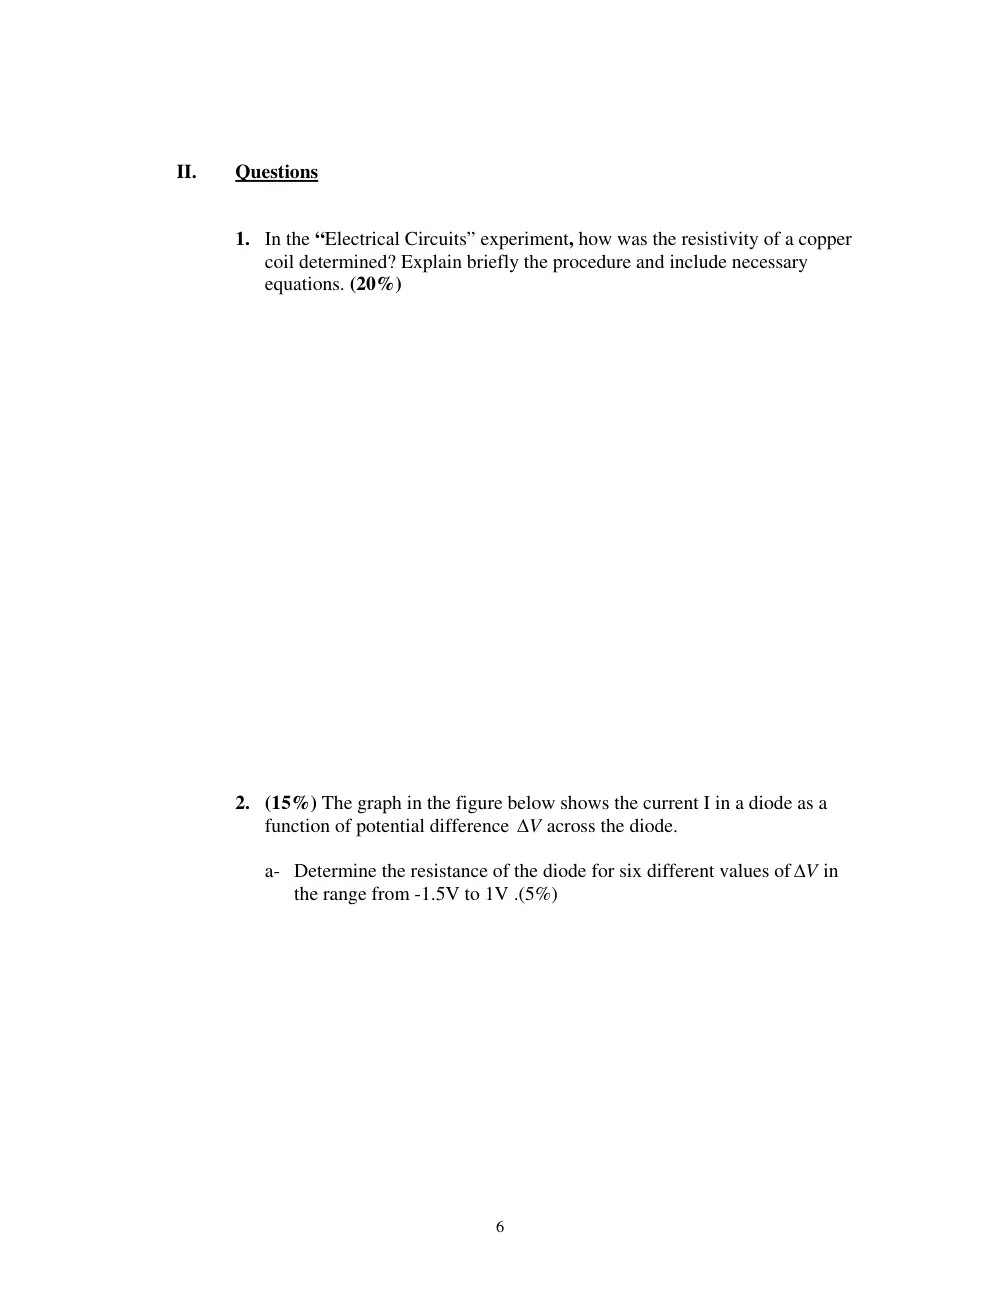
1. In the “Electrical Circuits” experiment, how was the resistivity of a copper
coil determined? Explain briefly the procedure and include necessary
equations. (20%)
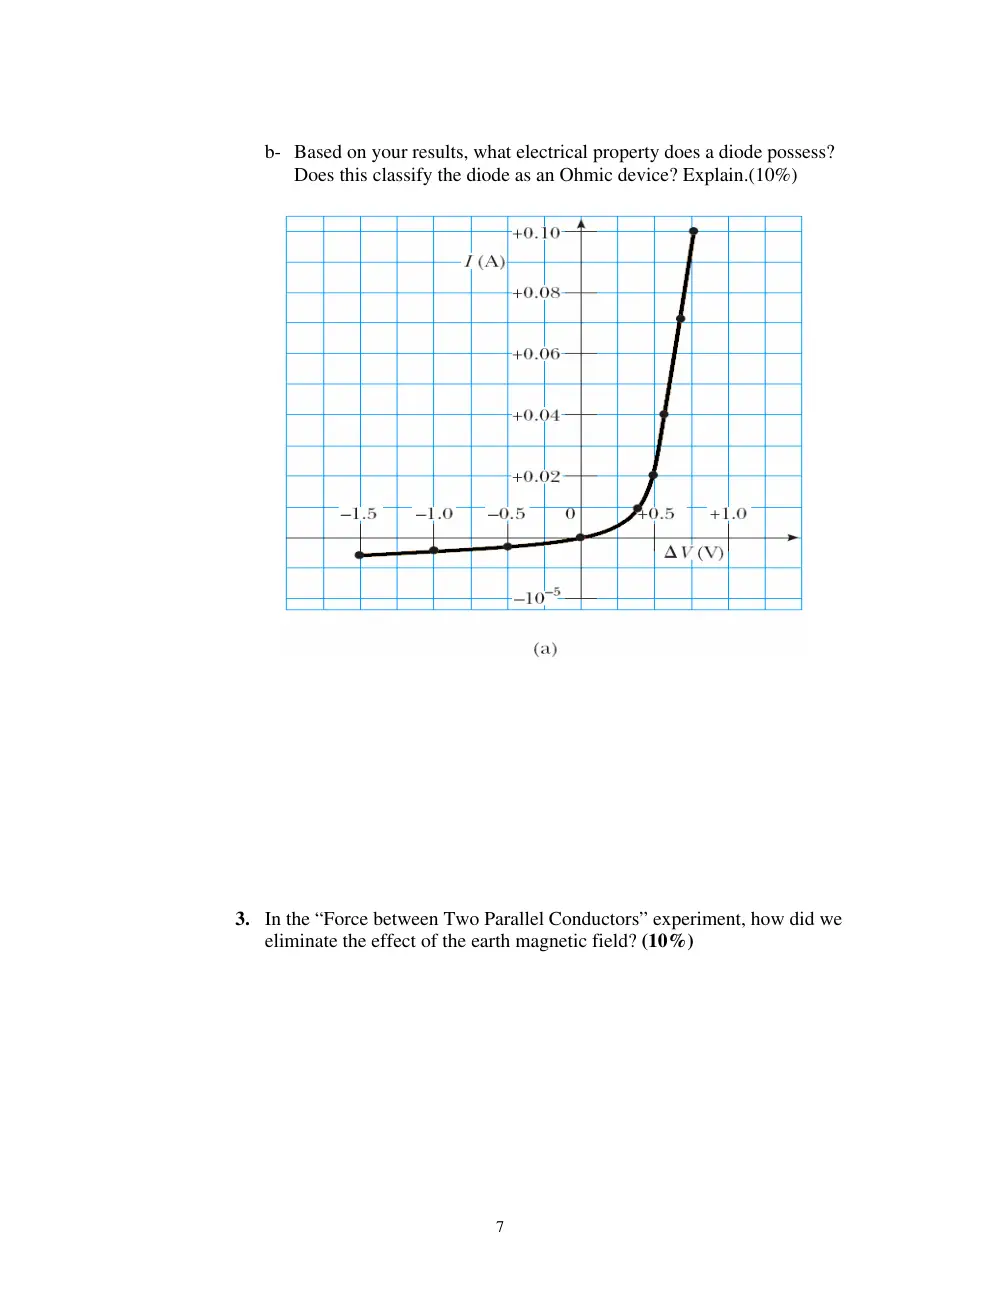
2. (15%) The graph in the figure below shows the current I in a diode as a
function of potential difference V
Δ
across the diode.
a- Determine the resistance of the diode for six different values of V
Δ
in
the range from -1.5V to 1V .(5%)
6
b- Based on your results, what electrical property does a diode possess?
Does this classify the diode as an Ohmic device? Explain.(10%)
3. In the “Force between Two Parallel Conductors” experiment, how did we
eliminate the effect of the earth magnetic field? (10%)
7