
PHYS 211L Lab Report, Spring 2008
American University of Beirut · Electricity and Magnetism Laboratory · 5 pages
More PHYS 211L files
Show the text of this lab
PHYSICS 211L
Exp. 1: Basic Oscilloscope Operations
Date: _08/03/2007_
NAME: _
PARTNER’S NAME:_
SECTION NUMBER & NAME OF INSTRUCTOR: _-1- MS. SARA
NAJM
_
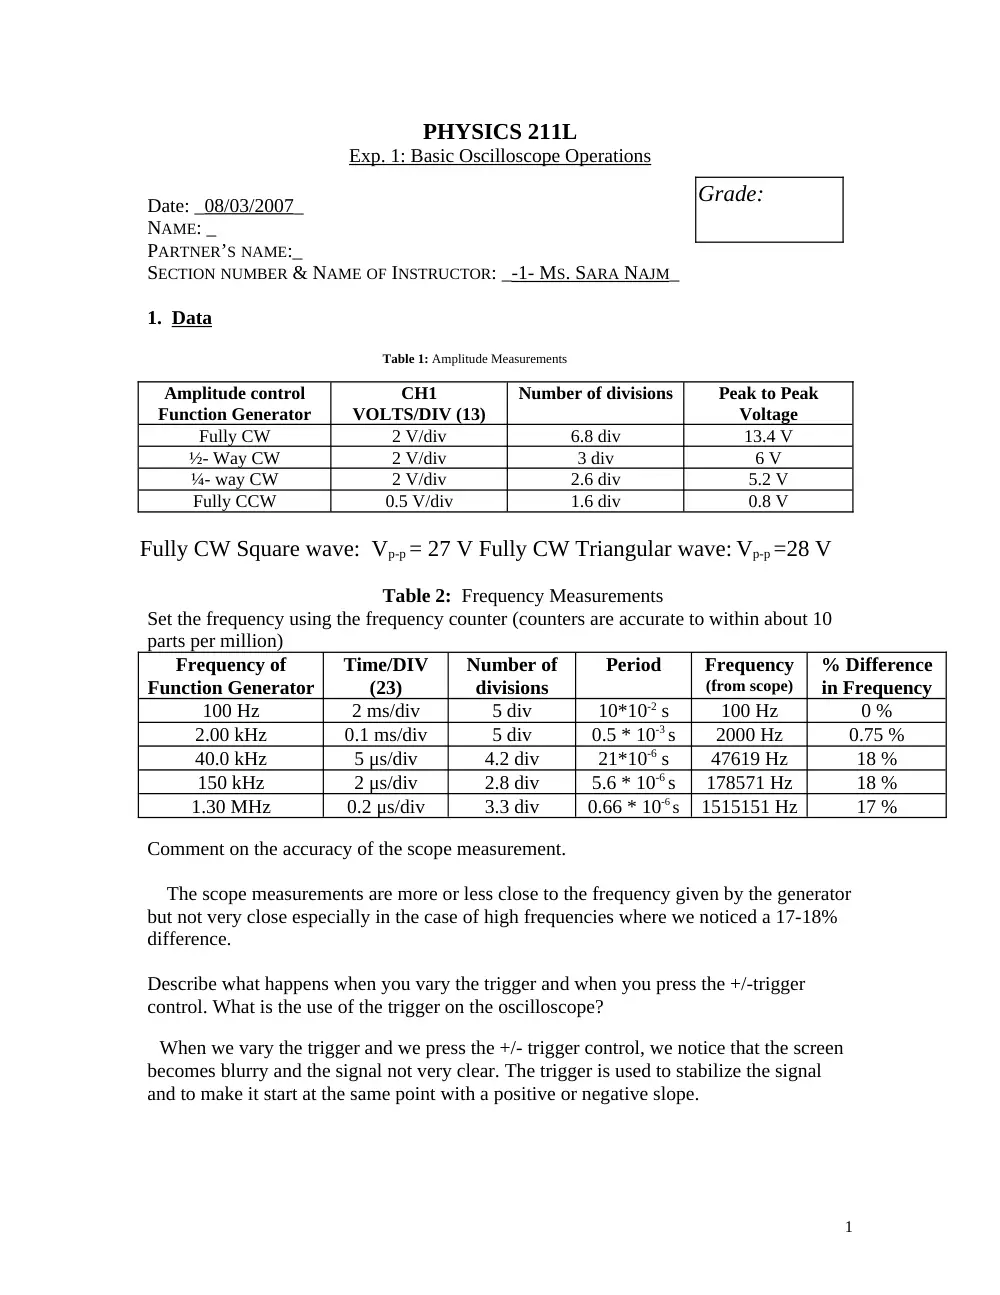
1. Data
Table 1: Amplitude Measurements
Amplitude control
Function Generator
CH1
VOLTS/DIV (13)
Number of divisions
Peak to Peak
Voltage
Fully CW
2 V/div
6.8 div
13.4 V
½- Way CW
2 V/div
3 div
6 V
¼- way CW
2 V/div
2.6 div
5.2 V
Fully CCW
0.5 V/div
1.6 div
0.8 V
Fully CW Square wave: Vp-p = 27 V Fully CW Triangular wave: Vp-p =28 V
Table 2: Frequency Measurements
Set the frequency using the frequency counter (counters are accurate to within about 10
parts per million)
Frequency of
Function Generator
Time/DIV
(23)
Number of
divisions
Period
Frequency
(from scope)
% Difference
in Frequency
100 Hz
2 ms/div
5 div
10*10-2 s
100 Hz
0 %
2.00 kHz
0.1 ms/div
5 div
0.5 * 10-3 s
2000 Hz
0.75 %
40.0 kHz
5 μs/div
4.2 div
21*10-6 s
47619 Hz
18 %
150 kHz
2 μs/div
2.8 div
5.6 * 10-6 s
178571 Hz
18 %
1.30 MHz
0.2 μs/div
3.3 div
0.66 * 10-6 s
1515151 Hz
17 %
Comment on the accuracy of the scope measurement.
The scope measurements are more or less close to the frequency given by the generator
but not very close especially in the case of high frequencies where we noticed a 17-18%
difference.
Describe what happens when you vary the trigger and when you press the +/-trigger
control. What is the use of the trigger on the oscilloscope?
When we vary the trigger and we press the +/- trigger control, we notice that the screen
becomes blurry and the signal not very clear. The trigger is used to stabilize the signal
and to make it start at the same point with a positive or negative slope.
Grade:
1
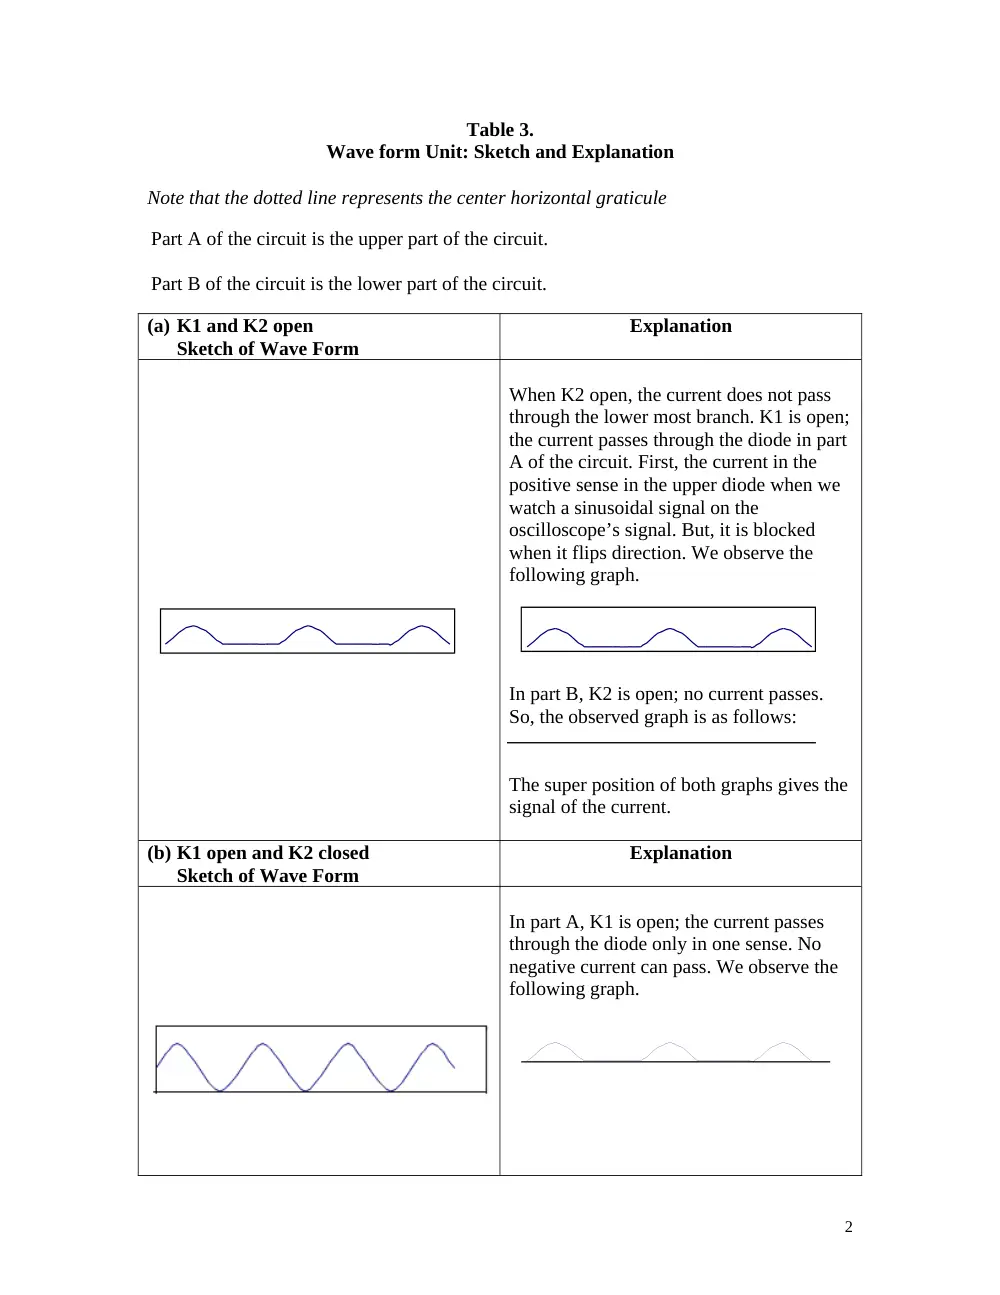
Table 3.
Wave form Unit: Sketch and Explanation
Note that the dotted line represents the center horizontal graticule
(a) K1 and K2 open
Sketch of Wave Form
Explanation
When K2 open, the current does not pass
through the lower most branch. K1 is open;
the current passes through the diode in part
A of the circuit. First, the current in the
positive sense in the upper diode when we
watch a sinusoidal signal on the
oscilloscope’s signal. But, it is blocked
when it flips direction. We observe the
following graph.
In part B, K2 is open; no current passes.
So, the observed graph is as follows:
The super position of both graphs gives the
signal of the current.
(b) K1 open and K2 closed
Sketch of Wave Form
Explanation
In part A, K1 is open; the current passes
through the diode only in one sense. No
negative current can pass. We observe the
following graph.
2
Part A of the circuit is the upper part of the circuit.
Part B of the circuit is the lower part of the circuit.
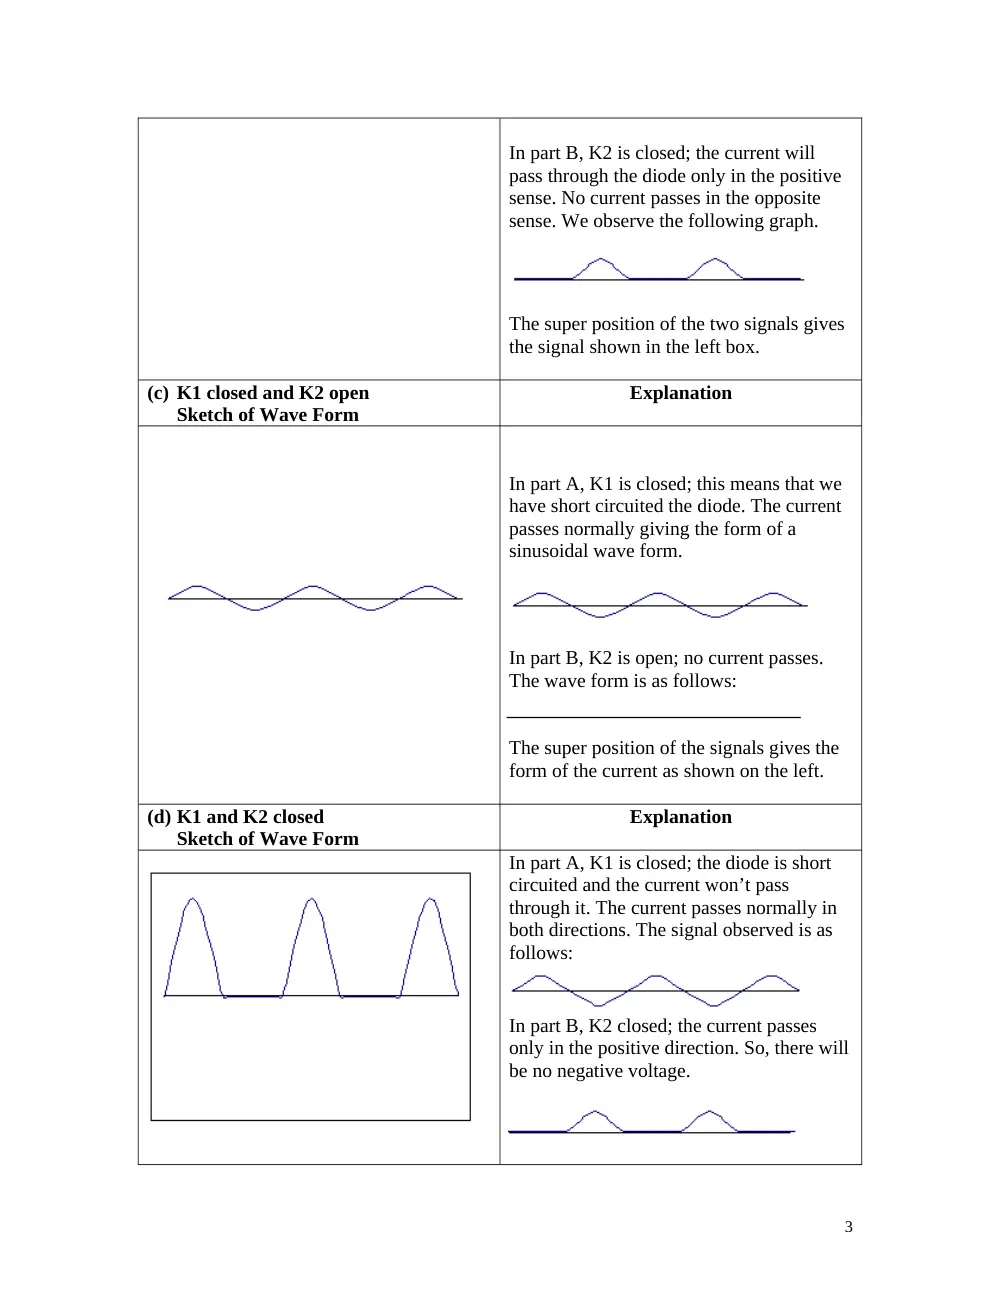
In part B, K2 is closed; the current will
pass through the diode only in the positive
sense. No current passes in the opposite
sense. We observe the following graph.
The super position of the two signals gives
the signal shown in the left box.
(c) K1 closed and K2 open
Sketch of Wave Form
Explanation
In part A, K1 is closed; this means that we
have short circuited the diode. The current
passes normally giving the form of a
sinusoidal wave form.
In part B, K2 is open; no current passes.
The wave form is as follows:
The super position of the signals gives the
form of the current as shown on the left.
(d) K1 and K2 closed
Sketch of Wave Form
Explanation
In part A, K1 is closed; the diode is short
circuited and the current won’t pass
through it. The current passes normally in
both directions. The signal observed is as
follows:
In part B, K2 closed; the current passes
only in the positive direction. So, there will
be no negative voltage.
3
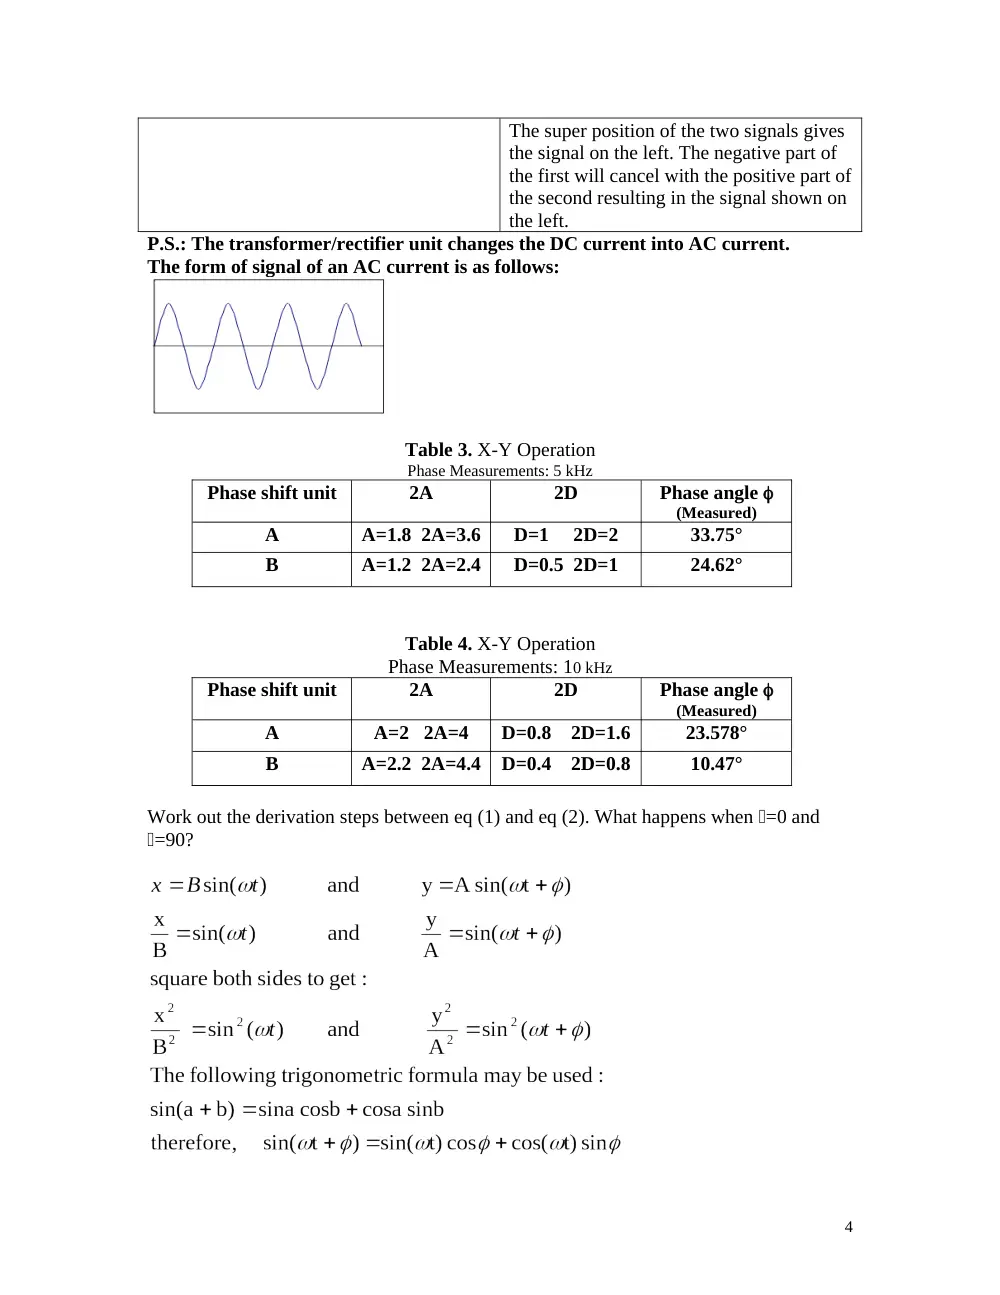
The super position of the two signals gives
the signal on the left. The negative part of
the first will cancel with the positive part of
the second resulting in the signal shown on
the left.
P.S.: The transformer/rectifier unit changes the DC current into AC current.
The form of signal of an AC current is as follows:
Table 3. X-Y Operation
Phase Measurements: 5 kHz
Phase shift unit
2A
2D
Phase angle
(Measured)
A
A=1.8 2A=3.6
D=1 2D=2
33.75°
B
A=1.2 2A=2.4
D=0.5 2D=1
24.62°
Table 4. X-Y Operation
Phase Measurements: 10 kHz
Phase shift unit
2A
2D
Phase angle
(Measured)
A
A=2 2A=4
D=0.8 2D=1.6
23.578°
B
A=2.2 2A=4.4
D=0.4 2D=0.8
10.47°
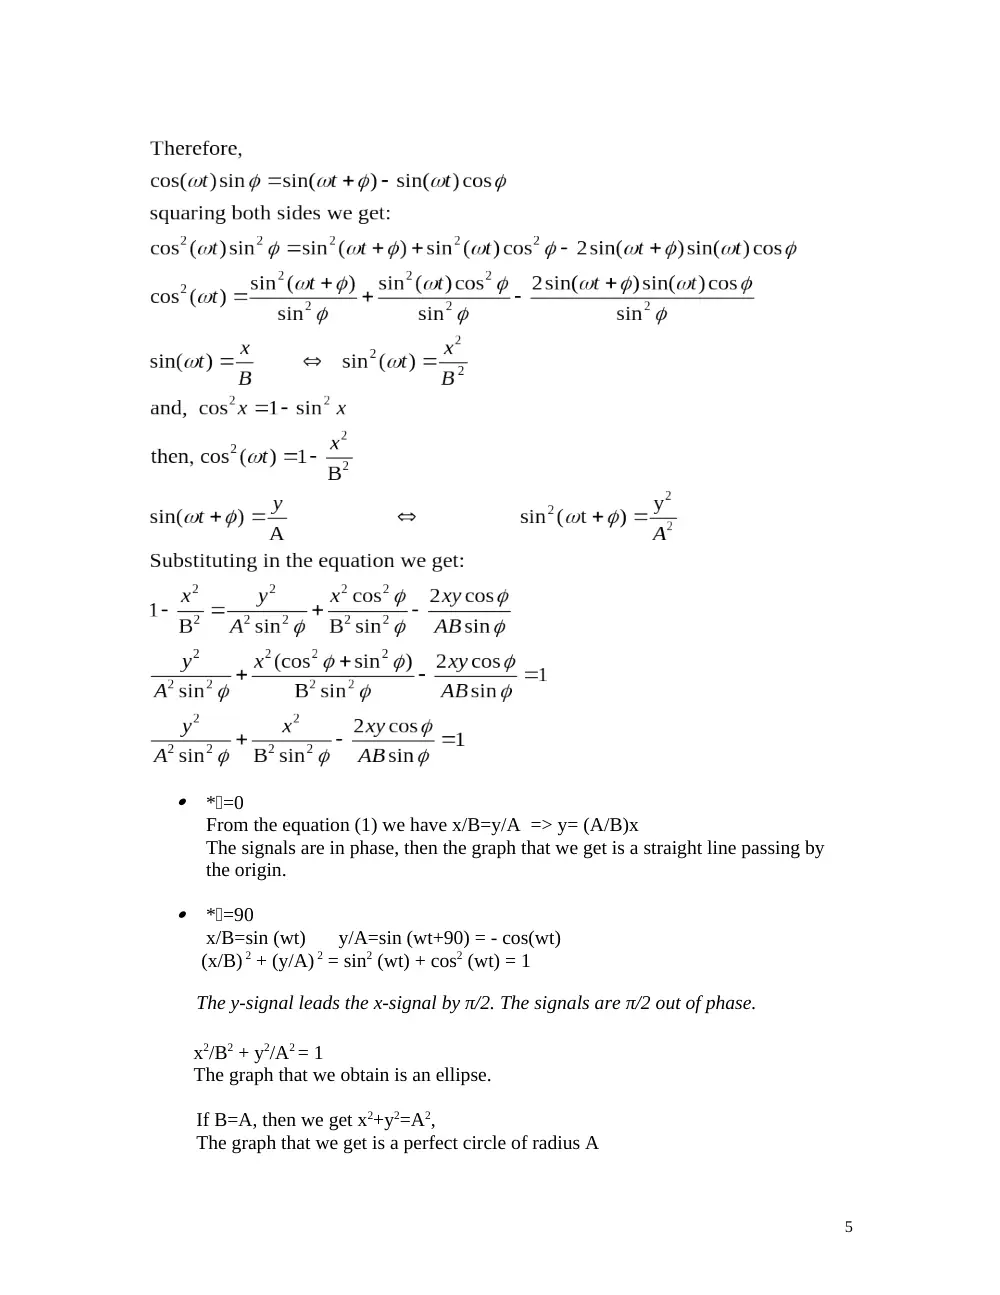
Work out the derivation steps between eq (1) and eq (2). What happens when =0 and
=90?
4
*=0
From the equation (1) we have x/B=y/A => y= (A/B)x
The signals are in phase, then the graph that we get is a straight line passing by
the origin.
*=90
x/B=sin (wt)
y/A=sin (wt+90) = - cos(wt)
(x/B) 2 + (y/A) 2 = sin2 (wt) + cos2 (wt) = 1
The y-signal leads the x-signal by π/2. The signals are π/2 out of phase.
x2/B2 + y2/A2 = 1
The graph that we obtain is an ellipse.
If B=A, then we get x2+y2=A2,
The graph that we get is a perfect circle of radius A
5