
PSPA 203 Final, Fall 2005
American University of Beirut · Research Methodology · 5 pages




More PSPA 203 files
Show the text of this final exam
AMERICAN UNIVERSITY OF Beirut
PSPA 203
Fall Term 2005-2006
Final Exam
Date: January 24, 2006
Duration: Two Hours
The exam consists of two parts; multiple choice and essays. The multiple choice
part is composed of 20 questions and accounts for 40 per cent of the exam score. The
essays part is composed of five questions and accounts for 60 percent of the exam score.
Multiple Choices (circle the correct answer)
1- A Census is a:
a- panel study
b- longitudinal study
c- cross-sectional study
d- trend study
e- time-series study
2- A key problem of secondary analysis is:
a- costs
b- validity
c- sample selection
d- data collection strategies
3- Instead of the standardized unit of analysis in quantitative analysis,
qualitative analysis uses which one of the following as the organizing
principle for coding?
a- the concept
b- the variable
c- the sorting memo
d- concept mapping
e- semiotics
4- 4- Before doing qualitative data analysis, an important first step is to
name and categorize phenomena through close examination of the
data. This process is known as:
a- theoretical notes
b- open coding
c- concept mapping
d- memoing
5- The major purpose of descriptive statistics is:
a- establishing generalizability
b- data reduction
c- determining measure of association
d- summarizing associations among variables
6- Descriptive analysis are most of ten accomplished with which type
of statistical analysis?
a- bivariate
b- univariate
c- dispersion
d- multivariate
7- The regression line drawn through a scattergram plotting cases
on two variables is:
a- usually not a straight line
b- drawn closest to the extreme values
c- drawn as to minimize the deviations between each case
and the line.
d- drawn from left to right and from right to left
8- Which of the following is an example of the null hypothesis?
a- there is no difference between males and females on voting
b- there is a difference between males and females on voting
c- males tend to vote more often than females
9- Grounded theory begins with:
a- patterns
b- hypothesis
c- key variable
d- data collection
10- Which of the following levels of measurements may be employed
in content analysis?
a- nominal
b- ordinal
c- interval
d- ratio
e- all of the above
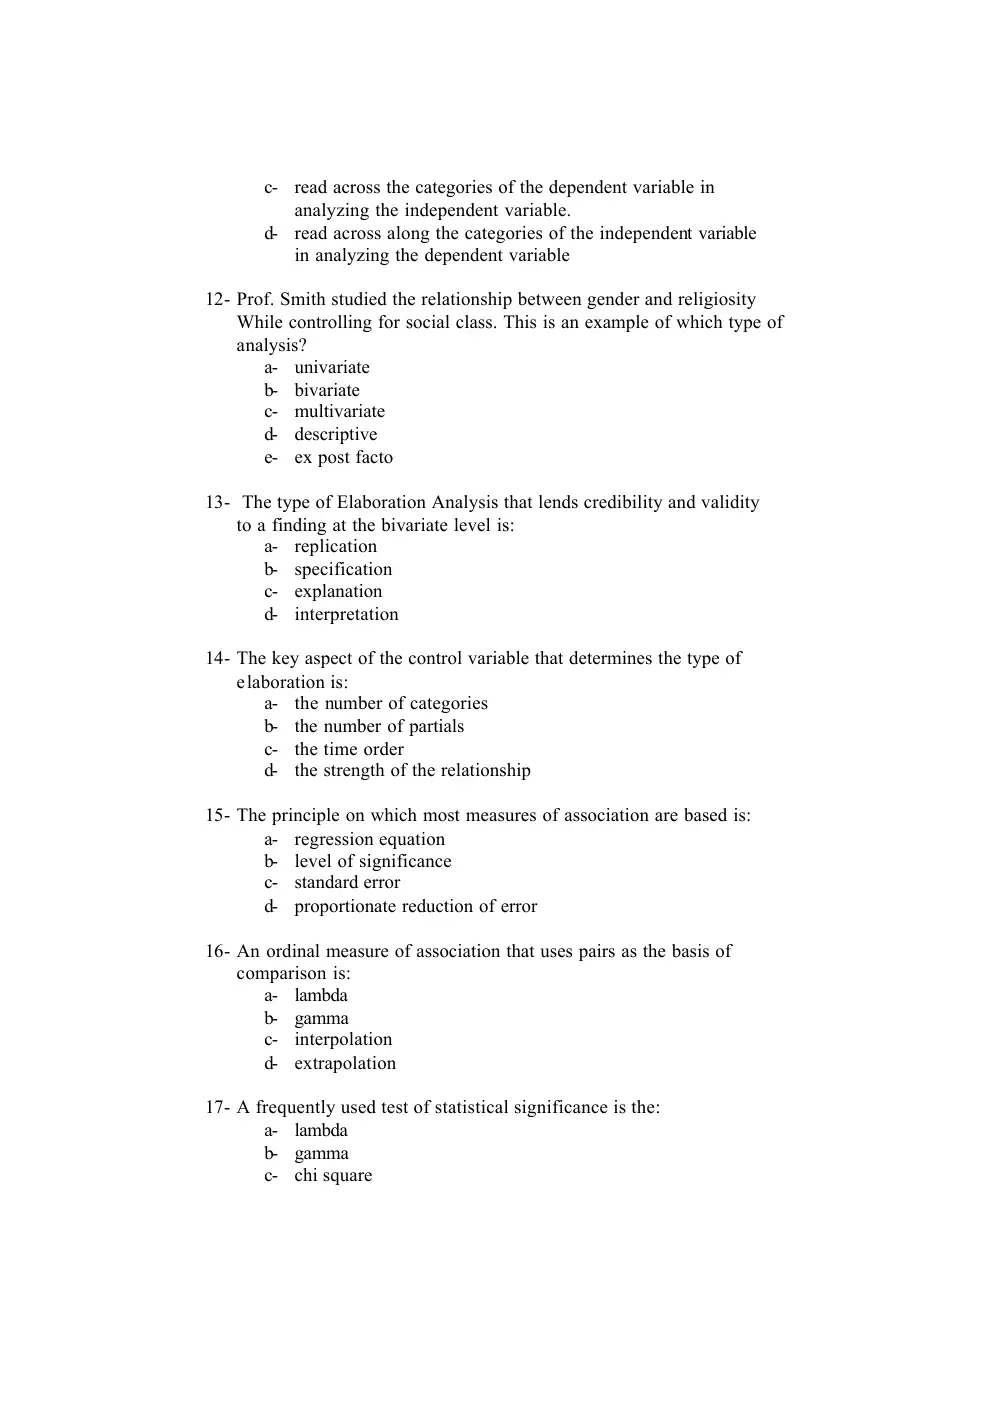
11- The fundamental rule in reading tables is to:
a- percentage down
b- percentage across
c- read across the categories of the dependent variable in
analyzing the independent variable.
d- read across along the categories of the independent variable
in analyzing the dependent variable
12- Prof. Smith studied the relationship between gender and religiosity
While controlling for social class. This is an example of which type of
analysis?
a- univariate
b- bivariate
c- multivariate
d- descriptive
e- ex post facto
13- The type of Elaboration Analysis that lends credibility and validity
to a finding at the bivariate level is:
a- replication
b- specification
c- explanation
d- interpretation
14- The key aspect of the control variable that determines the type of
elaboration is:
a- the number of categories
b- the number of partials
c- the time order
d- the strength of the relationship
15- The principle on which most measures of association are based is:
a- regression equation
b- level of significance
c- standard error
d- proportionate reduction of error
16- An ordinal measure of association that uses pairs as the basis of
comparison is:
a- lambda
b- gamma
c- interpolation
d- extrapolation
17- A frequently used test of statistical significance is the:
a- lambda
b- gamma
c- chi square
18- Lambda is a measure appropriate for the analysis of:
a- two ordinal variables
b- two nominal variables
c- two interval or ratio variables
19- A test of significance that compares observed with expected
frequencies is:
a-
r
b- Raw-data matrix
c- Chi square
d- Confidence interval
20- Types of Regression Analysis include:
a- path analysis
b- factor analysis
c- linear analysis
d- time-series analysis
Essay Questions
Answer the first question and any two of the remaining four.
1- Subgroup comparisons yield a descriptive analysis of two variables by presenting
data for each of the several groups. Two problems face researchers when they try
to analyze this data. How to handle a dispersed data and
Below are two tables, 14-7 and 14-8, that are related to the first problem and a
third one, 14-9, related to the second problem. How do you read and interpret
these tables? Show in your analysis the usefulness of collapsing categories and
summarizing the results as discussed in the textbook.
Table 14-7
Attitudes toward the United Nations
oing solving the problems it has
-----------------------------------------------------------------------------
Germany Britain France Japan USA
Very good job 2% 7% 2% 1% 5%
Good job 46 39 45 11 46
Poor job 21 28 22 43 27
Very poor job 6 9 3 5 13
26 17 28 41 10
----------------------------------------------------------------------------------------------
Table 14-8
Collapsing extreme categories
---------------------------------------------------------------------------------------------------------
Germany Britain France Japan USA
Good job or better 48% 46% 47% 12% 51%
Poor job or worst 27 37 25 48 40
-------------------------------------------------------------------------------------------------
Table 14 -9
---------------------------------------------------------------------------------------------------
Germany Britain France Japan USA
Good job or better 65% 55% 65% 20% 57%
Poor job or worst 35% 45% 35% 80% 43%
-----------------------------------------------------------------------------------------------------------------
2- In your own words, explain the meaning and purpose of regression analysis and
its several forms. Be specific.
3- Define and give examples of the following terms: univariate analysis, bivariate
analysis, multivariate analysis, frequency distribution and central tendency.
4- Suppose you were asked by your Prof. to do a survey of the student body. The
Prof. believes it is sufficient to stop the students on their way to the library and
hand out the questionnaire. You argue for a probability sample. State your
argument and give at least two reasons why probability sampling might be
preferred. Be sure to incorporate in your analysis the text and class discussion on
the logic of probability sampling.
5- Describe the elaboration logic of: (1) replication, (2) interpretation, (3)
explanation, and (4) specification, and give examples.