
QBA 301 Project Case Study, Fall 2013
Lebanese American University · Intermediate Business · 2 pages
More QBA 301 files
Show the text of this project
NAME:
,
Case Study, In-Class Exercise
Please submit this sheet to Dr. Kassar at the end of the Lab Session.
1
The Case Study
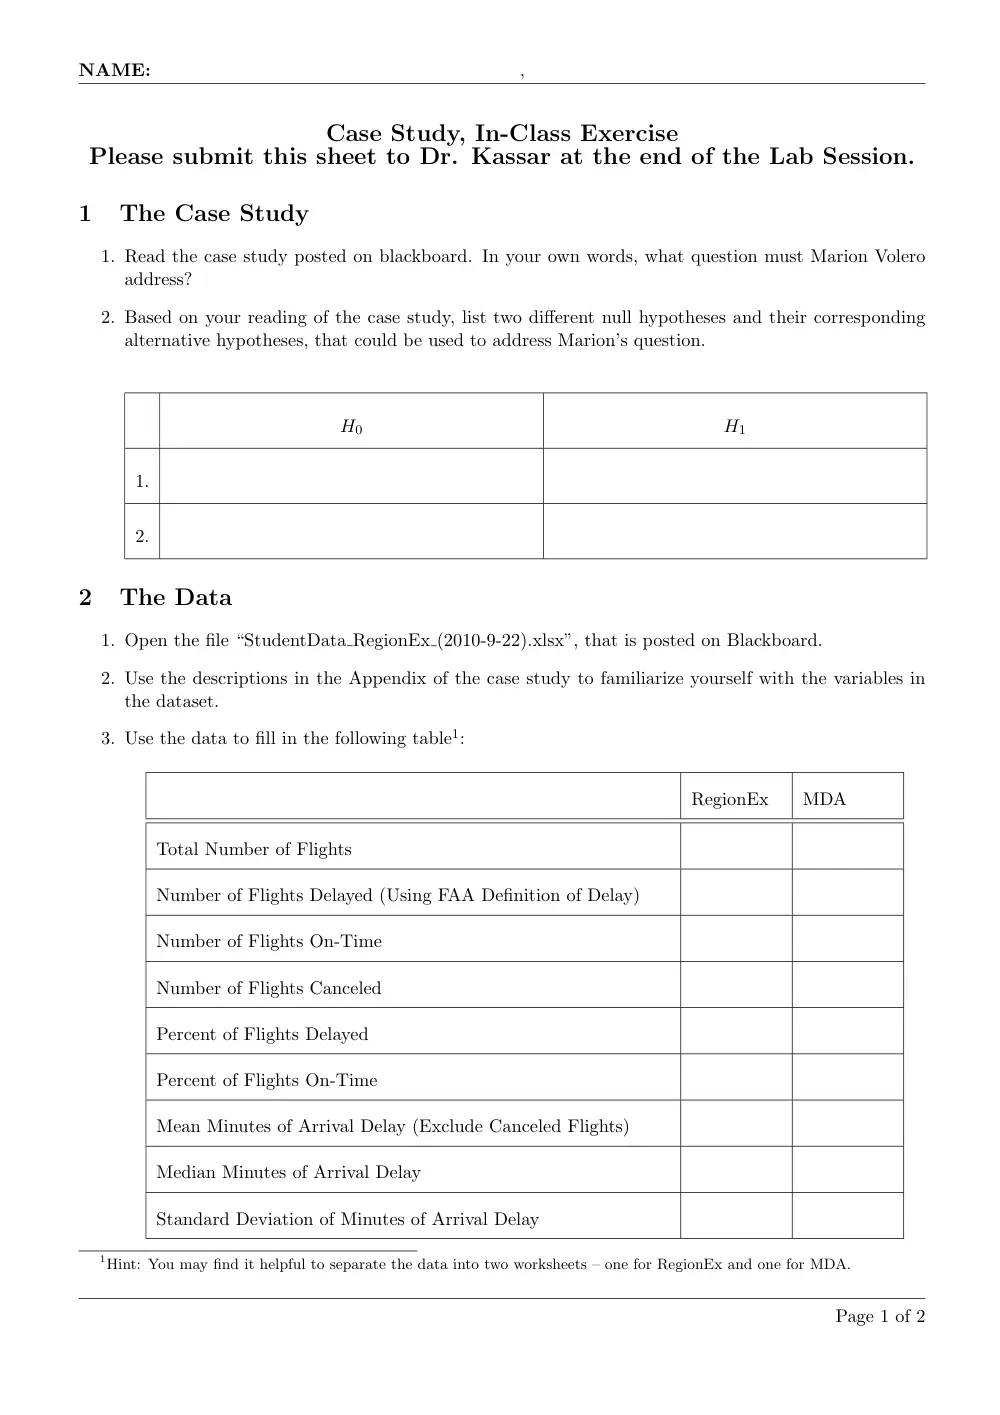
1. Read the case study posted on blackboard. In your own words, what question must Marion Volero
address?
2. Based on your reading of the case study, list two different null hypotheses and their corresponding
alternative hypotheses, that could be used to address Marion’s question.
H0
H1
1.
2.
2
The Data
1. Open the file “StudentData RegionEx (2010-9-22).xlsx”, that is posted on Blackboard.
2. Use the descriptions in the Appendix of the case study to familiarize yourself with the variables in
the dataset.
3. Use the data to fill in the following table1:
RegionEx
MDA
Total Number of Flights
Number of Flights Delayed (Using FAA Definition of Delay)
Number of Flights On-Time
Number of Flights Canceled
Percent of Flights Delayed
Percent of Flights On-Time
Mean Minutes of Arrival Delay (Exclude Canceled Flights)
Median Minutes of Arrival Delay
Standard Deviation of Minutes of Arrival Delay
1Hint: You may find it helpful to separate the data into two worksheets – one for RegionEx and one for MDA.
Page 1 of 2
NAME:
,
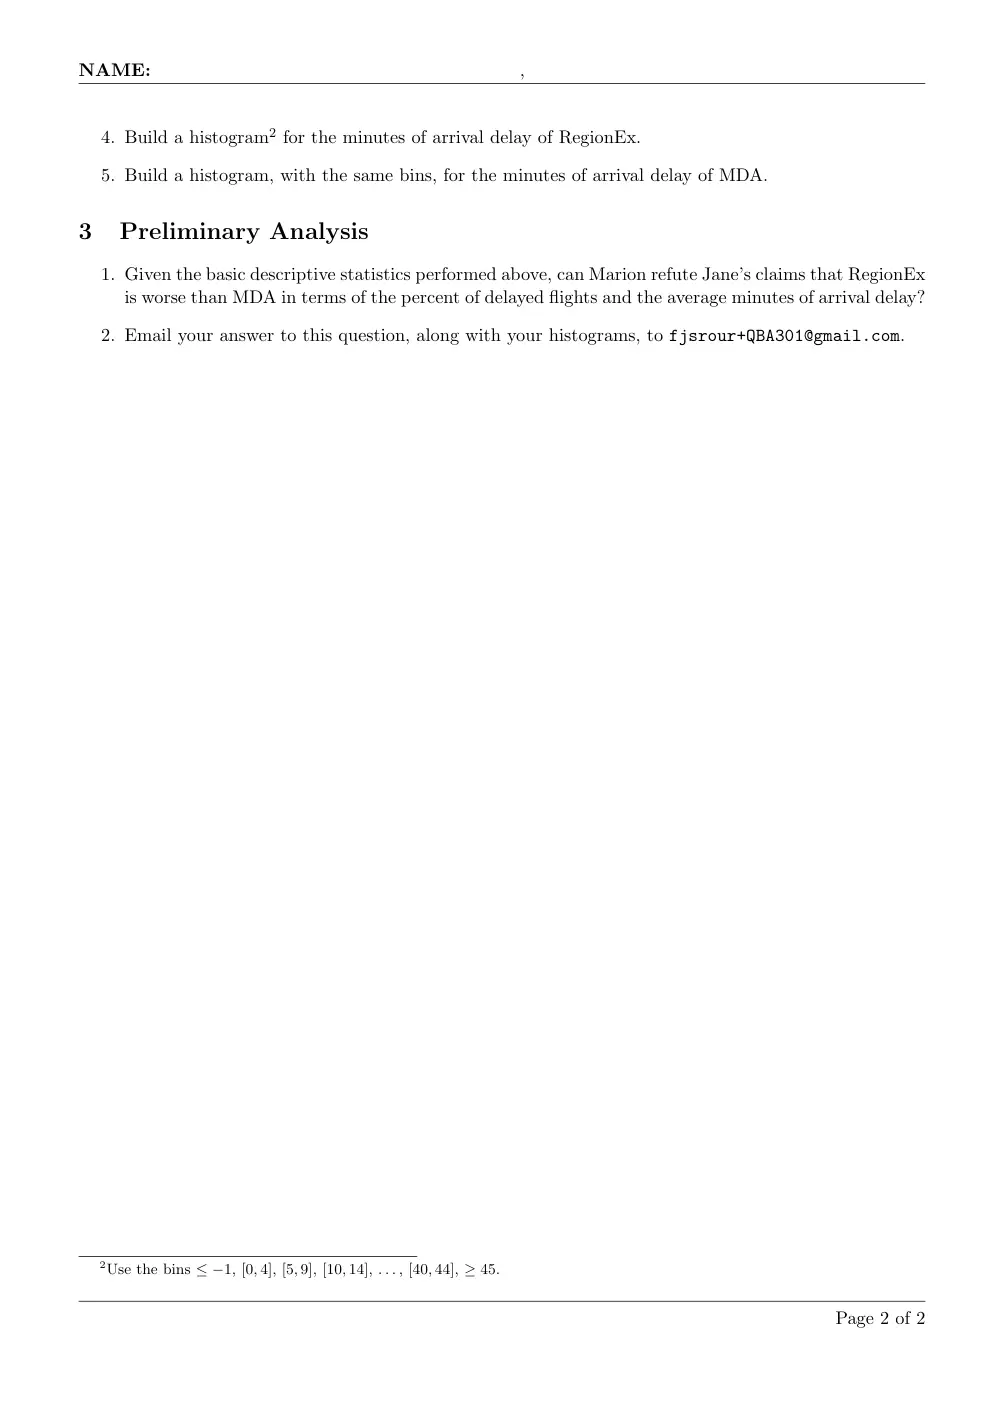
4. Build a histogram2 for the minutes of arrival delay of RegionEx.
5. Build a histogram, with the same bins, for the minutes of arrival delay of MDA.
3
Preliminary Analysis
1. Given the basic descriptive statistics performed above, can Marion refute Jane’s claims that RegionEx
is worse than MDA in terms of the percent of delayed flights and the average minutes of arrival delay?
2. Email your answer to this question, along with your histograms, to fjsrour+QBA301@gmail.com.
2Use the bins ≤ −1, [0, 4], [5, 9], [10, 14], . . . , [40, 44], ≥ 45.
Page 2 of 2