
ECN 323 Chapter 1, Fall 2015
Notre Dame University–Louaize · Intermediate Macroeconomic Analysis · 23 pages


Showing the first 10 of 23 pages. Download the PDF to see all of it.
More ECN 323 files
Show the text of this chapter
Intermediate Macroeconomics
ECN323
- Topic 1 -
by
Charbel BASSIL
Outline
« The Science of Macroeconomics »
Macroeconomics Eighth Edition
by Gregory Mankiw
▶ What Macroeconomists Study
▶ How Economists Think
What Macroeconomists Study
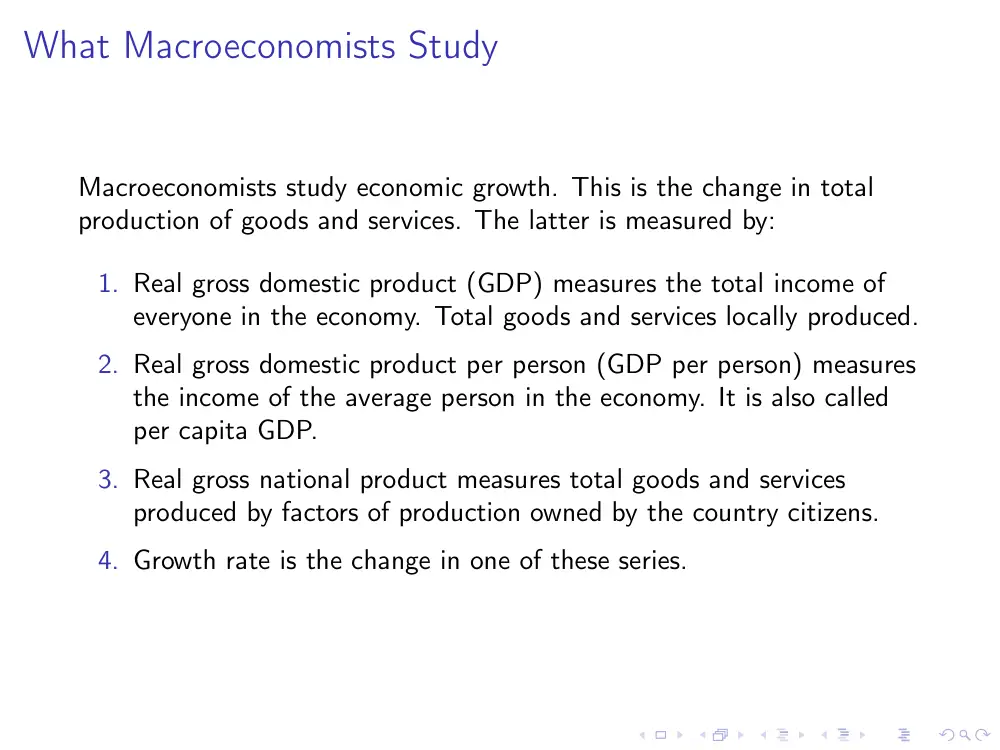
Macroeconomists study economic growth. This is the change in total
production of goods and services. The latter is measured by:
1. Real gross domestic product (GDP) measures the total income of
everyone in the economy. Total goods and services locally produced.
2. Real gross domestic product per person (GDP per person) measures
the income of the average person in the economy. It is also called
per capita GDP.
3. Real gross national product measures total goods and services
produced by factors of production owned by the country citizens.
4. Growth rate is the change in one of these series.
What Macroeconomists Study
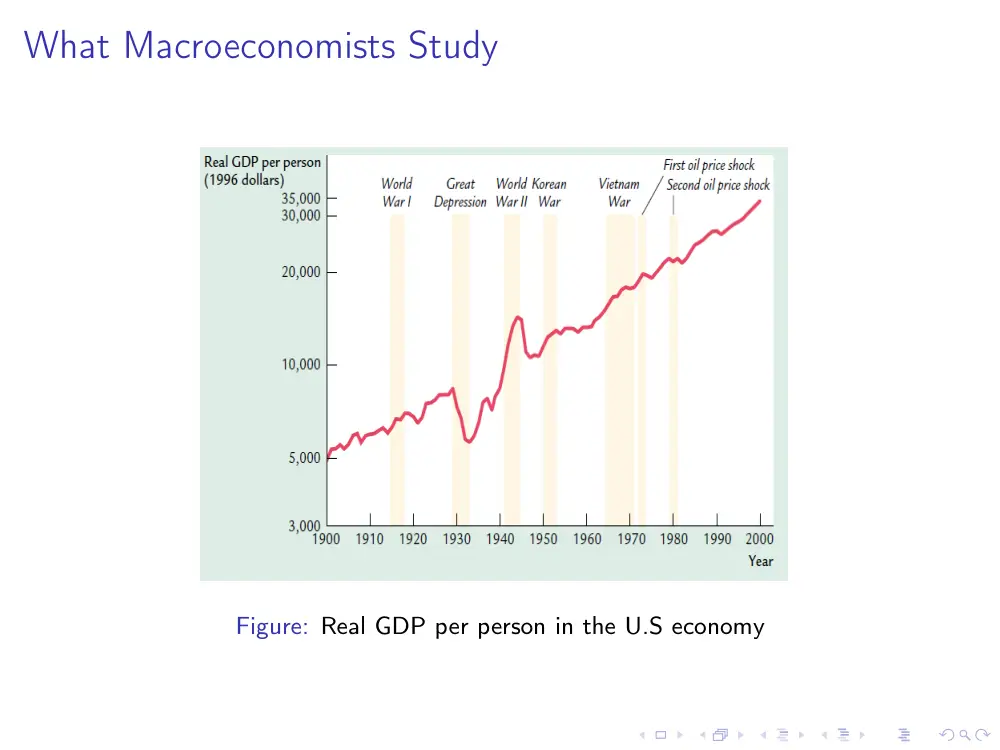
Figure: Real GDP per person in the U.S economy
What Macroeconomists Study
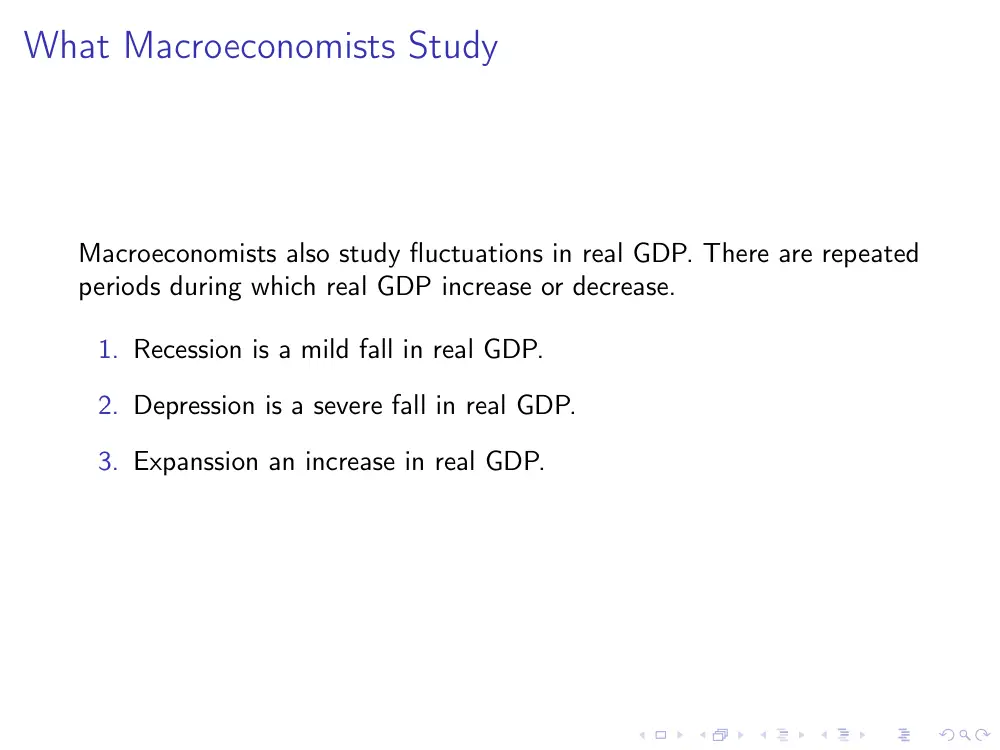
Macroeconomists also study fluctuations in real GDP. There are repeated
periods during which real GDP increase or decrease.
1. Recession is a mild fall in real GDP.
2. Depression is a severe fall in real GDP.
3. Expanssion an increase in real GDP.
What Macroeconomists Study
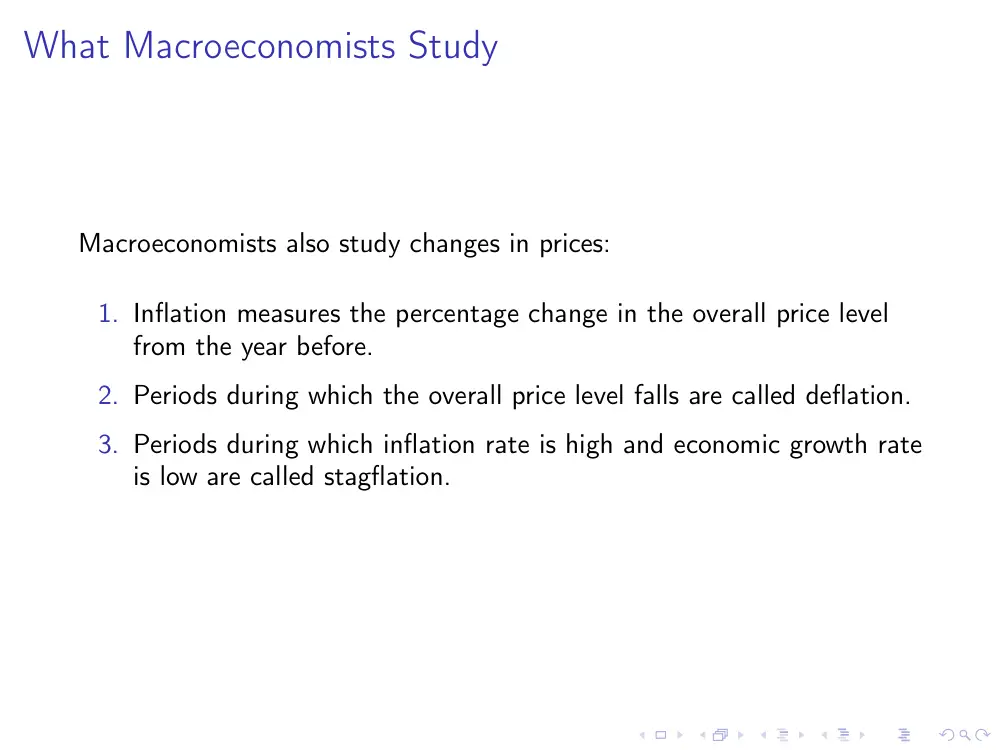
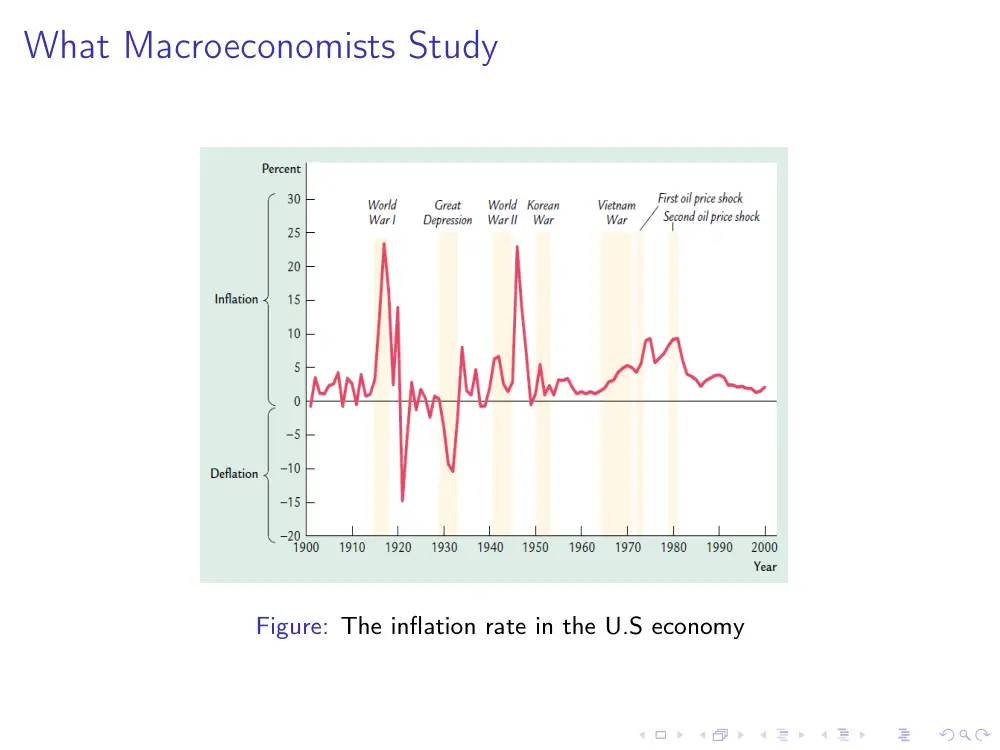
Macroeconomists also study changes in prices:
1. Inflation measures the percentage change in the overall price level
from the year before.
2. Periods during which the overall price level falls are called deflation.
3. Periods during which inflation rate is high and economic growth rate
is low are called stagflation.
What Macroeconomists Study
Figure: The inflation rate in the U.S economy
What Macroeconomists Study
A measure for the overall price level is:
1. Consumer price index (CPI) is a price index computed each month
using a bundle that is meant to represent the « market basket »
purchased monthly by the typical urban consumer.
2. GDP deflator is an index computed quarterly. It measures the level
of prices of all goods and services locally produced.
CPI versus GDP deflator
1- CPI:
1. covers only consumer goods and services.
2. includes prices of imported goods.
2- GDP deflator:
1. covers all good and services produced in the economy.
2. does not include prices of imported goods.
What Macroeconomists Study
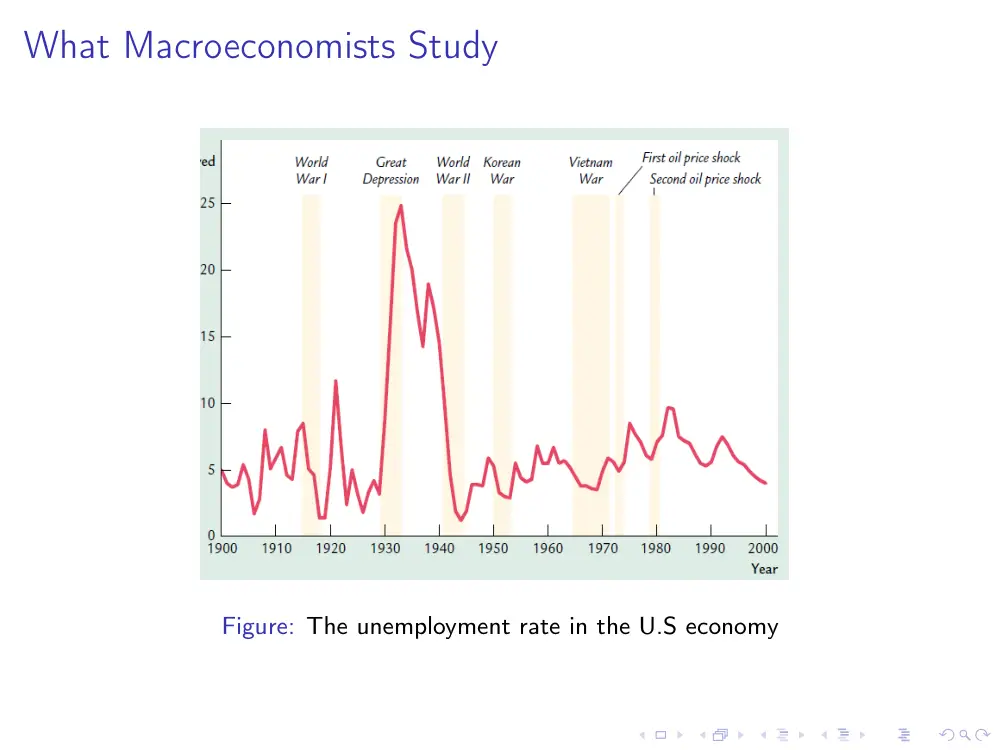
Macroeconomists also study unemployment:
Unemployment rate measures the fraction of the labor force that is out of
work.
What Macroeconomists Study
Figure: The unemployment rate in the U.S economy
How Economists Think
▶ Economists use models to:
1. understand relationship between economic variables (GDP, inflation,
unemployment)
2. explain the economy’s behavior
3. devise policies to improve economic performance
▶ Models are built with mathematical tools and have two kind of
variables: endogenous variables and exogenous variables:
1. Models are simplified theories that show the key relationships among
economic variables.
2. Endogenous variables are variables that a model try to explain
(model’s output).
3. Exogenous variables are variables that a model takes as given
(model’s input).
How Economists Think
1- Example of a model: supply and demand for pizza
Motivation: explain the factors that determine the price of pizza and the
quantity sold.
We assume that the market is competitive: each buyer and seller is too
small to affect the market price.
Variables:
▶ Qd = quantity of pizza that buyers demand; Qd = D(P, Y )
▶ Qs = quantity that producers supply; Qs = S(P, Pm)
▶ P = price of pizza
▶ Pm = price of materials such as cheese, tomatoes, flour . . .
▶ Y = aggregate income
At the equilibrium
Qd = Qs
(1)
Endogenous variables: P, Qd, Qs
Exogenous variables: Y , Pm
How Economists Think
1- Example of a model: supply and demand for pizza
Figure: Supply and demand diagram
The demand curve slopes downward.
The supply curve slopes upward
How Economists Think
2- An increase in Y
Figure: A shift in demand
An increase in income increases the quantity of pizza consumers demand
at each price which increases the equilibrium price and quantity.
How Economists Think
3- An increase in Pm
Figure: A shift in supply
An increase in the price of materials decreases the quantity of pizza
produced at each price which increases the equilibrium price and decrease
the equilibrium quantity.
How Economists Think
4- Introduction of an income tax T, Qd = D(P, Y , T)
S
D1
D2
S
D1
D2
1
P
P
Q
1
Q
1
If T increase
If T decrease
Figure: The effect of a tax on demand
How Economists Think
5- Elimination of the subsidy given to tomato’s producers
S1
D
S2
S1
D
S2
1
P
P
Q
1
Q
1
Tomato market
Pizza market
Figure: The effect of a subsidy on supply
How Economists Think
6- A movement along the demand curve vs a shift of the demand curve
The change that takes place in a demand curve corresponding to a new
relationship between quantity demanded of a good and price of that good
induce a change in the original conditions. This leads to shift of a
demand curve.
1. Change in income, preferences, prices of other goods or services and
expectation leads to change in demand (shift of the demand
curve).
2. Change in price of a good or service leads to change in quantity
demanded (movement along a demand curve)
How Economists Think
7- A movement along the supply curve vs a shift of the supply curve
The change that takes place in a supply curve corresponding to a new
relationship between quantity supplied of a good and price of that good
induce a change in the original conditions. This leads to shift of a supply
curve.
1. Change in costs, input prices, technologies or prices of related goods
and services leads to change in supply (shift of the supply curve).
2. Change in price of a good or service leads to change in quantity
supplied (movement along a supply curve).
How Economists Think
8- The use of multiple models
▶ There is no single “correct” model that is always applicable. No one
model can address all the issues we care about. For example,
1. If we want to know how a fall in aggregate income affects new car
prices, we can use the S/D model for new cars.
2. But if we want to know why aggregate income falls, we need a
different model.
▶ So we will learn different models for studying different issues
(unemployment, inflation, growth).
▶ For each new model, you should keep track of:
1. its assumptions,
2. which variables are endogenous and exogenous,
3. which questions it can help us understand,
How Economists Think
9- Prices: Flexible vs Sticky
▶ Market clearing is an assumption that prices are flexible and adjust
to equate supply and demand.
▶ In the short run, many prices are sticky -they adjust only sluggishly
in response to supply/demand imbalances.
Example:
1. Labor contracts that fix the nominal wage for a year or longer.
2. Magazine prices that publishers change only once every 3-4 years.
How Economists Think
9- Prices: Flexible vs Sticky
▶ The economy’s behavior depends partly on whether prices are sticky
or flexible:
If prices are sticky, then demand won’t always equal supply. This
helps explain:
1. unemployment (excess supply of labor)
2. the occasional inability of firms to sell what they produce
▶ Long run: prices flexible, markets clear, economy behaves very
differently.
▶ Short run: prices are sticky
▶ Read Chapter 1 and 2 of Gregory Mankiw
▶ Next time: Chapter 2 of Gregory Mankiw « The Data of
Macroeconomics »