
STA 207 Final, Spring 2010
Notre Dame University–Louaize · Applied Statistics for Business and Economics II · 11 pages





Showing the first 10 of 11 pages. Download the PDF to see all of it.
More STA 207 files
Show the text of this final exam
Sta207
Final exam
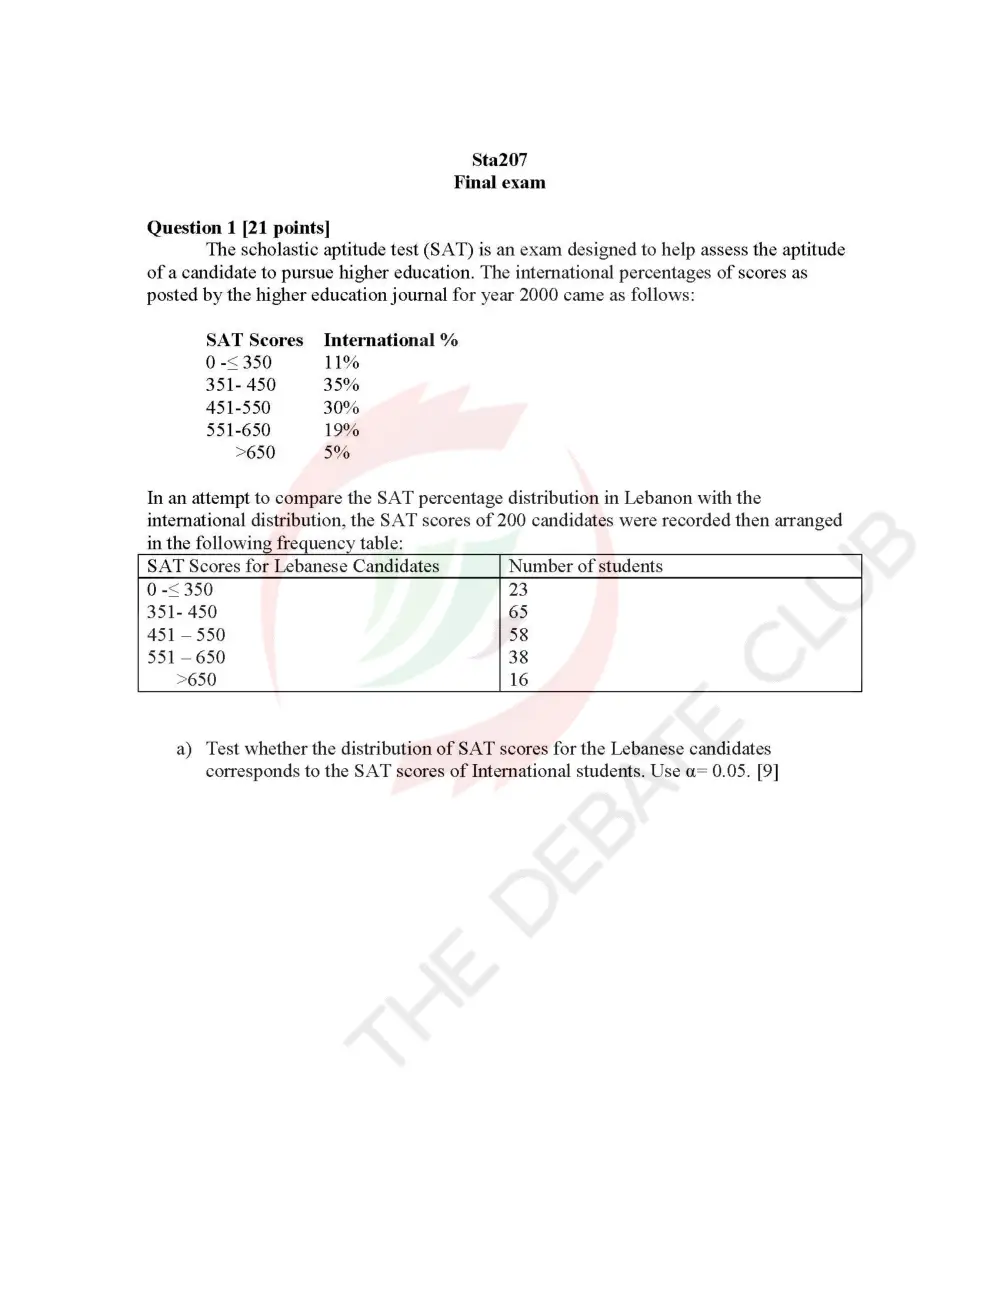
Question 1 [21 points]
The scholastic aptitude test (SAT) is an exam designed to help assess the aptitude
of a candidate to pursue higher education. The international percentages of scores as
posted by the higher education journal for year 2000 came as follows:
SAT Scores International %
0 -< 350 11%
351- 450 35%
451-550 30%
551-650 19%
>650 5%
In an attempt to compare the SAT percentage distribution in Lebanon with the
international distribution, the SAT scores of 200 candidates were recorded then arranged
in the following frequency table:
SAT Scores for Lebanese Candidates Number of students
0 -< 350 23
351- 450 65
451 —550 58
551-650 38
>650 16
a) Test whether the distribution of SAT scores for the Lebanese candidates
corresponds to the SAT scores of International students. Use a= 0.05. [9]
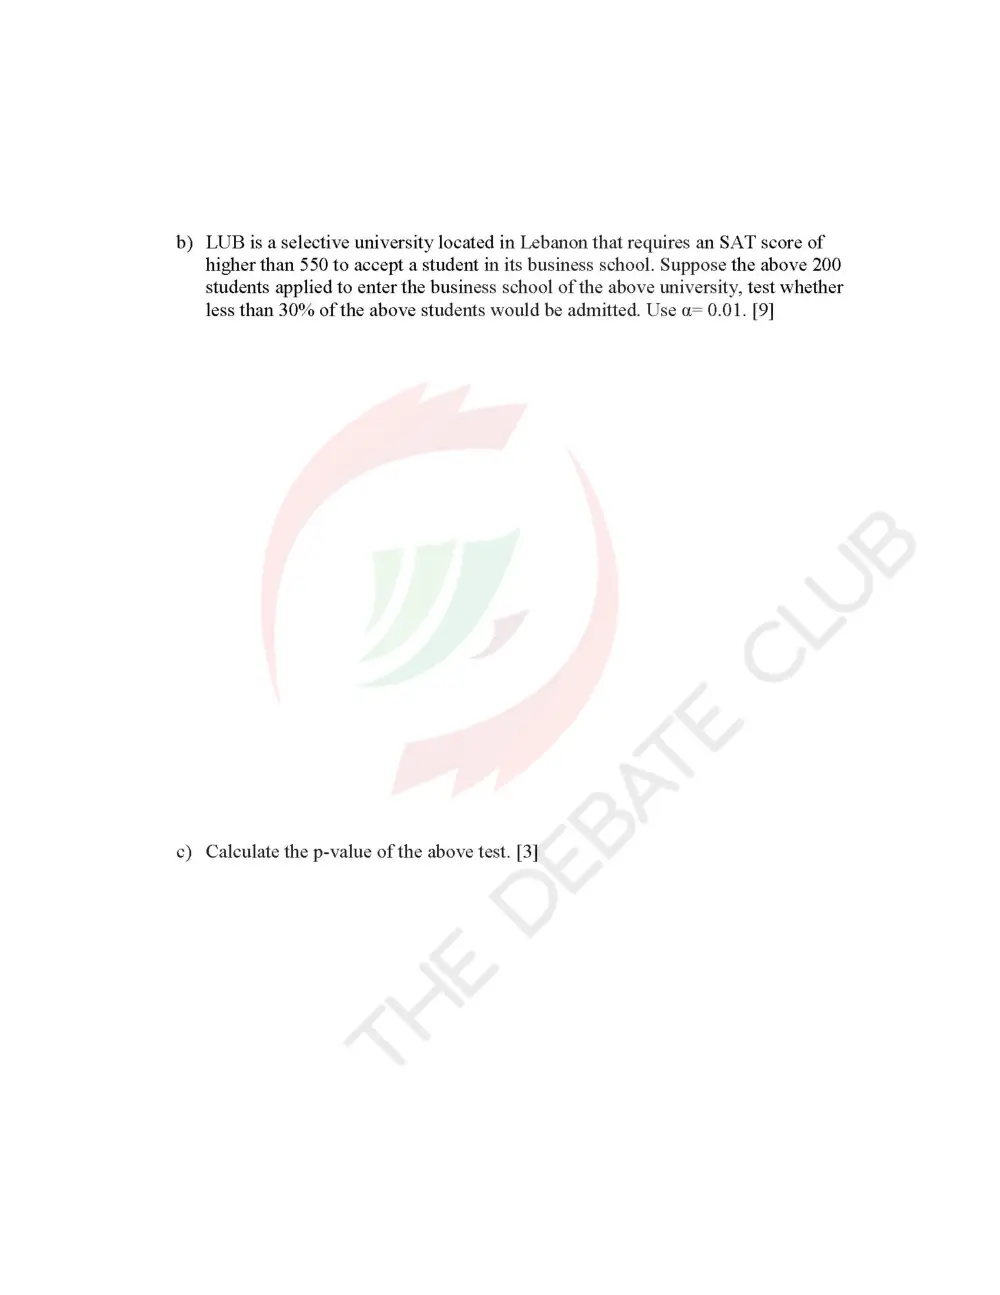
b) LUB is a selective university located in Lebanon that requires an SAT score of
higher than 550 to accept a student in its business school. Suppose the above 200
students applied to enter the business school of the above university, test whether
less than 30% of the above students would be admitted. Use a= 0.01. [9]
c) Calculate the p-value of the above test. [3]
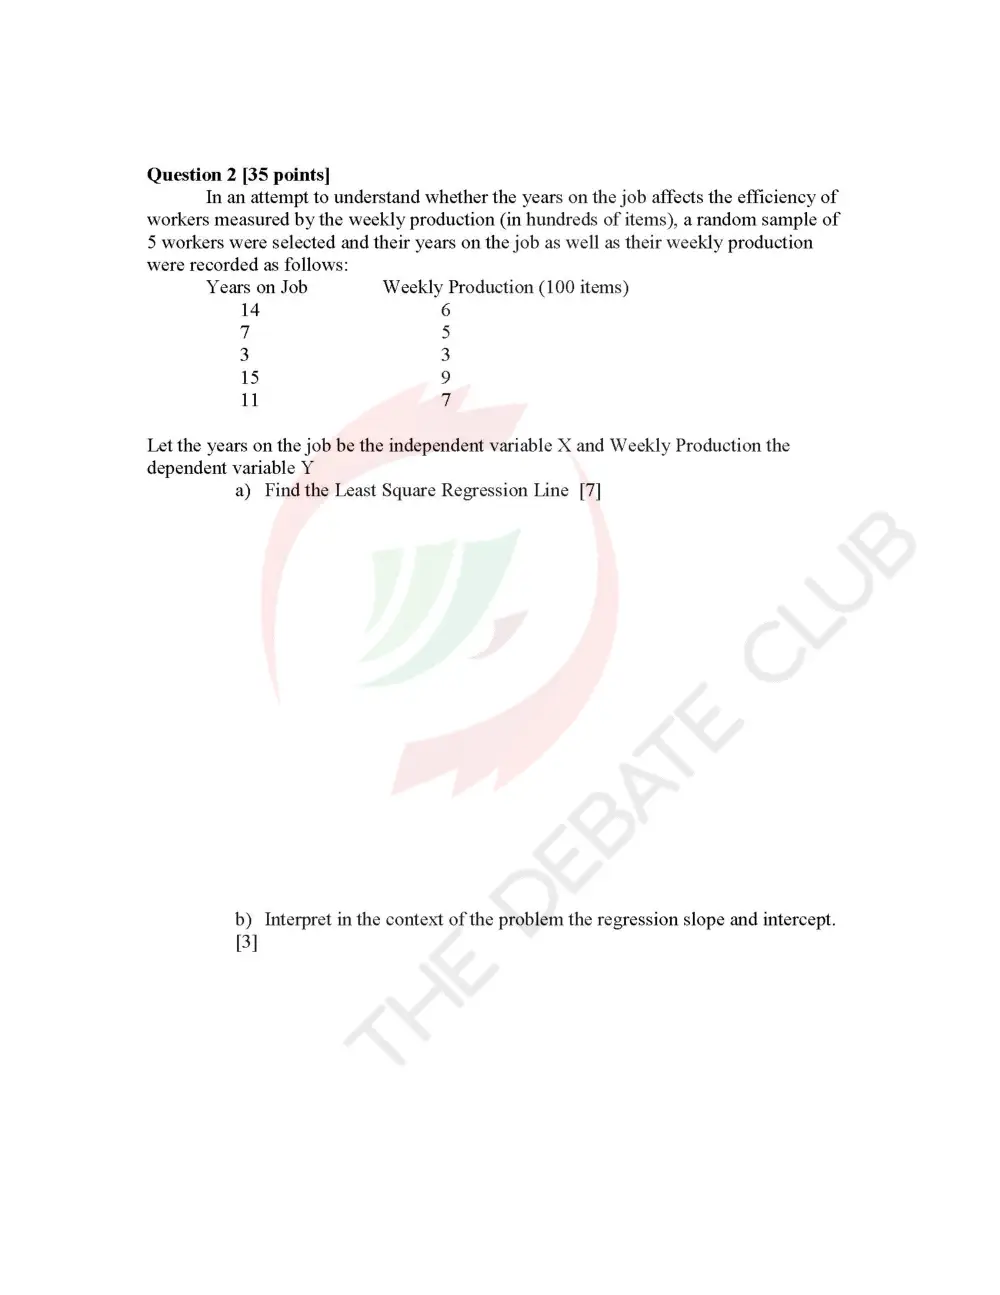
Question 2 [35 points]
In an attempt to understand whether the years on the job affects the efficiency of
workers measured by the weekly production (in hundreds of items), a random sample of
5 workers were selected and their years on the job as well as their weekly production
were recorded as follows:
Years on Job Weekly Production (100 items)
14 6
7 5
3 3
15 9
11 7
Let the years on the job be the independent variable X and Weekly Production the
dependent variable Y
a) Find the Least Square Regression Line [7]
b) Interpret in the context of the problem the regression slope and intercept.
[3]
c) Fora person who has been on the job for 7 years, what would be his
expected weekly production. Does the regression line overestimate or
underestimate reality at this point? Why [3]
d) Determine the coefficient of determination and interpret its meaning. [4]
e) Construct a 90% Confidence Interval for the population regression slope.
[8]
f) Interpret the above interval in the context of the problem. [2]
g) If you are to test whether there is a positive relationship between the years
on the job and the productivity without limiting yourself to a specific a.
Conduct the above test using the p-value approach. [4]
h) Using your p-value, what would your conclusion be if @ =0.005?
What if a =0.1? Justify [4]
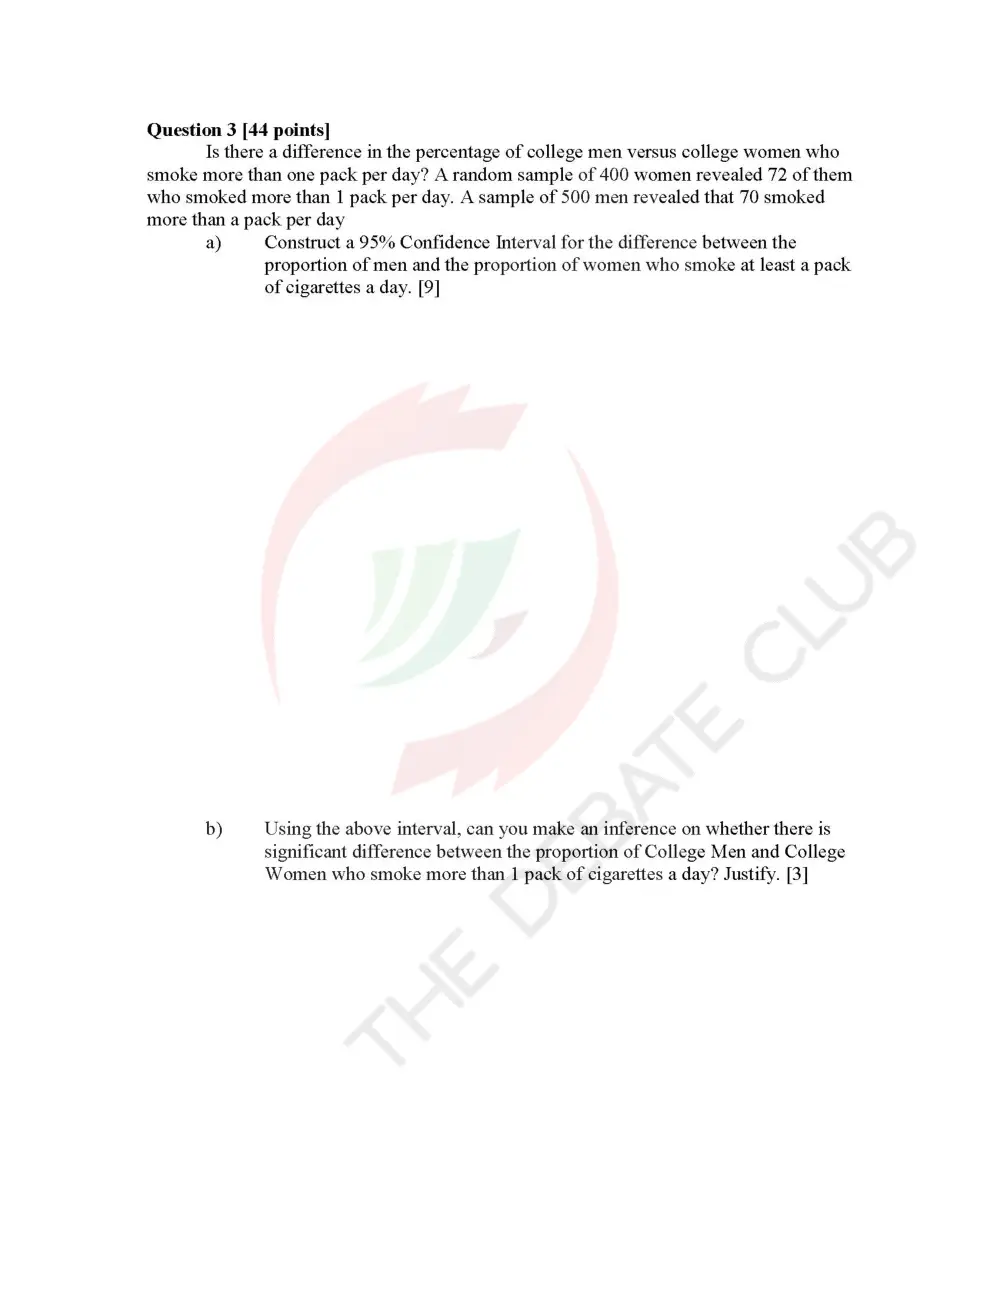
Question 3 [44 points]
Is there a difference in the percentage of college men versus college women who
smoke more than one pack per day? A random sample of 400 women revealed 72 of them
who smoked more than 1 pack per day. A sample of 500 men revealed that 70 smoked
more than a pack per day
a) Construct a 95% Confidence Interval for the difference between the
proportion of men and the proportion of women who smoke at least a pack
of cigarettes a day. [9]
b) Using the above interval, can you make an inference on whether there is
significant difference between the proportion of College Men and College
Women who smoke more than 1 pack of cigarettes a day? Justify. [3]
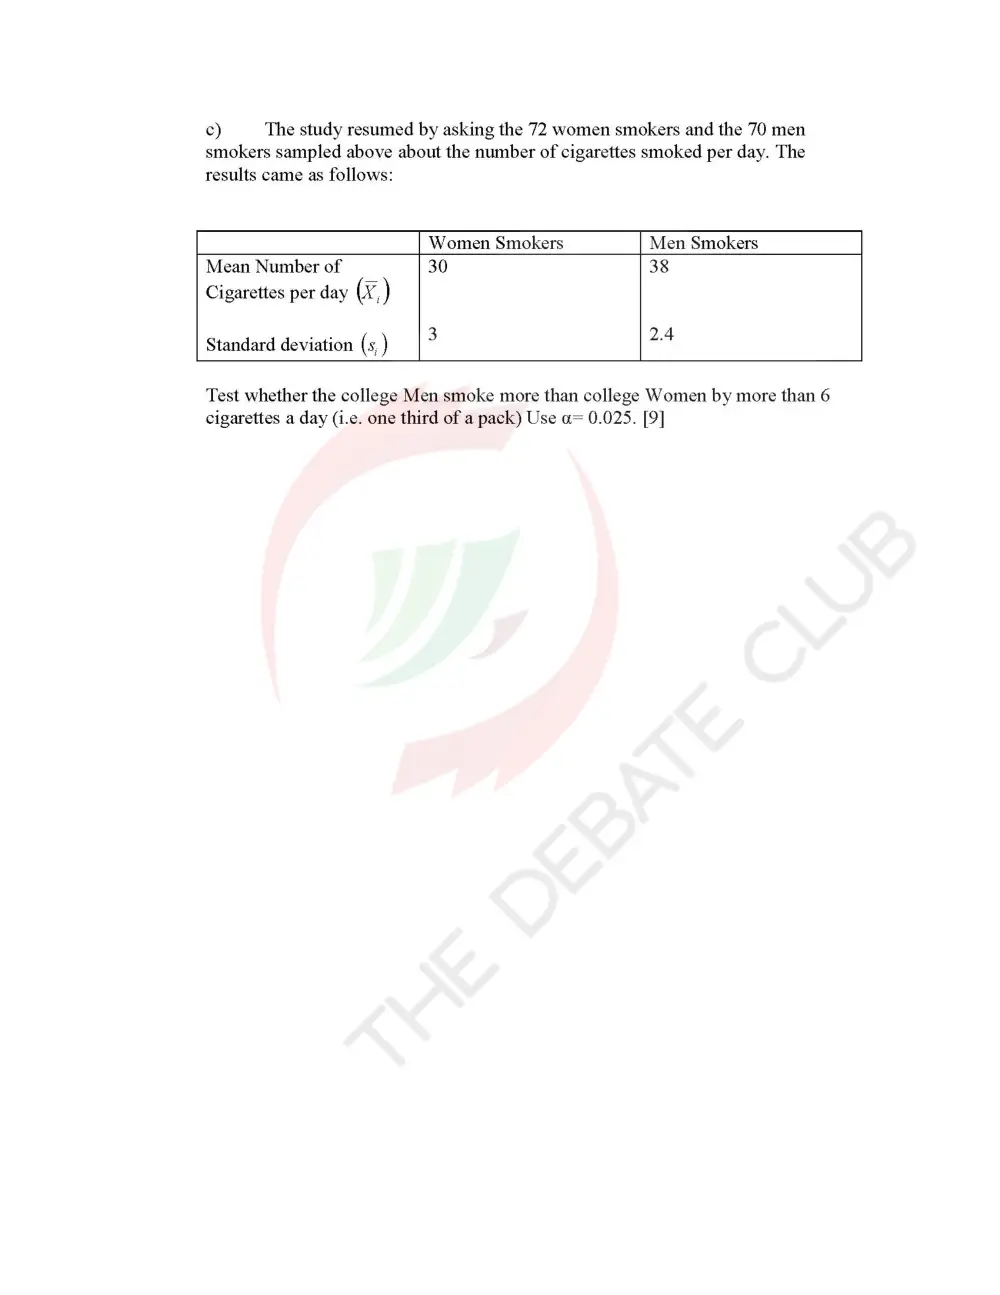
c) The study resumed by asking the 72 women smokers and the 70 men
smokers sampled above about the number of cigarettes smoked per day. The
results came as follows:
Women Smokers Men Smokers
Mean Number of 30 38
Cigarettes per day (x)
Standard deviation (s,) 3 a
Test whether the college Men smoke more than college Women by more than 6
cigarettes a day (i.e. one third of a pack) Use a= 0.025. [9]
d) Test at a= 0.025 whether College heavy smokers (those who smoke more
than one pack, men and women combined), smoke more than 33 cigarettes per
day knowing that the average number of cigarettes for the 142 students sampled
above is 34 cigarettes and the standard deviation is 2.7 cigarettes. [8]
e) Calculate the B error of the above test if the true average number of
cigarettes for college student is 34. [7]