
DCSN 205 Final, Spring 2012
American University of Beirut · Operations Management · 12 pages

Showing the first 10 of 12 pages. Download the PDF to see all of it.
More DCSN 205 files
- Final · Fall 2015Final examView
- Final Inal · Fall 2015Final examView
- Final · Spring 2011Final examView
- Final · Fall 2011Final examView
- Final · Fall 2010Final examView
- Homework Solution Chapter 9 · Fall 2015Chapter · with solutionView
- Homework F · Fall 2015HomeworkView
- Homework Solution Chapter 8 · Fall 2015Chapter · with solutionView
Show the text of this final exam
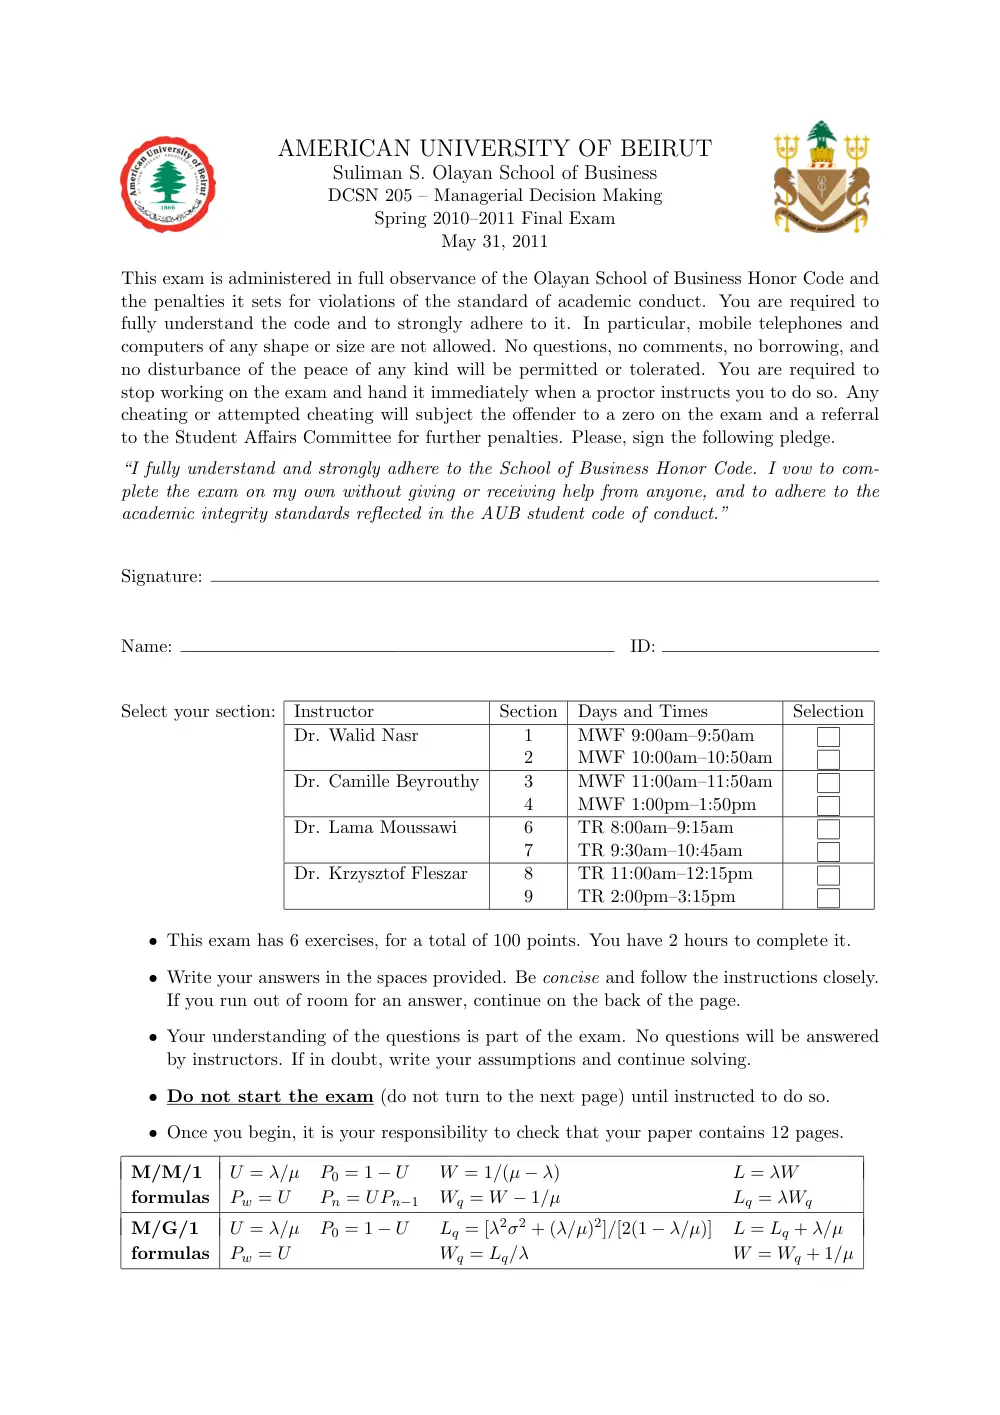
AMERICAN UNIVERSITY OF BEIRUT
Suliman S. Olayan School of Business
DCSN 205 – Managerial Decision Making
Spring 2010–2011 Final Exam
May 31, 2011
This exam is administered in full observance of the Olayan School of Business Honor Code and
the penalties it sets for violations of the standard of academic conduct. You are required to
fully understand the code and to strongly adhere to it. In particular, mobile telephones and
computers of any shape or size are not allowed. No questions, no comments, no borrowing, and
no disturbance of the peace of any kind will be permitted or tolerated. You are required to
stop working on the exam and hand it immediately when a proctor instructs you to do so. Any
cheating or attempted cheating will subject the offender to a zero on the exam and a referral
to the Student Affairs Committee for further penalties. Please, sign the following pledge.
“I fully understand and strongly adhere to the School of Business Honor Code. I vow to com-
plete the exam on my own without giving or receiving help from anyone, and to adhere to the
academic integrity standards reflected in the AUB student code of conduct.”
Signature:
Name:
ID:
Select your section:
Instructor
Section
Days and Times
Selection
Dr. Walid Nasr
1
MWF 9:00am–9:50am
2
MWF 10:00am–10:50am
Dr. Camille Beyrouthy
3
MWF 11:00am–11:50am
4
MWF 1:00pm–1:50pm
Dr. Lama Moussawi
6
TR 8:00am–9:15am
7
TR 9:30am–10:45am
Dr. Krzysztof Fleszar
8
TR 11:00am–12:15pm
9
TR 2:00pm–3:15pm
• This exam has 6 exercises, for a total of 100 points. You have 2 hours to complete it.
• Write your answers in the spaces provided. Be concise and follow the instructions closely.
If you run out of room for an answer, continue on the back of the page.
• Your understanding of the questions is part of the exam. No questions will be answered
by instructors. If in doubt, write your assumptions and continue solving.
• Do not start the exam (do not turn to the next page) until instructed to do so.
• Once you begin, it is your responsibility to check that your paper contains 12 pages.
M/M/1
U = λ/µ
P0 = 1 − U
W = 1/(µ − λ)
L = λW
formulas
Pw = U
Pn = UPn−1
Wq = W − 1/µ
Lq = λWq
M/G/1
U = λ/µ
P0 = 1 − U
Lq = [λ2σ2 + (λ/µ)2]/[2(1 − λ/µ)]
L = Lq + λ/µ
formulas
Pw = U
Wq = Lq/λ
W = Wq + 1/µ
Exercise 1
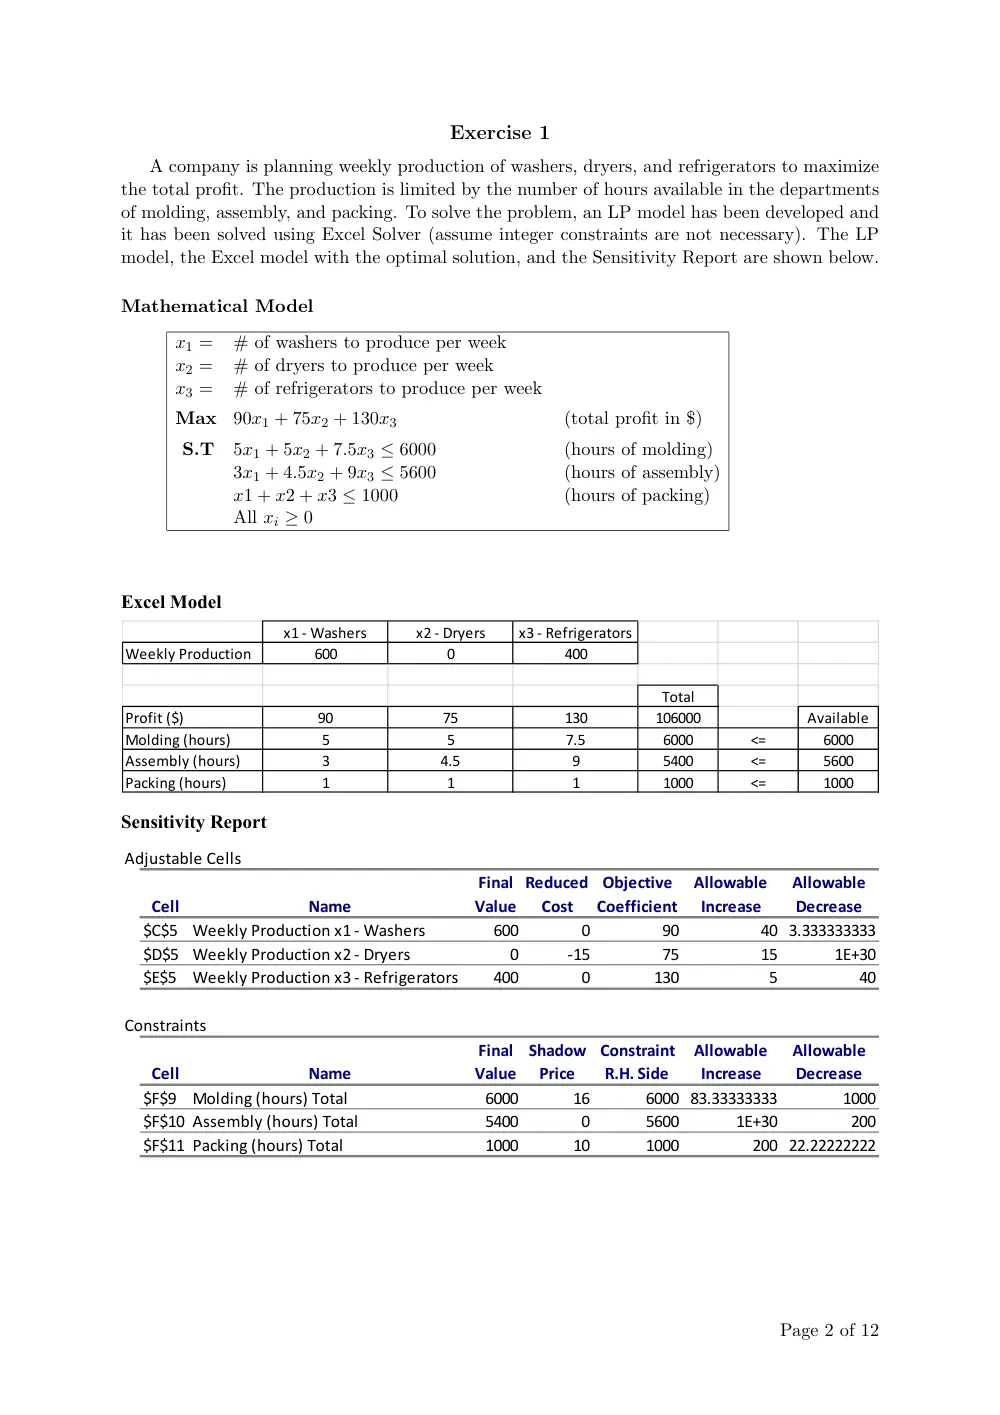
A company is planning weekly production of washers, dryers, and refrigerators to maximize
the total profit. The production is limited by the number of hours available in the departments
of molding, assembly, and packing. To solve the problem, an LP model has been developed and
it has been solved using Excel Solver (assume integer constraints are not necessary). The LP
model, the Excel model with the optimal solution, and the Sensitivity Report are shown below.
Mathematical Model
x1 =
# of washers to produce per week
x2 =
# of dryers to produce per week
x3 =
# of refrigerators to produce per week
Max
90x1 + 75x2 + 130x3
(total profit in $)
S.T
5x1 + 5x2 + 7.5x3 ≤ 6000
(hours of molding)
3x1 + 4.5x2 + 9x3 ≤ 5600
(hours of assembly)
x1 + x2 + x3 ≤ 1000
(hours of packing)
All xi ≥ 0
x1 - Washers
x2 - Dryers
x3 - Refrigerators
Weekly Production
600
0
400
Total
Profit ($)
90
75
130
106000
Available
Molding (hours)
5
5
7.5
6000
<=
6000
Assembly (hours)
3
4.5
9
5400
<=
5600
Packing (hours)
1
1
1
1000
<=
1000
Adjustable Cells
Final Reduced
Objective
Allowable
Allowable
Cell
Name
Value
Cost
Coefficient
Increase
Decrease
$C$5
Weekly Production x1 - Washers
600
0
90
40 3.333333333
$D$5 Weekly Production x2 - Dryers
0
-15
75
15
1E+30
$E$5
Weekly Production x3 - Refrigerators
400
0
130
5
40
Constraints
Final
Shadow Constraint
Allowable
Allowable
Cell
Name
Value
Price
R.H. Side
Increase
Decrease
$F$9
Molding (hours) Total
6000
16
6000 83.33333333
1000
$F$10 Assembly (hours) Total
5400
0
5600
1E+30
200
$F$11 Packing (hours) Total
1000
10
1000
200 22.22222222
Excel Model
Sensitivity Report
Page 2 of 12
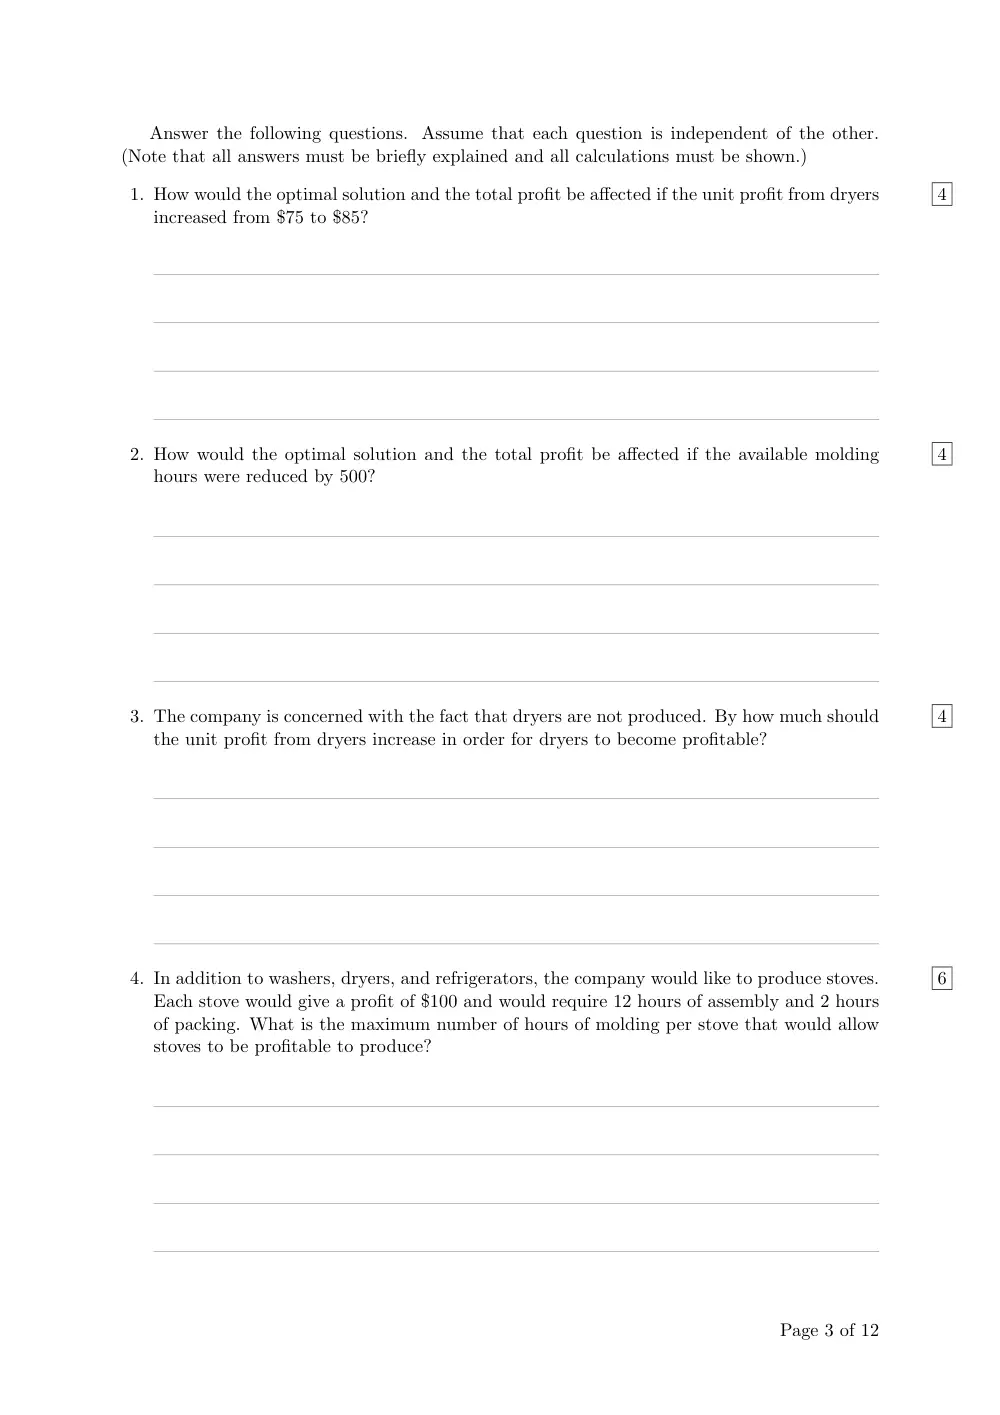
Answer the following questions. Assume that each question is independent of the other.
(Note that all answers must be briefly explained and all calculations must be shown.)
1.
4
How would the optimal solution and the total profit be affected if the unit profit from dryers
increased from $75 to $85?
2.
4
How would the optimal solution and the total profit be affected if the available molding
hours were reduced by 500?
3.
4
The company is concerned with the fact that dryers are not produced. By how much should
the unit profit from dryers increase in order for dryers to become profitable?
4.
6
In addition to washers, dryers, and refrigerators, the company would like to produce stoves.
Each stove would give a profit of $100 and would require 12 hours of assembly and 2 hours
of packing. What is the maximum number of hours of molding per stove that would allow
stoves to be profitable to produce?
Page 3 of 12
Exercise 2
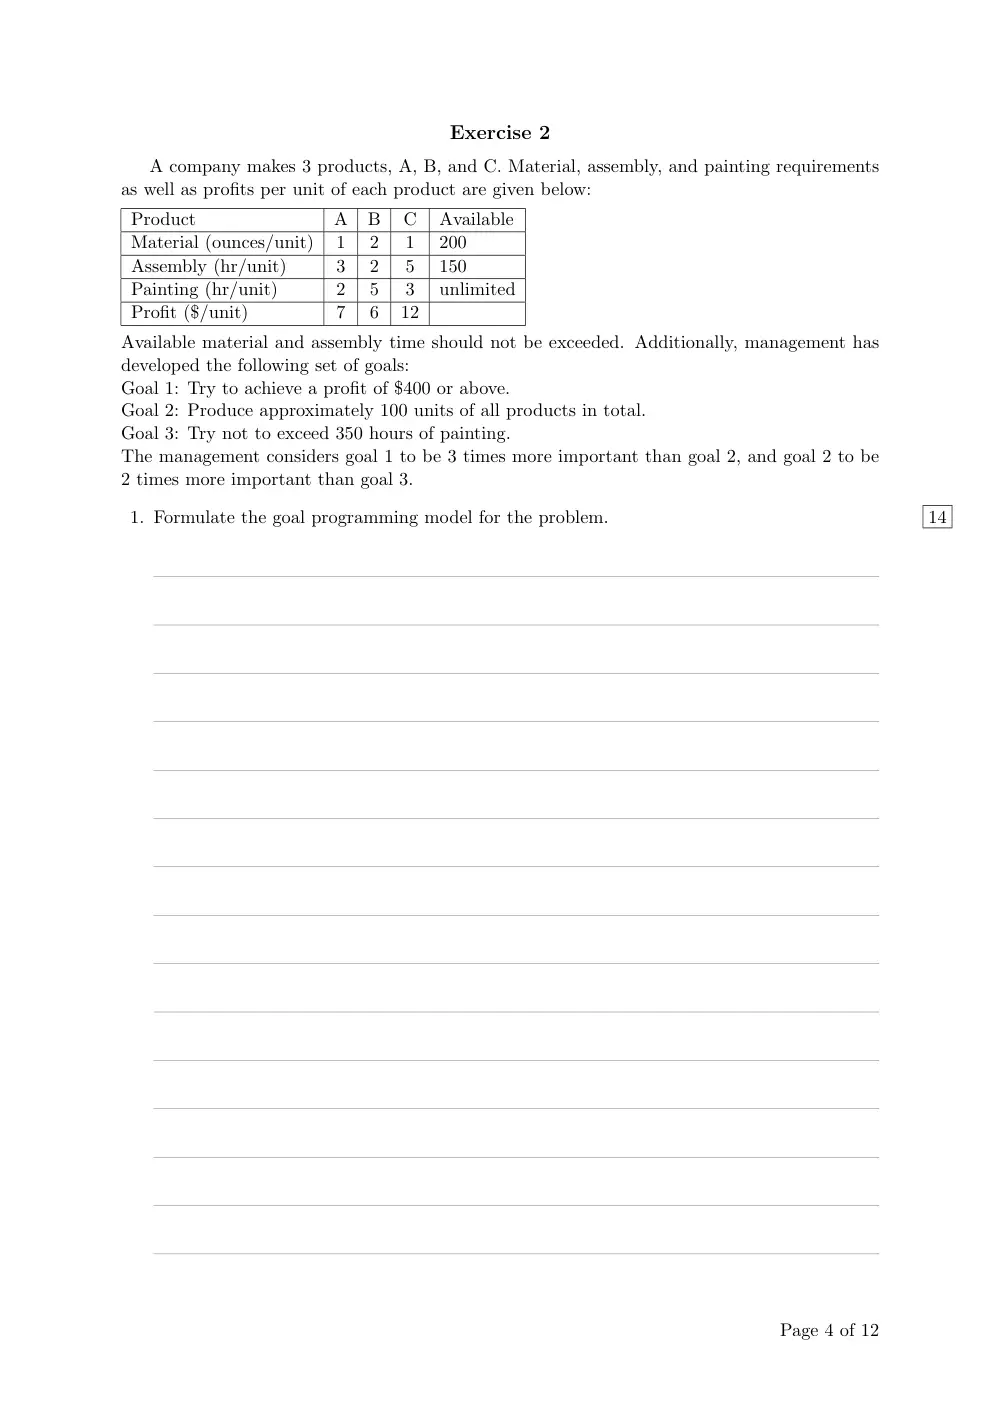
A company makes 3 products, A, B, and C. Material, assembly, and painting requirements
as well as profits per unit of each product are given below:
Product
A
B
C
Available
Material (ounces/unit)
1
2
1
200
Assembly (hr/unit)
3
2
5
150
Painting (hr/unit)
2
5
3
unlimited
Profit ($/unit)
7
6
12
Available material and assembly time should not be exceeded. Additionally, management has
developed the following set of goals:
Goal 1: Try to achieve a profit of $400 or above.
Goal 2: Produce approximately 100 units of all products in total.
Goal 3: Try not to exceed 350 hours of painting.
The management considers goal 1 to be 3 times more important than goal 2, and goal 2 to be
2 times more important than goal 3.
1.
14
Formulate the goal programming model for the problem.
Page 4 of 12
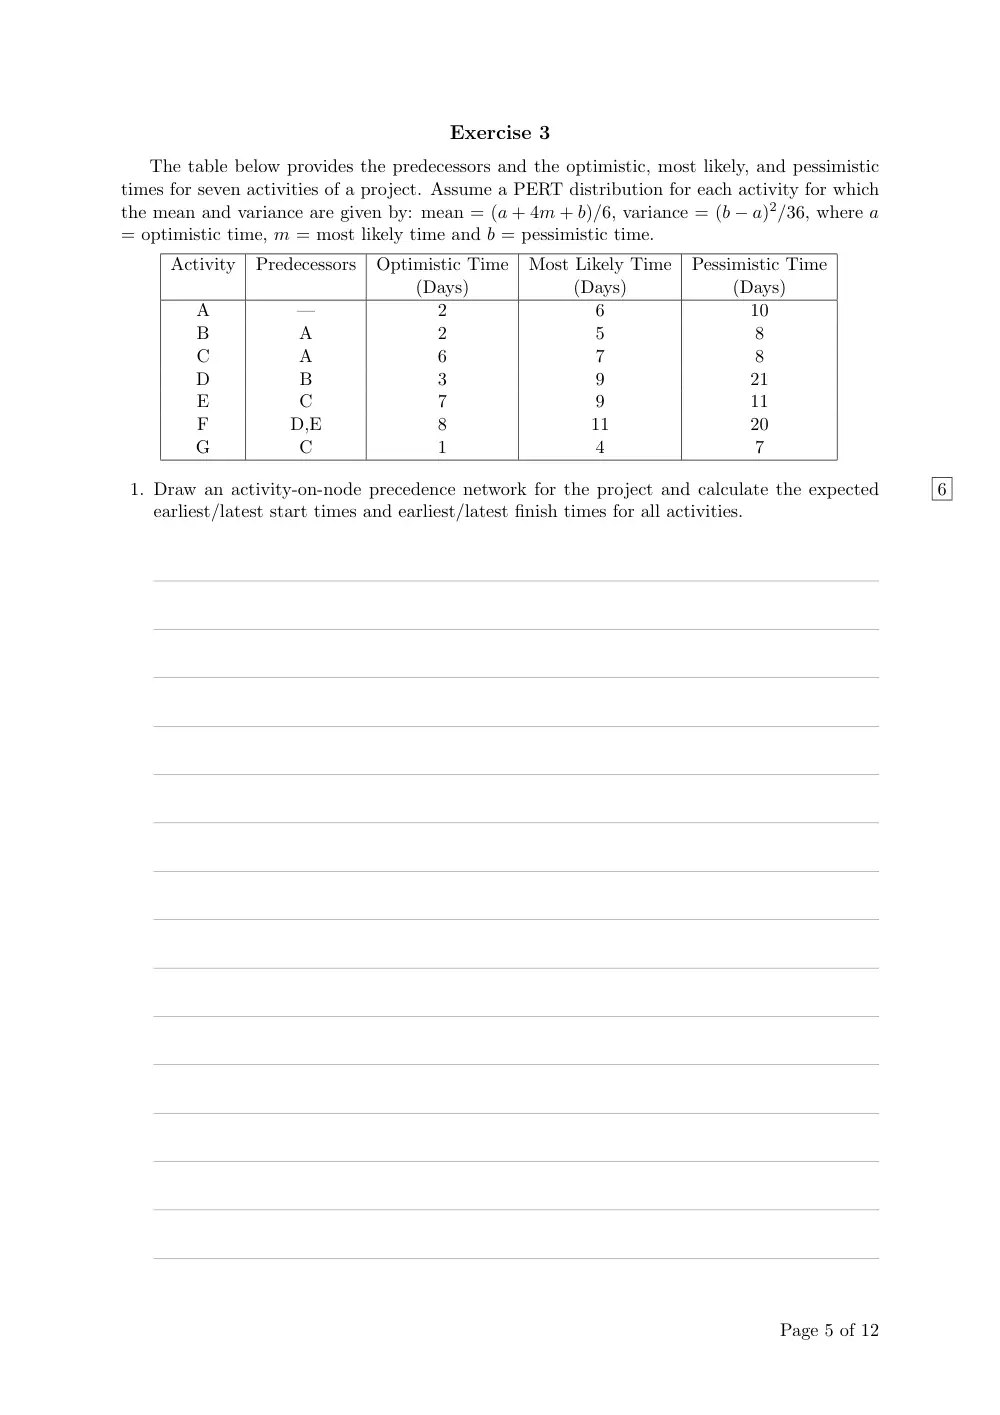
Exercise 3
The table below provides the predecessors and the optimistic, most likely, and pessimistic
times for seven activities of a project. Assume a PERT distribution for each activity for which
the mean and variance are given by: mean = (a + 4m + b)/6, variance = (b − a)2/36, where a
= optimistic time, m = most likely time and b = pessimistic time.
Activity
Predecessors
Optimistic Time
Most Likely Time
Pessimistic Time
(Days)
(Days)
(Days)
A
—
2
6
10
B
A
2
5
8
C
A
6
7
8
D
B
3
9
21
E
C
7
9
11
F
D,E
8
11
20
G
C
1
4
7
1.
6
Draw an activity-on-node precedence network for the project and calculate the expected
earliest/latest start times and earliest/latest finish times for all activities.
Page 5 of 12
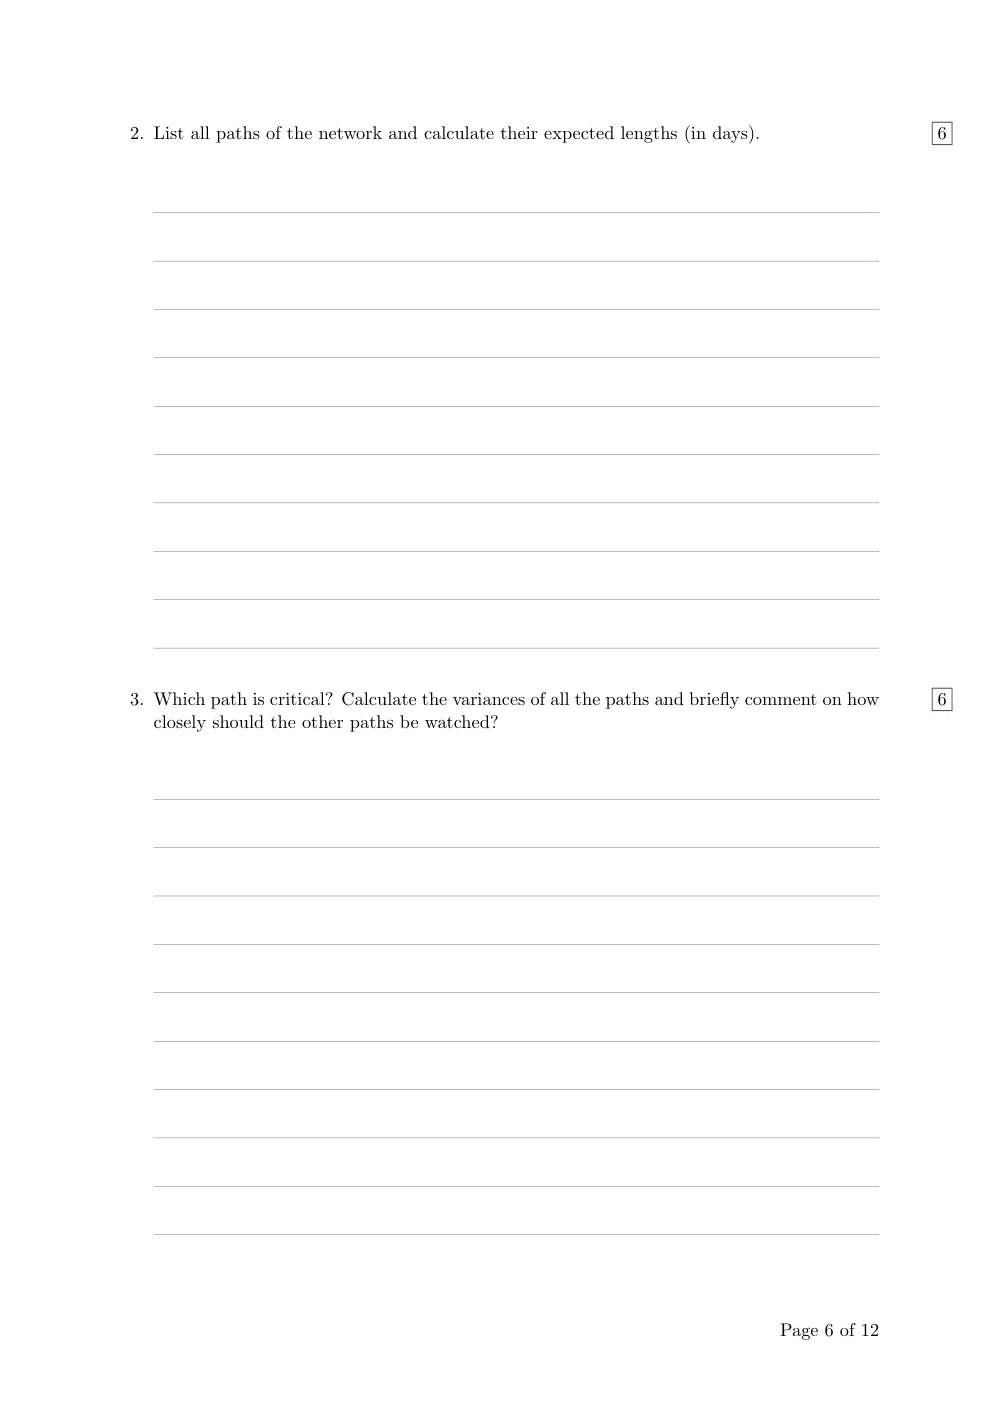
2.
6
List all paths of the network and calculate their expected lengths (in days).
3.
6
Which path is critical? Calculate the variances of all the paths and briefly comment on how
closely should the other paths be watched?
Page 6 of 12
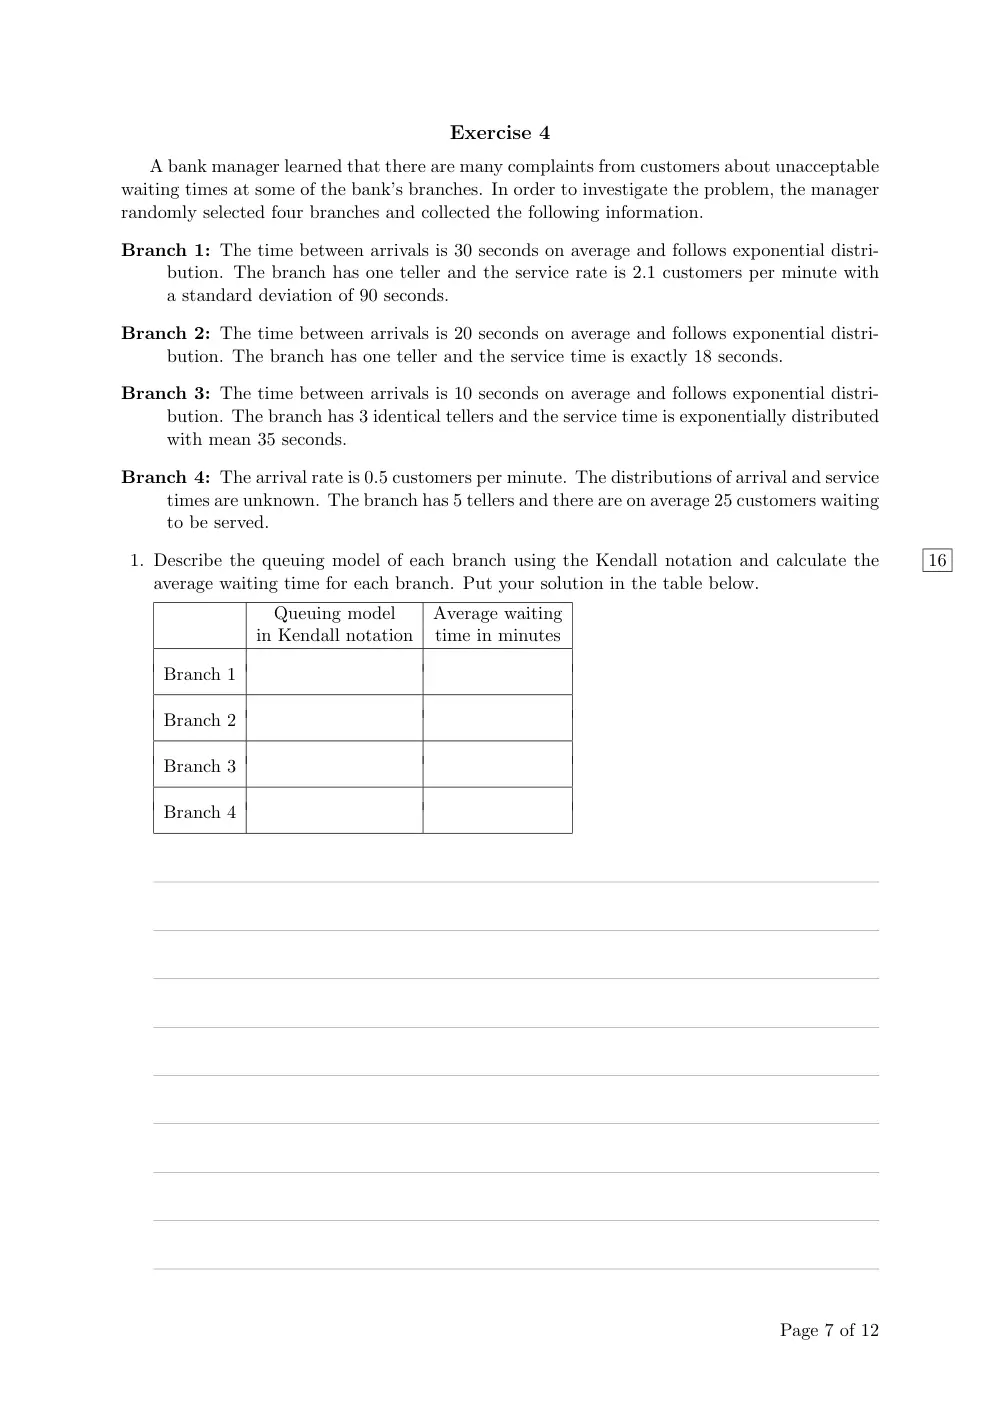
Exercise 4
A bank manager learned that there are many complaints from customers about unacceptable
waiting times at some of the bank’s branches. In order to investigate the problem, the manager
randomly selected four branches and collected the following information.
Branch 1: The time between arrivals is 30 seconds on average and follows exponential distri-
bution. The branch has one teller and the service rate is 2.1 customers per minute with
a standard deviation of 90 seconds.
Branch 2: The time between arrivals is 20 seconds on average and follows exponential distri-
bution. The branch has one teller and the service time is exactly 18 seconds.
Branch 3: The time between arrivals is 10 seconds on average and follows exponential distri-
bution. The branch has 3 identical tellers and the service time is exponentially distributed
with mean 35 seconds.
Branch 4: The arrival rate is 0.5 customers per minute. The distributions of arrival and service
times are unknown. The branch has 5 tellers and there are on average 25 customers waiting
to be served.
1.
16
Describe the queuing model of each branch using the Kendall notation and calculate the
average waiting time for each branch. Put your solution in the table below.
Queuing model
Average waiting
in Kendall notation
time in minutes
Branch 1
Branch 2
Branch 3
Branch 4
Page 7 of 12
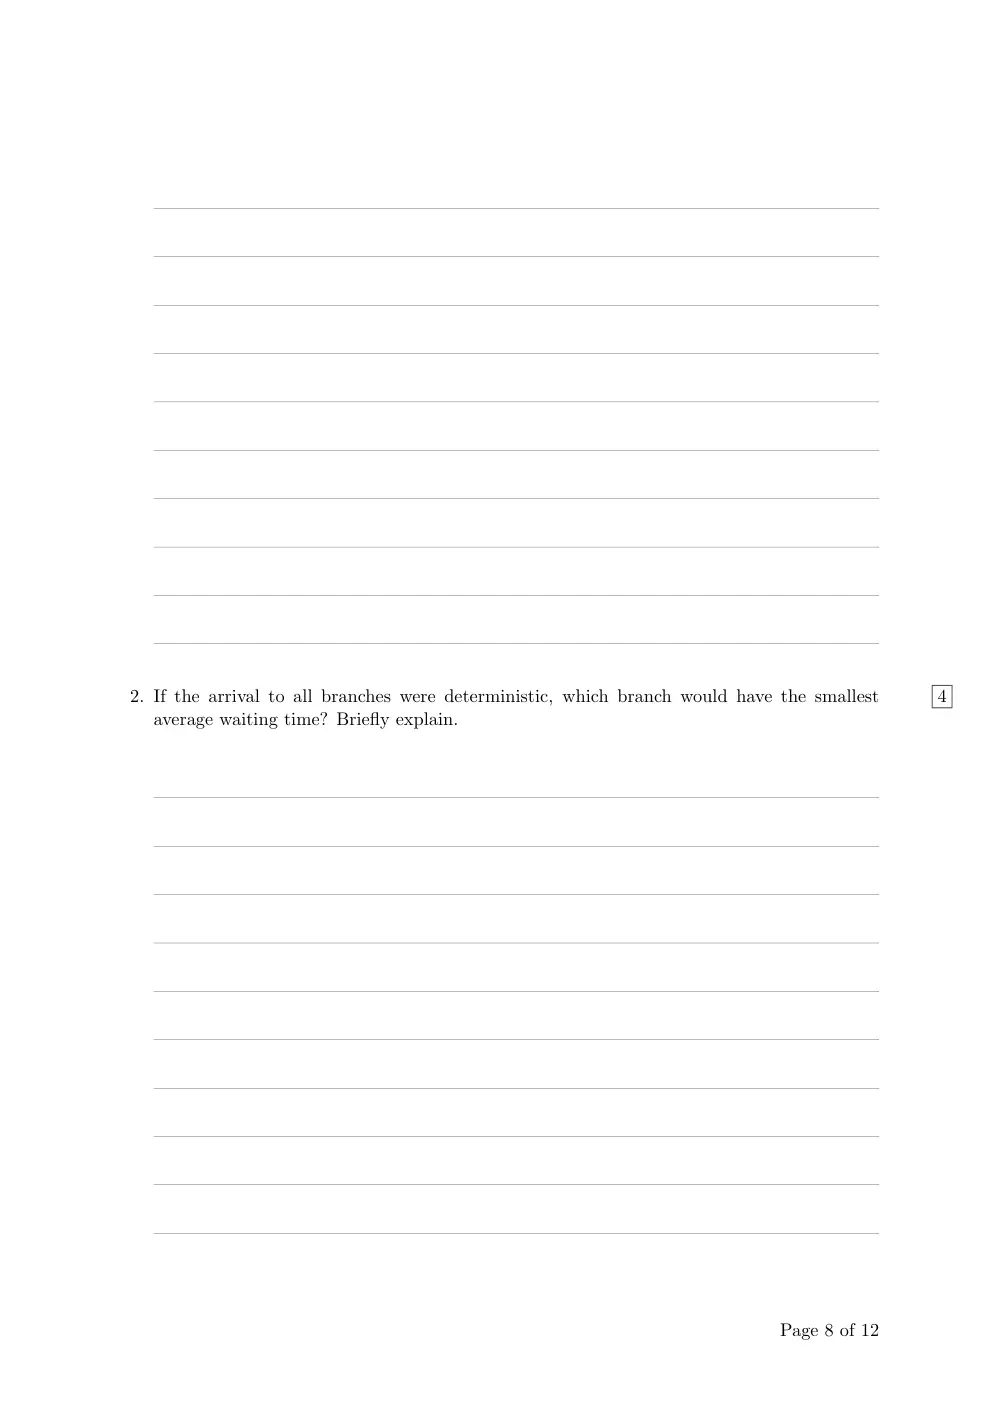
2.
4
If the arrival to all branches were deterministic, which branch would have the smallest
average waiting time? Briefly explain.
Page 8 of 12
Exercise 5
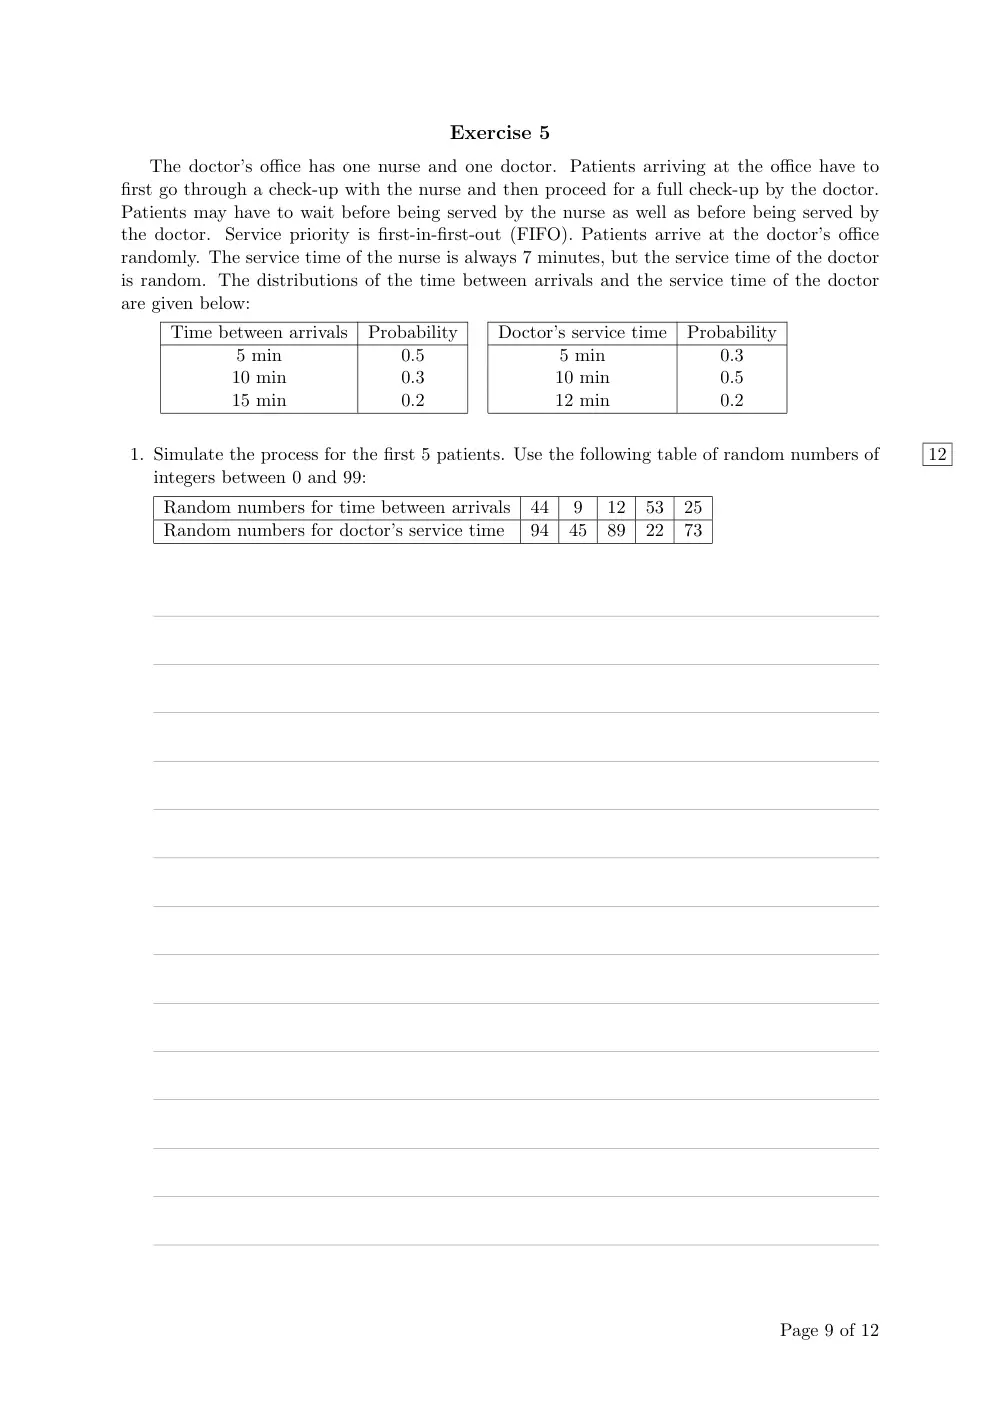
The doctor’s office has one nurse and one doctor. Patients arriving at the office have to
first go through a check-up with the nurse and then proceed for a full check-up by the doctor.
Patients may have to wait before being served by the nurse as well as before being served by
the doctor. Service priority is first-in-first-out (FIFO). Patients arrive at the doctor’s office
randomly. The service time of the nurse is always 7 minutes, but the service time of the doctor
is random. The distributions of the time between arrivals and the service time of the doctor
are given below:
Time between arrivals
Probability
Doctor’s service time
Probability
5 min
0.5
5 min
0.3
10 min
0.3
10 min
0.5
15 min
0.2
12 min
0.2
1.
12
Simulate the process for the first 5 patients. Use the following table of random numbers of
integers between 0 and 99:
Random numbers for time between arrivals
44
9
12
53
25
Random numbers for doctor’s service time
94
45
89
22
73
Page 9 of 12
2.
4
Based on your simulation, how much time are the patients spending in the doctor’s office
on average?
Page 10 of 12
Exercise 6
Recall the decision problem of COM-TECH from Chapter 15, in which COM-TECH was
considering submitting a proposal for a grant and choosing a technology upon receiving the
grant. The solution was to submit the proposal and to use infrared technology if the grant is
received. Note that it was still uncertain if the grant is received and if the R&D costs are high
or low. The expected payoff from this solution was $13,500. The decision tree for the problem
is shown below. (Note: values above events denote their probabilities; values below events and
below decisions denote payoffs; values next to nodes denote expected payoffs; values on the
right-hand side denote final payoffs; all payoffs are in dollars.)
0.6
High R&D Costs
16000
Microwave
-60000
16000
-4000
28000
0.4
Low R&D Costs
46000
-30000
46000
0.2
High R&D Costs
0.5
5000
Receive Grant
Cellular
-70000
5000
3
85000
32000
-5000
29000
0.8
Low R&D Costs
35000
-40000
35000
0.1
High R&D Costs
Submit Proposal
-4000
Infrared
-80000
-4000
-5000
13500
-4000
32000
0.9
Low R&D Costs
36000
-40000
36000
1
0.5
13500
Don't Receive Grant
-5000
0
-5000
Don't Submit Proposal
0
0
0
1.
10
Perform 5 simulation runs of the COM-TECH decision problem and calculate the average
payoff in dollars received by COM-TECH in your simulation.
In each simulation run,
generate two random events: one if the grant is received or not and the other if the R&D
costs are high or low. Use the following table of random numbers between 0 and 99:
Random numbers for receiving the grant or not
34
45
89
32
73
Random numbers for high or low R&D costs
4
9
32
73
25
Page 11 of 12
2.
4
Compare the average payoff from your simulation with the expected payoff from the decision
tree. Briefly explain the cause of the difference.
Page 12 of 12