
STAT 210 Final, Fall 2007
American University of Beirut · Elementary Statistics for the Sciences · 16 pages

Showing the first 10 of 16 pages. Download the PDF to see all of it.
More STAT 210 files
Show the text of this final exam
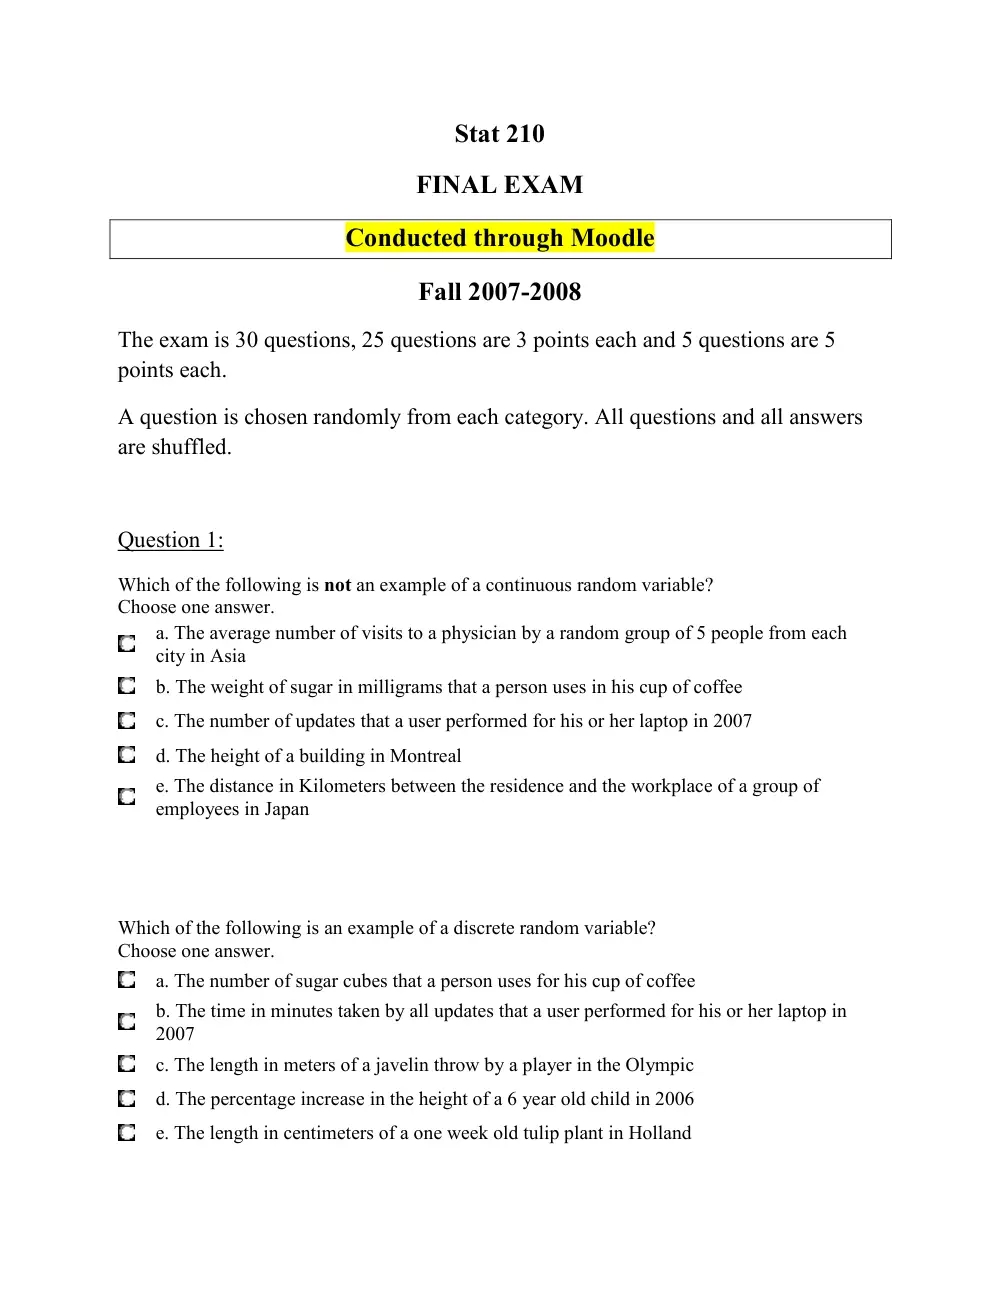
Stat 210
FINAL EXAM
Conducted through Moodle
Fall 2007-2008
The exam is 30 questions, 25 questions are 3 points each and 5 questions are 5
points each.
A question is chosen randomly from each category. All questions and all answers
are shuffled.
Question 1:
Which of the following is not an example of a continuous random variable?
Choose one answer.
a. The average number of visits to a physician by a random group of 5 people from each
city in Asia
b. The weight of sugar in milligrams that a person uses in his cup of coffee
c. The number of updates that a user performed for his or her laptop in 2007
d. The height of a building in Montreal
e. The distance in Kilometers between the residence and the workplace of a group of
employees in Japan
Which of the following is an example of a discrete random variable?
Choose one answer.
a. The number of sugar cubes that a person uses for his cup of coffee
b. The time in minutes taken by all updates that a user performed for his or her laptop in
2007
c. The length in meters of a javelin throw by a player in the Olympic
d. The percentage increase in the height of a 6 year old child in 2006
e. The length in centimeters of a one week old tulip plant in Holland
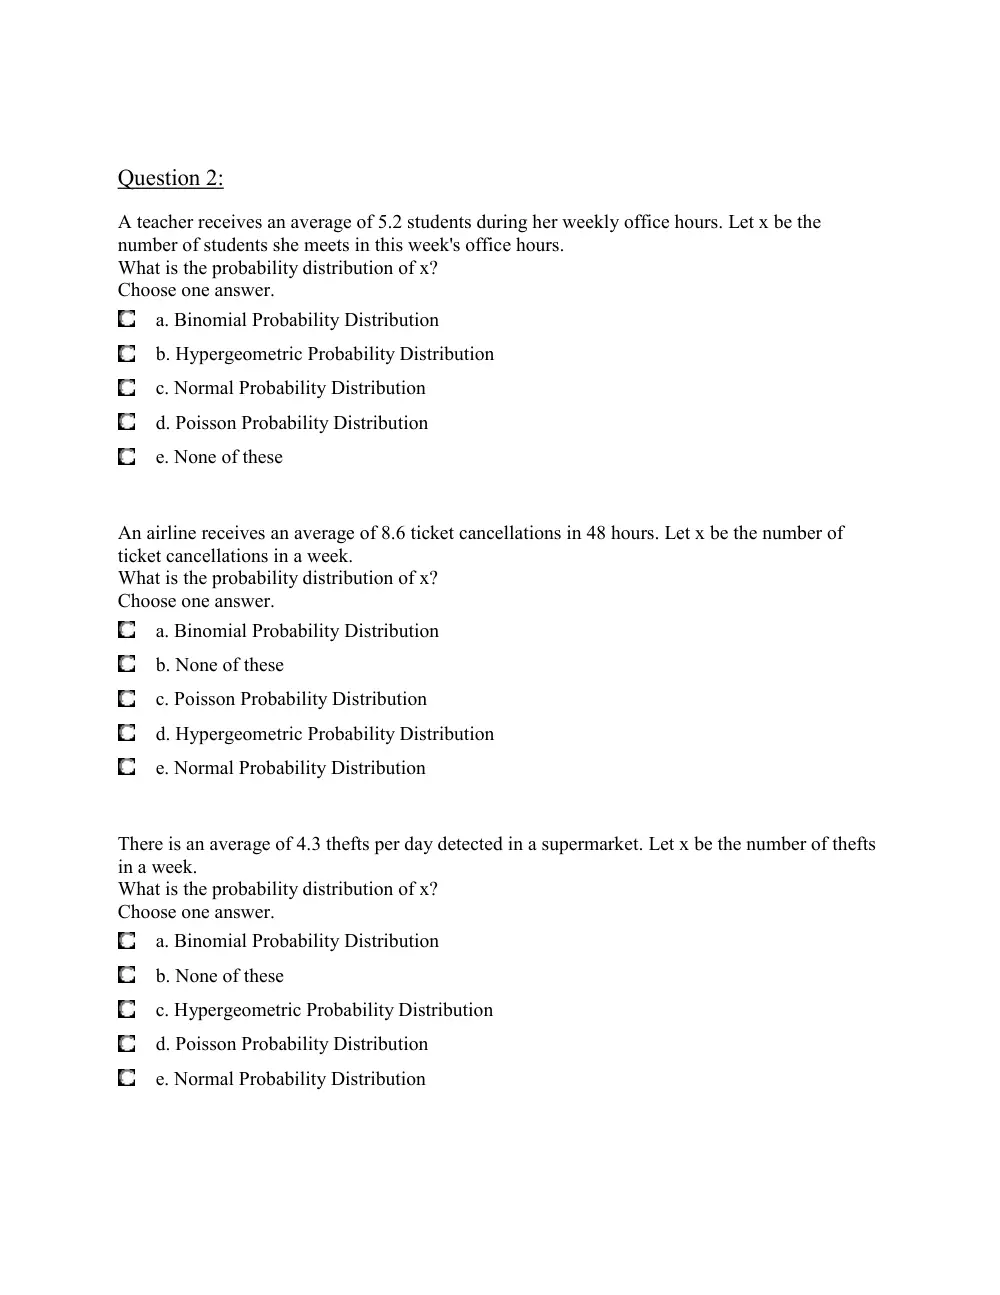
Question 2:
A teacher receives an average of 5.2 students during her weekly office hours. Let x be the
number of students she meets in this week's office hours.
What is the probability distribution of x?
Choose one answer.
a. Binomial Probability Distribution
b. Hypergeometric Probability Distribution
c. Normal Probability Distribution
d. Poisson Probability Distribution
e. None of these
An airline receives an average of 8.6 ticket cancellations in 48 hours. Let x be the number of
ticket cancellations in a week.
What is the probability distribution of x?
Choose one answer.
a. Binomial Probability Distribution
b. None of these
c. Poisson Probability Distribution
d. Hypergeometric Probability Distribution
e. Normal Probability Distribution
There is an average of 4.3 thefts per day detected in a supermarket. Let x be the number of thefts
in a week.
What is the probability distribution of x?
Choose one answer.
a. Binomial Probability Distribution
b. None of these
c. Hypergeometric Probability Distribution
d. Poisson Probability Distribution
e. Normal Probability Distribution
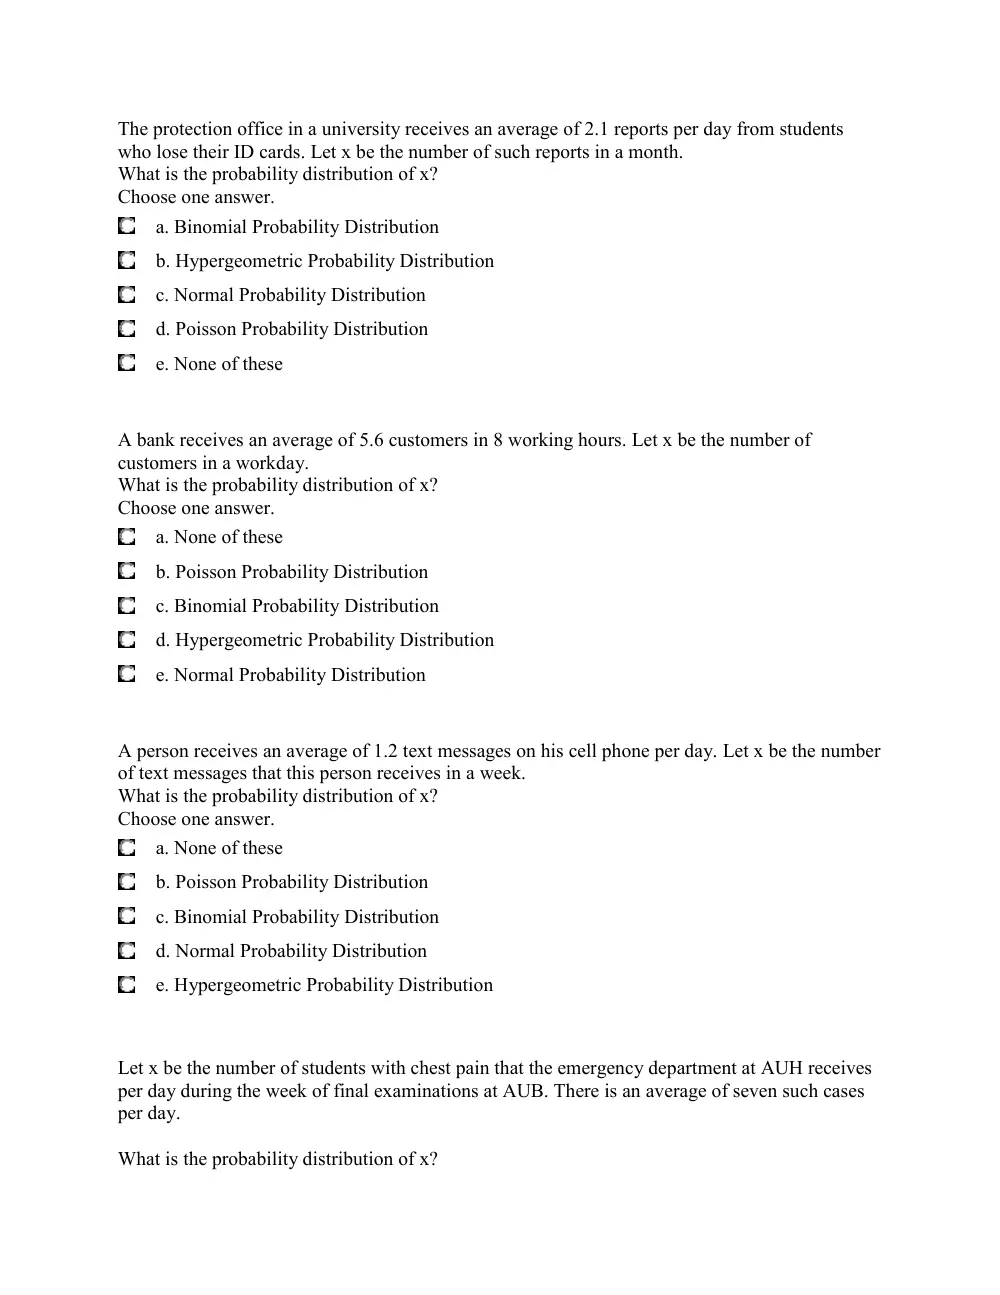
The protection office in a university receives an average of 2.1 reports per day from students
who lose their ID cards. Let x be the number of such reports in a month.
What is the probability distribution of x?
Choose one answer.
a. Binomial Probability Distribution
b. Hypergeometric Probability Distribution
c. Normal Probability Distribution
d. Poisson Probability Distribution
e. None of these
A bank receives an average of 5.6 customers in 8 working hours. Let x be the number of
customers in a workday.
What is the probability distribution of x?
Choose one answer.
a. None of these
b. Poisson Probability Distribution
c. Binomial Probability Distribution
d. Hypergeometric Probability Distribution
e. Normal Probability Distribution
A person receives an average of 1.2 text messages on his cell phone per day. Let x be the number
of text messages that this person receives in a week.
What is the probability distribution of x?
Choose one answer.
a. None of these
b. Poisson Probability Distribution
c. Binomial Probability Distribution
d. Normal Probability Distribution
e. Hypergeometric Probability Distribution
Let x be the number of students with chest pain that the emergency department at AUH receives
per day during the week of final examinations at AUB. There is an average of seven such cases
per day.
What is the probability distribution of x?
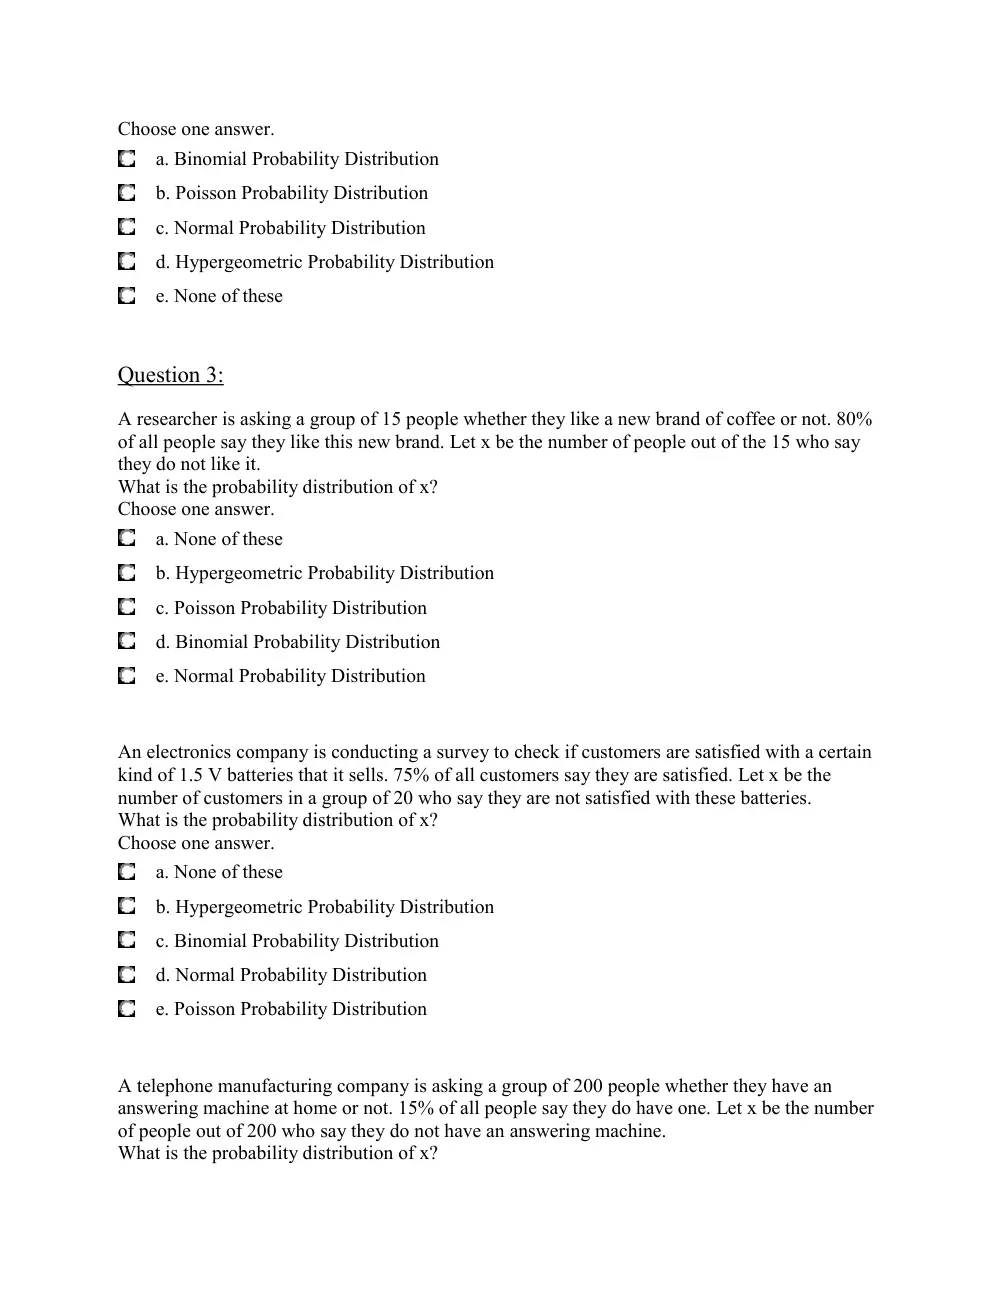
Choose one answer.
a. Binomial Probability Distribution
b. Poisson Probability Distribution
c. Normal Probability Distribution
d. Hypergeometric Probability Distribution
e. None of these
Question 3:
A researcher is asking a group of 15 people whether they like a new brand of coffee or not. 80%
of all people say they like this new brand. Let x be the number of people out of the 15 who say
they do not like it.
What is the probability distribution of x?
Choose one answer.
a. None of these
b. Hypergeometric Probability Distribution
c. Poisson Probability Distribution
d. Binomial Probability Distribution
e. Normal Probability Distribution
An electronics company is conducting a survey to check if customers are satisfied with a certain
kind of 1.5 V batteries that it sells. 75% of all customers say they are satisfied. Let x be the
number of customers in a group of 20 who say they are not satisfied with these batteries.
What is the probability distribution of x?
Choose one answer.
a. None of these
b. Hypergeometric Probability Distribution
c. Binomial Probability Distribution
d. Normal Probability Distribution
e. Poisson Probability Distribution
A telephone manufacturing company is asking a group of 200 people whether they have an
answering machine at home or not. 15% of all people say they do have one. Let x be the number
of people out of 200 who say they do not have an answering machine.
What is the probability distribution of x?
Choose one answer.
a. None of these
b. Binomial Probability Distribution
c. Normal Probability Distribution
d. Poisson Probability Distribution
e. Hypergeometric Probability Distribution
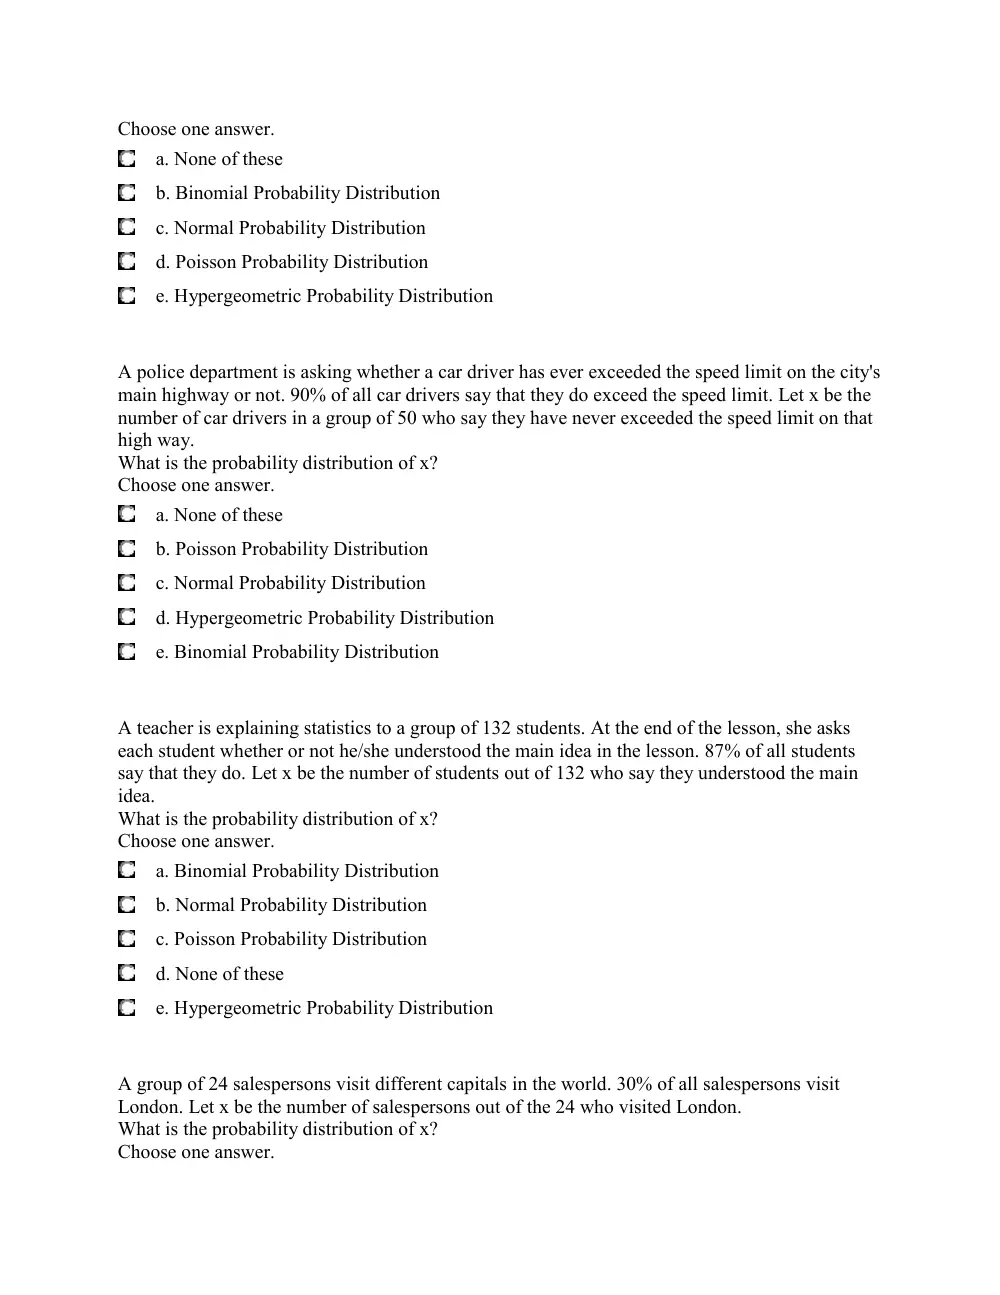
A police department is asking whether a car driver has ever exceeded the speed limit on the city's
main highway or not. 90% of all car drivers say that they do exceed the speed limit. Let x be the
number of car drivers in a group of 50 who say they have never exceeded the speed limit on that
high way.
What is the probability distribution of x?
Choose one answer.
a. None of these
b. Poisson Probability Distribution
c. Normal Probability Distribution
d. Hypergeometric Probability Distribution
e. Binomial Probability Distribution
A teacher is explaining statistics to a group of 132 students. At the end of the lesson, she asks
each student whether or not he/she understood the main idea in the lesson. 87% of all students
say that they do. Let x be the number of students out of 132 who say they understood the main
idea.
What is the probability distribution of x?
Choose one answer.
a. Binomial Probability Distribution
b. Normal Probability Distribution
c. Poisson Probability Distribution
d. None of these
e. Hypergeometric Probability Distribution
A group of 24 salespersons visit different capitals in the world. 30% of all salespersons visit
London. Let x be the number of salespersons out of the 24 who visited London.
What is the probability distribution of x?
Choose one answer.
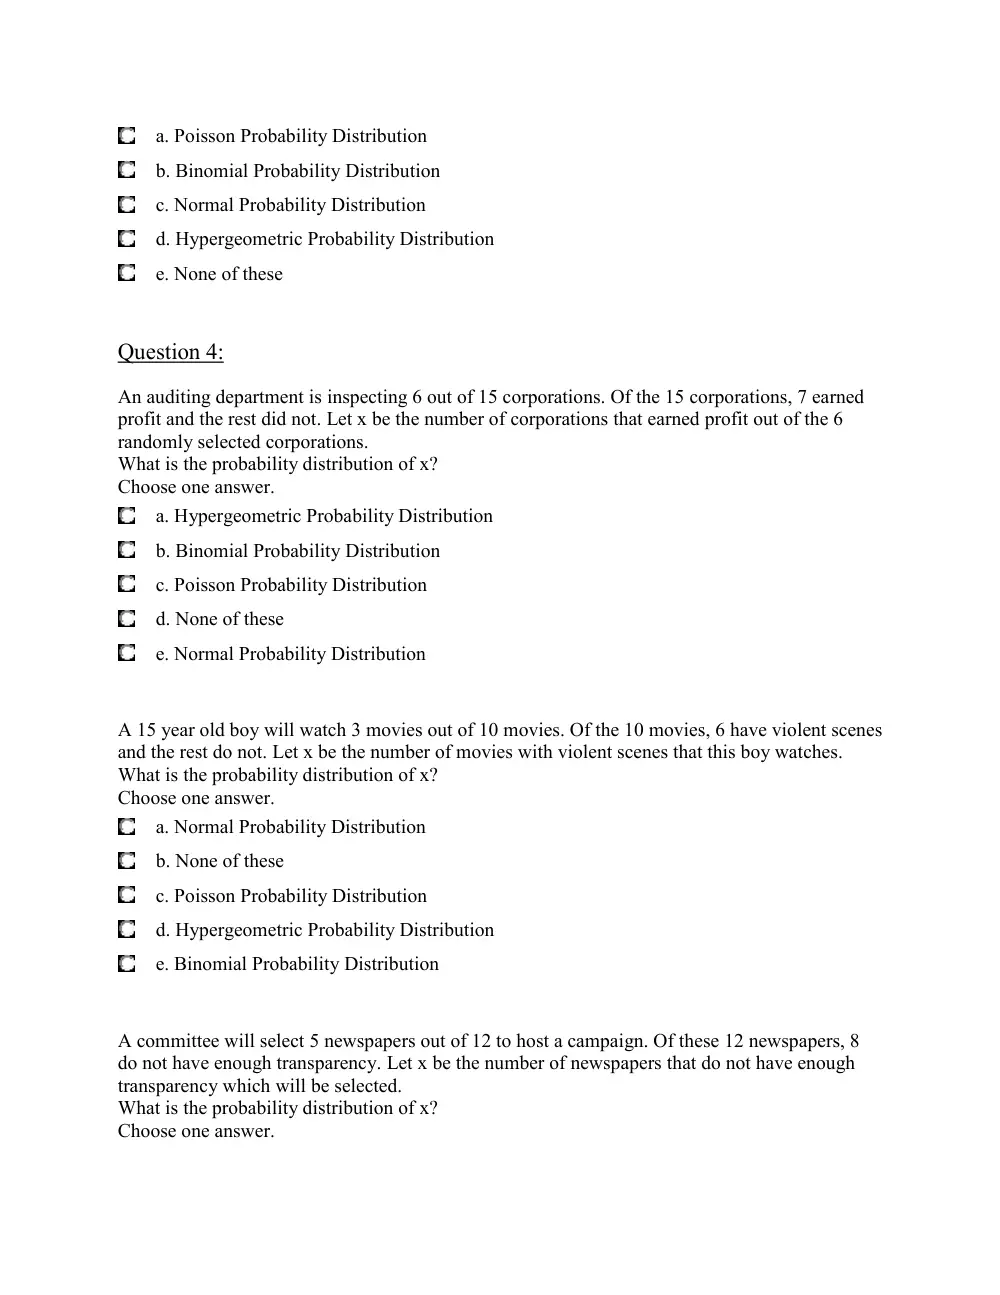
a. Poisson Probability Distribution
b. Binomial Probability Distribution
c. Normal Probability Distribution
d. Hypergeometric Probability Distribution
e. None of these
Question 4:
An auditing department is inspecting 6 out of 15 corporations. Of the 15 corporations, 7 earned
profit and the rest did not. Let x be the number of corporations that earned profit out of the 6
randomly selected corporations.
What is the probability distribution of x?
Choose one answer.
a. Hypergeometric Probability Distribution
b. Binomial Probability Distribution
c. Poisson Probability Distribution
d. None of these
e. Normal Probability Distribution
A 15 year old boy will watch 3 movies out of 10 movies. Of the 10 movies, 6 have violent scenes
and the rest do not. Let x be the number of movies with violent scenes that this boy watches.
What is the probability distribution of x?
Choose one answer.
a. Normal Probability Distribution
b. None of these
c. Poisson Probability Distribution
d. Hypergeometric Probability Distribution
e. Binomial Probability Distribution
A committee will select 5 newspapers out of 12 to host a campaign. Of these 12 newspapers, 8
do not have enough transparency. Let x be the number of newspapers that do not have enough
transparency which will be selected.
What is the probability distribution of x?
Choose one answer.
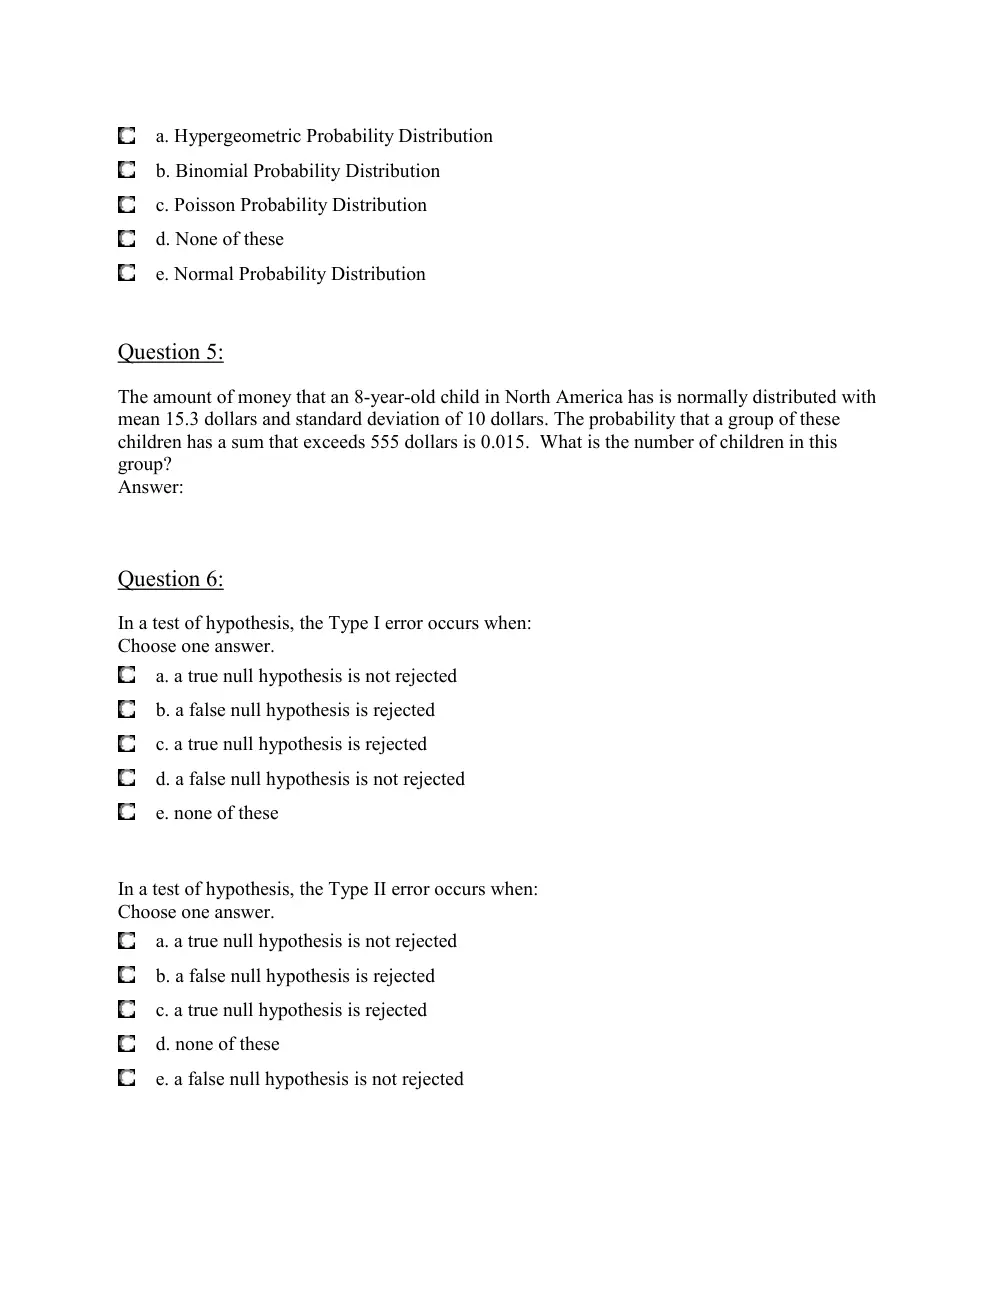
a. Hypergeometric Probability Distribution
b. Binomial Probability Distribution
c. Poisson Probability Distribution
d. None of these
e. Normal Probability Distribution
Question 5:
The amount of money that an 8-year-old child in North America has is normally distributed with
mean 15.3 dollars and standard deviation of 10 dollars. The probability that a group of these
children has a sum that exceeds 555 dollars is 0.015. What is the number of children in this
group?
Answer:
Question 6:
In a test of hypothesis, the Type I error occurs when:
Choose one answer.
a. a true null hypothesis is not rejected
b. a false null hypothesis is rejected
c. a true null hypothesis is rejected
d. a false null hypothesis is not rejected
e. none of these
In a test of hypothesis, the Type II error occurs when:
Choose one answer.
a. a true null hypothesis is not rejected
b. a false null hypothesis is rejected
c. a true null hypothesis is rejected
d. none of these
e. a false null hypothesis is not rejected
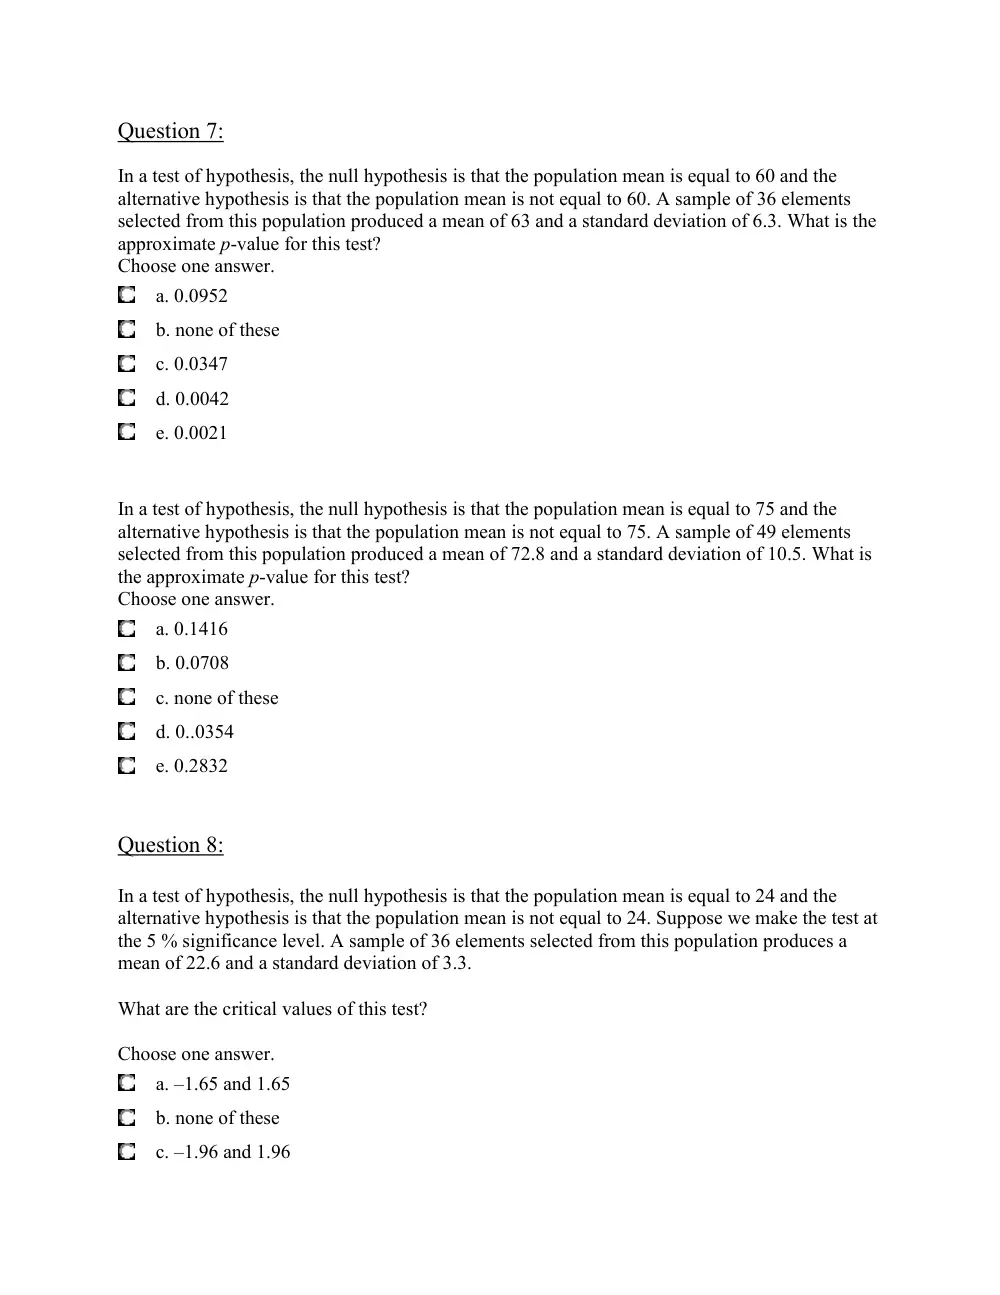
Question 7:
In a test of hypothesis, the null hypothesis is that the population mean is equal to 60 and the
alternative hypothesis is that the population mean is not equal to 60. A sample of 36 elements
selected from this population produced a mean of 63 and a standard deviation of 6.3. What is the
approximate p-value for this test?
Choose one answer.
a. 0.0952
b. none of these
c. 0.0347
d. 0.0042
e. 0.0021
In a test of hypothesis, the null hypothesis is that the population mean is equal to 75 and the
alternative hypothesis is that the population mean is not equal to 75. A sample of 49 elements
selected from this population produced a mean of 72.8 and a standard deviation of 10.5. What is
the approximate p-value for this test?
Choose one answer.
a. 0.1416
b. 0.0708
c. none of these
d. 0..0354
e. 0.2832
Question 8:
In a test of hypothesis, the null hypothesis is that the population mean is equal to 24 and the
alternative hypothesis is that the population mean is not equal to 24. Suppose we make the test at
the 5 % significance level. A sample of 36 elements selected from this population produces a
mean of 22.6 and a standard deviation of 3.3.
What are the critical values of this test?
Choose one answer.
a. –1.65 and 1.65
b. none of these
c. –1.96 and 1.96
d. –2.17 and 2.17
e. –2.07 and 2.07
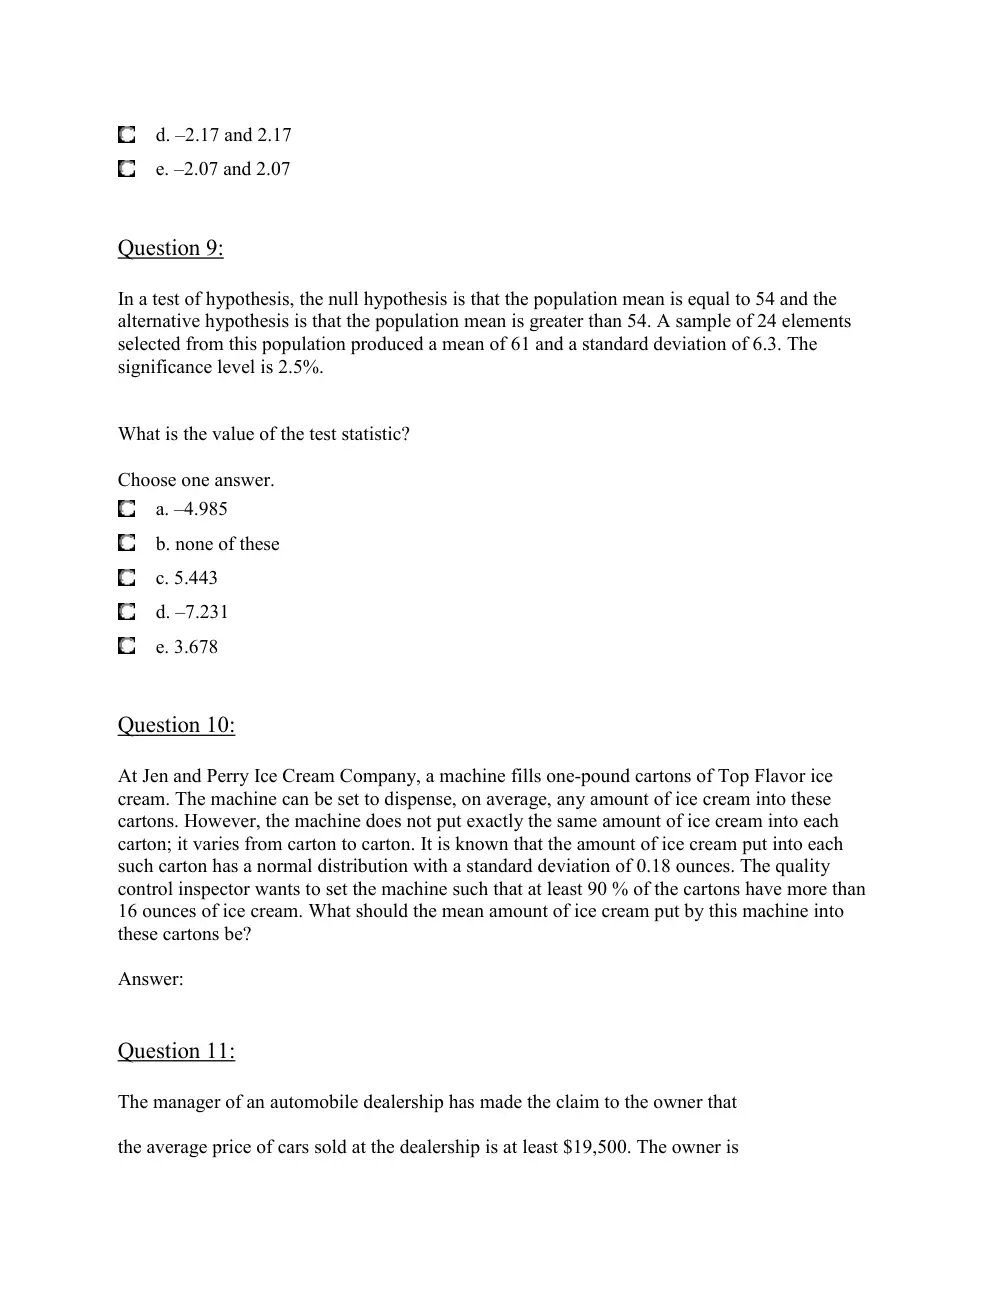
Question 9:
In a test of hypothesis, the null hypothesis is that the population mean is equal to 54 and the
alternative hypothesis is that the population mean is greater than 54. A sample of 24 elements
selected from this population produced a mean of 61 and a standard deviation of 6.3. The
significance level is 2.5%.
What is the value of the test statistic?
Choose one answer.
a. –4.985
b. none of these
c. 5.443
d. –7.231
e. 3.678
Question 10:
At Jen and Perry Ice Cream Company, a machine fills one-pound cartons of Top Flavor ice
cream. The machine can be set to dispense, on average, any amount of ice cream into these
cartons. However, the machine does not put exactly the same amount of ice cream into each
carton; it varies from carton to carton. It is known that the amount of ice cream put into each
such carton has a normal distribution with a standard deviation of 0.18 ounces. The quality
control inspector wants to set the machine such that at least 90 % of the cartons have more than
16 ounces of ice cream. What should the mean amount of ice cream put by this machine into
these cartons be?
Answer:
Question 11:
The manager of an automobile dealership has made the claim to the owner that
the average price of cars sold at the dealership is at least $19,500. The owner is
to test the claim by randomly selecting n files from the dealership sales records,
calculating the mean and standard deviation of the n files of sales records, and
conducting a hypothesis test at the 1% level of significance. If we have n = 25,
sample mean $18,700, and sample standard deviation $1,200.
Which of the following best describes the result?
Choose one answer.
a. We reject the null hypothesis
b. The test statistic is greater than the critical value
c. The test is two tailed
d. We do not reject the null hypothesis
e. none of these
Question 12:
The owner of a fast-food restaurant is looking at a hypothesis test performed by his friend, a
statistician. The purpose was to test the hypothesis that the restaurant sold, on average, nine
orders of chicken fingers each hour. The statistician had taken data over 54 hours of operation,
and had calculated a mean of 10.5 orders. He had determined that the p-value was .0228. The
statistician did not supply his friend with the standard deviation of the sample. What was the
standard deviation of the sample?
Answer:
Question 13:
The mean GPA (grade point average) of all male students at a college is 2.77 and the mean GPA
of all female students at the same college is 2.89. Suppose we take one sample of 40 male
students and another sample of 50 female students from this college. What is the mean of the
sampling distribution of the difference between the mean GPAs of these two samples?
Choose one answer.
a. –0.12
b. 0.27
c. 5.66
d. none of these
e. –0.08
Question 14:
A sample of 16 elements selected from a population produced a mean of 26 and a standard
deviation of 4. Another sample of 18 elements selected from another population produced a
mean of 36 and a standard deviation of 3. Assume that the two populations are normally
distributed and the standard deviations of the two populations are not equal.
What is the number of degrees of freedom of the t distribution to make a
confidence interval for the difference between the two population means?
Choose one answer.
a. 23
b. 32
c. none of these
d. 27
e. 34
Question 15:
A sample of 60 houses recently sold in a city
gave a mean price of $157,600 with a standard deviation of $17,500. Another
sample of 40 houses recently sold in another city gave a mean price of $143,350
with a standard deviation of $14,700. Testing at the 5% significance level if the mean
prices of houses in these two cities are different.The test statistic is approximately
.
Finally the null hypothesis is:
Question 16:
A sample of 12 elements selected from a population produced a mean of 84 and a standard
deviation of 16. Another sample of 15 elements selected from another population produced a
mean of 72 and a standard deviation of 14. Assume that the two populations are normally
distributed and the standard deviations of the two populations are not equal. What is the 99%
confidence interval for the difference between the two population means?
Choose one answer.
a. –4.53 to 28.53
b. none of these
c. 1.36 to 16.64
d. –2.28 to 20.28
e. 5.29 to 12.71
Question 17:
A high school history teacher gives a 50-question multiple choice examination in which each
question has four choices. The scoring includes a penalty for guessing. Each correct answer is
worth 1 point, and each wrong answer costs 0.5 point. For example, if a student answers 35
questions correctly, 8 questions incorrectly, and does not answer 7 questions then the total score
for this student will be 35-(0.5)(8)=31. What is the expected score of a student who answers 32
questions correctly and guesses on the other 18 questions?
Answer:
A high school history teacher gives a 50-question multiple choice examination in which each
question has four choices. The scoring includes a penalty for guessing. Each correct answer is
worth 1 point, and each wrong answer costs 0.5 point. For example, if a student answers 35
questions correctly, 8 questions incorrectly, and does not answer 7 questions then the total score
for this student will be 35-(0.5)(8)=31. What is the expected score of a student who answers 42
questions correctly and guesses on the other 8 questions?
Answer:
A high school history teacher gives a 50-question multiple choice examination in which each
question has four choices. The scoring includes a penalty for guessing. Each correct answer is
worth 1 point, and each wrong answer costs 0.5 point. For example, if a student answers 35
questions correctly, 8 questions incorrectly, and does not answer 7 questions then the total score
for this student will be 35-(0.5)(8)=31. What is the expected score of a student who answers 36
questions correctly and guesses on the other 14 questions? Answer:
Question 18:
In a test of hypothesis, the probability of committing a Type I error is called the:
Choose one answer.
a. beta error
b. confidence interval
c. significance level
d. none of these
e. confidence level
Question 19:
A researcher wants to test if elementary school children spend less than 35 minutes per day on
homework. The null hypothesis for this example will be that the population mean is:
Choose one answer.
a. none of these
b. not equal to 35 minutes
c. equal to 35 minutes
d. less than or equal to 35 minutes
e. less than 35 minutes
Question 20:
The p-value for a two tailed test of hypothesis is 0.1142.The null hypothesis is that the
population mean is 25.78. What is the mean of the sample used in this test if there are 36
observations in the sample and their standard deviation is 54?
Answer:
Question 21:
The number of times that a student at AUB enters Jafet library in a week was found to follow a
Poisson distribution. If the probability that a student goes to Jafet at least once in a week is
0.9817. On average, how many times does an AUB student visit Jafet in a week?
Answer:
Question 22:
The amount of time taken by a bank teller to serve a randomly selected customer has a normal
distribution with a mean of 2 minutes and a standard deviation of 0.5 minutes. What is the
probability that both of two randomly selected customers will take less than one minute each to
be served?
Choose one answer.
a. 0.0005
b. 0.5028
c. 0.0028
d. 0.2528
e. none of these
Question 23:
A population consists of 1000 elements. The standard deviation of the sampling distribution of
the mean of a sample with size 40 is less than twice that of a sample with size 36 by 2.2. What is
the standard deviation of the population approximately?
Answer:
Question 24:
A department store manager wants to estimate at a 90% confidence level the mean amount spent
by all customers at this store. The manager knows that the standard deviation of amounts spent
by all customers at this store is 31 dollars. What sample size should he choose so that the
estimate is within 3 dollars of the population mean? Answer:
Question 25:
The confidence interval for a population mean based on a sample of size 16 is [520.9, 655]. The
population standard deviation is 400. What is the confidence level used?
Choose one answer.
a. none of these
b. 98 %
c. 90 %
d. 95 %
e. 99 %
Question 26:
Which of the following conditions is not required to use the t distribution to make a test of
hypothesis about the population mean?
Choose one answer.
a. none of these
b. The sample size is less than 30
c. The population standard deviation is unknown
d. The population from which the sample is drawn is (approximately) normally distributed
e. The population from which the sample is drawn has a t distribution
Question 27:
A city is planning to build a hydroelectric power plant. A local newspaper found that 54% of the
voters in this city favor the construction of this plant. Assume that this result holds true for the
population of all voters in this city. A politician would like to take a random sample of voters in
which more than 50 % would favor the plant construction. How large a sample should be
selected so that the politician is 95% sure of this outcome?
Answer:
Question 28:
The mean of the sampling distribution of the sample proportion is equal to the population
proportion p, so:
Choose one answer.
a. The average of the sample proportions of any number of different samples is always
equal to p
b. We will never have a sample proportion equal to p but the average of all sample
proportions is p
c. Any sample has a proportion equal to p
d. The expected value of the sample proportion is p
e. A sample proportion can never be greater than p
Question 29:
The alternative hypothesis is a claim about a:
Choose one answer.
a. population parameter that will be true if the null hypothesis is false
b. sample statistic that will be true if the null hypothesis is false
c. none of these
d. sample statistic that is assumed to be false until it is declared true
e. population parameter that is assumed to be true until it is declared false
Question 30:
If the p-value is less than the significance level in a hypothesis test then:
Choose one answer.
a. We reject the alternative hypothesis
b. We reject the null hypothesis
c. We accept the alternative hypothesis
d. We do not reject the null hypothesis and we accept the alternative hypothesis
e. We do not reject the null hypothesis