
STAT 210 Lecture Chapter 2, Fall 2015
American University of Beirut · Elementary Statistics for the Sciences · 32 pages


Showing the first 10 of 32 pages. Download the PDF to see all of it.
More STAT 210 files
Show the text of this lab
CHAPTER 2
ORGANIZING AND GRAPHING
DATA
Prem Mann, Introductory Statistics, 8/E
Copyright © 2013 John Wiley & Sons. All rights reserved.
RAW DATA
Definition
Data recorded in the sequence in which they are collected and before
they are processed or ranked are called raw data.
ORGANIZING AND GRAPHING DATA:
•
Frequency Distributions
•
Relative Frequency and Percentage Distributions
•
Graphical Presentation of Qualitative Data
Prem Mann, Introductory Statistics, 8/E
Copyright © 2013 John Wiley & Sons. All rights reserved.
Table 2.3 Types of Employment Students Intend to
Engage In
Prem Mann, Introductory Statistics, 8/E
Copyright © 2013 John Wiley & Sons. All rights reserved.
Frequency Distributions
Definition
A frequency distribution of a qualitative variable lists all categories and the
number of elements that belong to each of the categories.
Prem Mann, Introductory Statistics, 8/E
Copyright © 2013 John Wiley & Sons. All rights reserved.
Relative Frequency and Percentage Distributions
Calculating Relative Frequency of a Category
of all frequencies
Sum
Frequency of that category
Re lative frequency of a category
Prem Mann, Introductory Statistics, 8/E
Copyright © 2013 John Wiley & Sons. All rights reserved.
Calculating Percentage
Percentage = (Relative frequency) · 100%
Graphical Presentation of Qualitative Data
Definition
A graph made of bars whose heights represent the frequencies of
respective categories is called a bar graph.
Prem Mann, Introductory Statistics, 8/E
Copyright © 2013 John Wiley & Sons. All rights reserved.
ORGANIZING AND GRAPHING QUANTITATIVE
•
Frequency Distributions
•
Constructing Frequency Distribution Tables
•
Relative and Percentage Distributions
•
Graphing Grouped Data
Prem Mann, Introductory Statistics, 8/E
Copyright © 2013 John Wiley & Sons. All rights reserved.
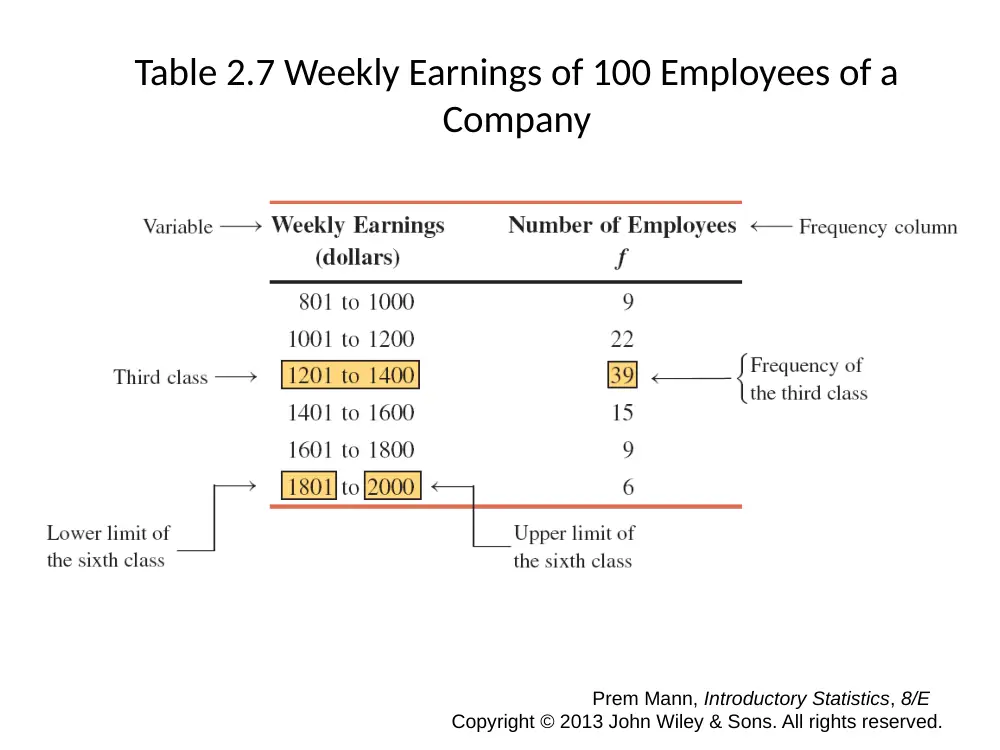
Table 2.7 Weekly Earnings of 100 Employees of a
Company
Prem Mann, Introductory Statistics, 8/E
Copyright © 2013 John Wiley & Sons. All rights reserved.
Frequency Distributions
Definition
A frequency distribution for quantitative data lists all the classes and the
number of values that belong to each class. Data presented in the form of a
frequency distribution are called grouped data.
Prem Mann, Introductory Statistics, 8/E
Copyright © 2013 John Wiley & Sons. All rights reserved.
Frequency Distributions
Definition
The class boundary is given by the midpoint of the upper limit of one
class and the lower limit of the next class.
Finding Class Width
Class width = Upper boundary – Lower boundary
Prem Mann, Introductory Statistics, 8/E
Copyright © 2013 John Wiley & Sons. All rights reserved.
Frequency Distributions
Calculating Class Midpoint or Mark
2
Lower limit Upper limit
Class midpoint or mark
Prem Mann, Introductory Statistics, 8/E
Copyright © 2013 John Wiley & Sons. All rights reserved.
Table 2.8 Class Boundaries, Class Widths, and Class
Midpoints for Table 2.7
Prem Mann, Introductory Statistics, 8/E
Copyright © 2013 John Wiley & Sons. All rights reserved.
Graphing Grouped Data
Definition
A histogram is a graph in which classes are marked on the horizontal axis and
the frequencies, relative frequencies, or percentages are marked on the
vertical axis. The frequencies, relative frequencies, or percentages are
represented by the heights of the bars. In a histogram, the bars are drawn
adjacent to each other.
Prem Mann, Introductory Statistics, 8/E
Copyright © 2013 John Wiley & Sons. All rights reserved.
Table 2.9 Frequency Distribution for the Data on iPods
Sold
Prem Mann, Introductory Statistics, 8/E
Copyright © 2013 John Wiley & Sons. All rights reserved.
Figure 2.3 Frequency histogram for Table 2.9.
Prem Mann, Introductory Statistics, 8/E
Copyright © 2013 John Wiley & Sons. All rights reserved.
Graphing Grouped Data
Definition
A graph formed by joining the midpoints of the tops of successive bars in a
histogram with straight lines is called a polygon.
Prem Mann, Introductory Statistics, 8/E
Copyright © 2013 John Wiley & Sons. All rights reserved.
Figure 2.5 Frequency polygon for Table 2.9.
Prem Mann, Introductory Statistics, 8/E
Copyright © 2013 John Wiley & Sons. All rights reserved.
Example 2-6
The administration in a large city wanted to know the distribution of vehicles
owned by households in that city. A sample of 40 randomly selected
households from this city produced the following data on the number of
vehicles owned:
5 1 1 2 0 1 1 2 1 1
1 3 3 0 2 5 1 2 3 4
2 1 2 2 1 2 2 1 1 1
4 2 1 1 2 1 1 4 1 3
Construct a frequency distribution table for these data using single-valued
classes.
Prem Mann, Introductory Statistics, 8/E
Copyright © 2013 John Wiley & Sons. All rights reserved.
Example 2-6: Solution
Table 2.13 Frequency Distribution of Vehicles Owned
The observations assume only
six distinct values: 0, 1, 2, 3, 4,
and 5. Each of these six values
is used as a class in the
frequency distribution in Table
2.13.
Prem Mann, Introductory Statistics, 8/E
Copyright © 2013 John Wiley & Sons. All rights reserved.
Figure 2.7 Bar graph for Table 2.13.
Prem Mann, Introductory Statistics, 8/E
Copyright © 2013 John Wiley & Sons. All rights reserved.
SHAPES OF HISTOGRAMS
1.
Symmetric
2.
Skewed
3.
Uniform or Rectangular
Prem Mann, Introductory Statistics, 8/E
Copyright © 2013 John Wiley & Sons. All rights reserved.
Figure 2.8 Symmetric histograms.
Prem Mann, Introductory Statistics, 8/E
Copyright © 2013 John Wiley & Sons. All rights reserved.
Figure 2.9 (a) A histogram skewed to the right. (b) A
histogram skewed to the left.
Prem Mann, Introductory Statistics, 8/E
Copyright © 2013 John Wiley & Sons. All rights reserved.
Figure 2.10 A histogram with uniform distribution.
Prem Mann, Introductory Statistics, 8/E
Copyright © 2013 John Wiley & Sons. All rights reserved.
CUMULATIVE FREQUENCY DISTRIBUTIONS
Definition
A cumulative frequency distribution gives the total number of values that fall
below the upper boundary of each class.
Prem Mann, Introductory Statistics, 8/E
Copyright © 2013 John Wiley & Sons. All rights reserved.
Example 2-7: Solution
Table 2.14 Cumulative Frequency Distribution of iPods
Sold
Prem Mann, Introductory Statistics, 8/E
Copyright © 2013 John Wiley & Sons. All rights reserved.
CUMULATIVE FREQUENCY DISTRIBUTIONS
Calculating Cumulative Relative Frequency and Cumulative Percentage
percentage (Cumulativ e relative frequency) 100
Cumulative
observations in the data set
Total
Cumulative frequency of a class
relative frequency
Cumulative
Prem Mann, Introductory Statistics, 8/E
Copyright © 2013 John Wiley & Sons. All rights reserved.
Figure 2.12 Ogive for the cumulative frequency
distribution of Table 2.14.
Prem Mann, Introductory Statistics, 8/E
Copyright © 2013 John Wiley & Sons. All rights reserved.
STEM-AND-LEAF DISPLAYS
Definition
In a stem-and-leaf display of quantitative data, each value is divided into two
portions – a stem and a leaf. The leaves for each stem are shown separately in
a display.
Prem Mann, Introductory Statistics, 8/E
Copyright © 2013 John Wiley & Sons. All rights reserved.
Example 2-8
The following are the scores of 30 college students on a statistics test:
Construct a stem-and-leaf display.
75
69
83
52
72
84
80
81
77
96
61
64
65
76
71
79
86
87
71
79
72
87
68
92
93
50
57
95
92
98
Prem Mann, Introductory Statistics, 8/E
Copyright © 2013 John Wiley & Sons. All rights reserved.
Figure 2.13 Stem-and-leaf display.
Prem Mann, Introductory Statistics, 8/E
Copyright © 2013 John Wiley & Sons. All rights reserved.
Figure 2.14 Stem-and-leaf display of test scores.
Prem Mann, Introductory Statistics, 8/E
Copyright © 2013 John Wiley & Sons. All rights reserved.