
BUSS 230 Midterm Notes, Spring 2013
American University of Beirut · Managerial Economics · 8 pages




More BUSS 230 files
- Midterm · Fall 2013ExamView
- Midterm Solution · Fall 2013Exam · with solutionView
- Homework Assignment 2 Solution · Spring 2012Homework · with solutionView
- Homework Solution · Spring 2012Homework · with solutionView
- Midterm Review Questions · Fall 2011ExamView
- Homework 1 · Fall 2011HomeworkView
- Syllabus · Fall 2011LabView
- Homework 1 · Fall 2011HomeworkView
Show the text of this notes
Sarah Kaakati
BUSS 230 Notes for the Midterm (Chapter 1 – 5,
7nth edition)
Chapter 1
Managerial Economics refers to the application of economic theory and the tools of analysis of decision
science to examine how an organization can achieve its aims or objectives most effieciently
The organization can solve its management decision problems by the application of economic theory
and the tools of decision science
Economic theory refers to microeconomics and macroeconomics
Microeconomics is the study of the economic behavior of individual decision making units, such as
individual consumers, resource owners
Macroecnomics is the study of the total or aggrage level of output.
The basic process of decision making
1)
Defining the problem that the firm or organizton faces
2)
Determine the objective
3)
Identify possible solutions
4)
Select the best possible solution
5)
Implement the decision
The Theory of the firm or value of the firm is the maximize the wealth of the firm
Constrained optimization: Basically the firm is trying to maximize its value subject to the constraints it
faces
Business Profit refers to the revenue of the firm minus the explicit or accounting costs of the firm
Explicit Costs are the actual out-of-pocket expenditures of the firm to purchase or hire the inputs it
requires in production
Economic Profit (or above-normal profit) equals the revenue of the firm minus its explicit costs and
implicit costs.
Implicit Costs refer to the value of the inputs owned and used by the firm in its own production
processes. (Specifically, implicit costs include the salary that the entrepreneur could earn from working
for someone else in a similar capacity)
Theories of Profit
Risk Bearing THEORIES of profit: According to risk-bearing theories, above normal returns (economic
profits) are required by firms to enter and remain in such fields as petroleum exploration with above
average risks. Similarly, the expected return on stocks hash to be higher than on bonds because of the
greater risk of the former.
Frictional Theory of Profit: This theory stresses that profits arise as a result of friction or disturbances
from long-run equilibrium. That is, in long-run, perfectly competitive equilibrium, firms tend to earn only
a normal return (adjusted for risk) or zero (economic) profit on their investment. At any time, however,
firms are not likely to be in long-run equilibrium and may earn a profit or incur a loss. (energy crisis
example in book)
Monopoloy theory of profit: Some firms with monopoly power can restrict output and charge higher
prices than under perfect competition, thereby earning a profit
Innovation theory of profit: The innovation theory of profit postulates that (economic profit is the
reward for the introduction of a successful innovation.
Managerial Efficiency Theory of Profit: This theory rests on the observation that if the average firm
tends to earn only a normal return on its investment in the long run, firms that are more efficient than
the average would earn above-normal returns and (economic) profits.
Function of Profit
High profits are the signal that consumers want more of the output of the industry, high profits provide
the incentive for firms to expand output and for more firms to enter the industry in the long run.
For a firm of above average efficiency, profits represent the reward for greater efficiency.
On the other hand, lower profits or losses are the signal that consumers want less of the commodity and
that production methods many not be efficient. Thus profits provide the incentive for firms to increase
their efficiency and/or produce less of the commodity, and sometimes to leave the industry for more
profitable ones.
Information Superhighway is the term used to describe the rabid unification of the world through the
internet.
Chapter 2
-
The relationship between total, average, and marginal concepts and measures is crucial in
optimization analysis
-
Optimization Analysis
o
Profit maximization by TR and TC approach
o
Optimization by marginal analysis
-
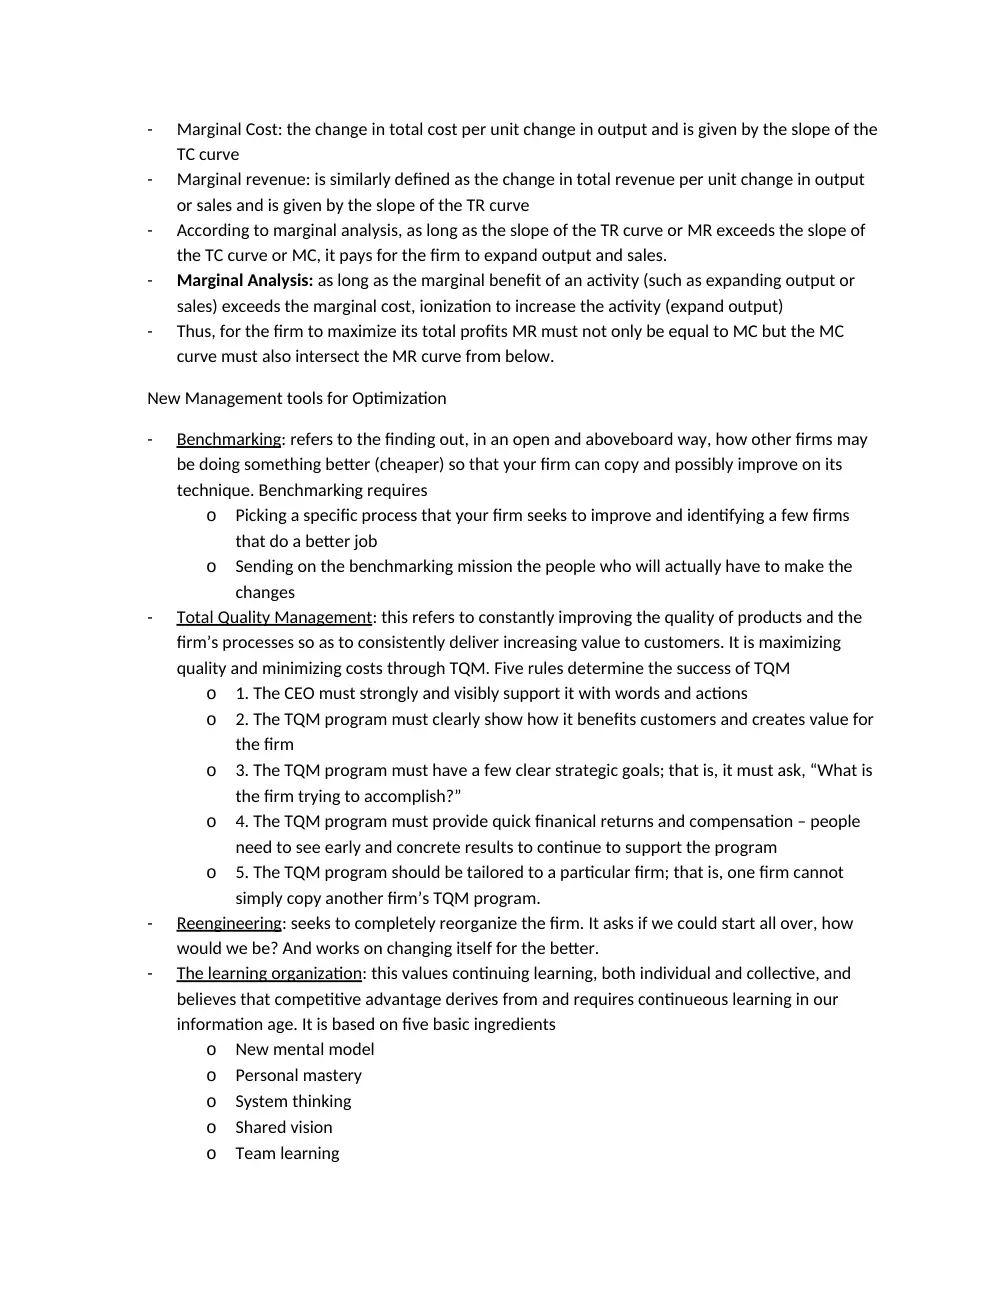
Marginal Cost: the change in total cost per unit change in output and is given by the slope of the
TC curve
-
Marginal revenue: is similarly defined as the change in total revenue per unit change in output
or sales and is given by the slope of the TR curve
-
According to marginal analysis, as long as the slope of the TR curve or MR exceeds the slope of
the TC curve or MC, it pays for the firm to expand output and sales.
-
Marginal Analysis: as long as the marginal benefit of an activity (such as expanding output or
sales) exceeds the marginal cost, ionization to increase the activity (expand output)
-
Thus, for the firm to maximize its total profits MR must not only be equal to MC but the MC
curve must also intersect the MR curve from below.
New Management tools for Optimization
-
Benchmarking
: refers to the finding out, in an open and aboveboard way, how other firms may
be doing something better (cheaper) so that your firm can copy and possibly improve on its
technique. Benchmarking requires
o
Picking a specific process that your firm seeks to improve and identifying a few firms
that do a better job
o
Sending on the benchmarking mission the people who will actually have to make the
changes
-
Total Quality Management
: this refers to constantly improving the quality of products and the
firm’s processes so as to consistently deliver increasing value to customers. It is maximizing
quality and minimizing costs through TQM. Five rules determine the success of TQM
o
1. The CEO must strongly and visibly support it with words and actions
o
2. The TQM program must clearly show how it benefits customers and creates value for
the firm
o
3. The TQM program must have a few clear strategic goals; that is, it must ask, “What is
the firm trying to accomplish?”
o
4. The TQM program must provide quick finanical returns and compensation – people
need to see early and concrete results to continue to support the program
o
5. The TQM program should be tailored to a particular firm; that is, one firm cannot
simply copy another firm’s TQM program.
-
Reengineering
: seeks to completely reorganize the firm. It asks if we could start all over, how
would we be? And works on changing itself for the better.
-
The learning organization
: this values continuing learning, both individual and collective, and
believes that competitive advantage derives from and requires continueous learning in our
information age. It is based on five basic ingredients
o
New mental model
o
Personal mastery
o
System thinking
o
Shared vision
o
Team learning
Chapter 3
Consumer Demand Theory: postulates that the quantity demanded of a commodity is a function of, or
depends on, the price of the commodity, the consumers income, the price of related commodities, and
the tastes of the consumer.
Normal Goods vs Inferior Goods
The inverse relationship between the price and the quantity demanded of the commodity per time
period is then the indivdual’s demand schedule for the commodity, and the plot of data is the
individuals demand curve.
The Law of Demand: the inverse relationship between quanitity demanded and price of the commodity
Substitution effect
Income Effect
Change in the quantity demanded movement along the demand curve
Change in demand movement of the demand curve
The market demand curve: a horizontal summation of the emand curves of all the cosumers in the
market
Bandwagon Effect: tends to make the MD curve flatter than indicated by the horizontal summation of
the indiduals demand curve. It is buying something just because it is fashionable and you want to “keep
up with the joneses”
Snob Effect: Not buying something because you want to be exclusive and different
Durable Goods: firms that sell durable goods (washing machines and refrigerators) usually face a more
volatile or unstable demand than a firm selling nondurable goods
Derived Demand: The firm’s demand for inputs
Producers’ goods: such as capital equipment and raw materials that can be stored, also are more volatile
and unstable than the firm’s demand for perishable materials
Factors Affecting Price Elasticity of Demand
-
Depends primarily on the availability of substitutes for the commodity but also on the length of
time over which the quantity response to the price change is measured
-
For example sugar is more elastic than salt because it has many substitutes
-
The more narrowly a commodity is defined, the greater its price elasticity of demand because
the greater will be the number of substitutes.
-
The price elasticity of demand is also larger the longer is the time period allowed for consumers
to respond to the change in the commodity price (it takes a while for ppl to adjust and learn of
subsititutes)
Factors effecting income elasticity of demand
-
Depends if the good is a normal good or inferior good
Cross Price Elasticity of Demand
-
Depends if a substitute or complement
Chapter 4
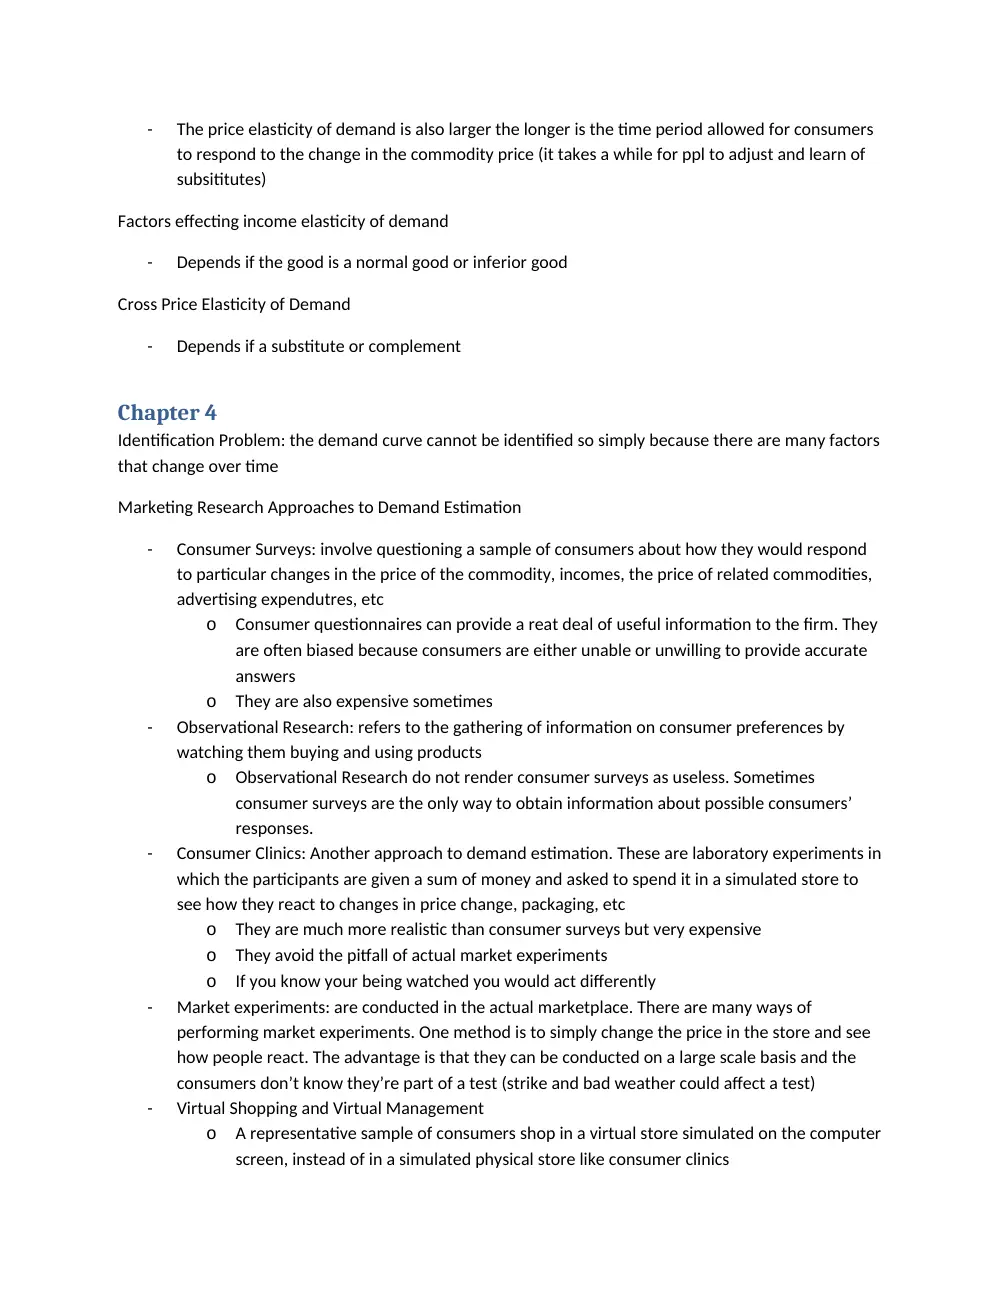
Identification Problem: the demand curve cannot be identified so simply because there are many factors
that change over time
Marketing Research Approaches to Demand Estimation
-
Consumer Surveys: involve questioning a sample of consumers about how they would respond
to particular changes in the price of the commodity, incomes, the price of related commodities,
advertising expendutres, etc
o
Consumer questionnaires can provide a reat deal of useful information to the firm. They
are often biased because consumers are either unable or unwilling to provide accurate
answers
o
They are also expensive sometimes
-
Observational Research: refers to the gathering of information on consumer preferences by
watching them buying and using products
o
Observational Research do not render consumer surveys as useless. Sometimes
consumer surveys are the only way to obtain information about possible consumers’
responses.
-
Consumer Clinics: Another approach to demand estimation. These are laboratory experiments in
which the participants are given a sum of money and asked to spend it in a simulated store to
see how they react to changes in price change, packaging, etc
o
They are much more realistic than consumer surveys but very expensive
o
They avoid the pitfall of actual market experiments
o
If you know your being watched you would act differently
-
Market experiments: are conducted in the actual marketplace. There are many ways of
performing market experiments. One method is to simply change the price in the store and see
how people react. The advantage is that they can be conducted on a large scale basis and the
consumers don’t know they’re part of a test (strike and bad weather could affect a test)
-
Virtual Shopping and Virtual Management
o
A representative sample of consumers shop in a virtual store simulated on the computer
screen, instead of in a simulated physical store like consumer clinics
o
Virtual management refers to the ability of a manger to simulate consumer behavior
using computer models based on the emerging science or theory of complexity
-
Regression analysis is a statistical technique for obtaining the line that best fits the data points
according to an objective statiscal criterion, so that all researchers looking at the same data
would get exactly the same result
-
The regression line is the line obtained by minimizing the sum of the squared vertical deviations
of each point from the regression line. This method is called the “ordinary least squares”.
-
The adjusted R squared is in order to take into consideration that the number of degrees of
freedom declines as additional independent variables are included in the regression.
Problems in regression analysis
-
Multicollnearity: refers to the situation in which two or more explanatory variables in the
regression are highly correlated. This could lead to the conclusion that both slope coefficients
are statistically insignificant. Serious multicollinearity can be overcome by
o
Extending the sample size
o
Using priori information
o
Transforming the functional relationship, and/or dropping one of the highly collinear
variables
-
Heteroscedasticity: this arises when the assumption that the variance of the error term is
constant for all values of the independent variables is violated. This often occurs in cross
sectional data. For example the error associated with low income families is usually smaller than
for high income families because most of the expenditures of low income families are
necessities with little room for discretion.
-
Autocorrelation: whenever consecutive errors or residuals are correlated, we have this. When
consecutive errors have the same sign we call it positive autocorrelation. When they change sign
frequently we call it negative autocorrelation. This problem is most often found in time-series
data.
Chapter 5
Qualititative forecasts
-
Survey Techniques
o
Surveys of business executives plant and equipment expensture plans
o
Surveys Of plans for inventory changes and sales expectations
o
Surveys of consumers’ expenditure plants
-
Opinion Polls
o
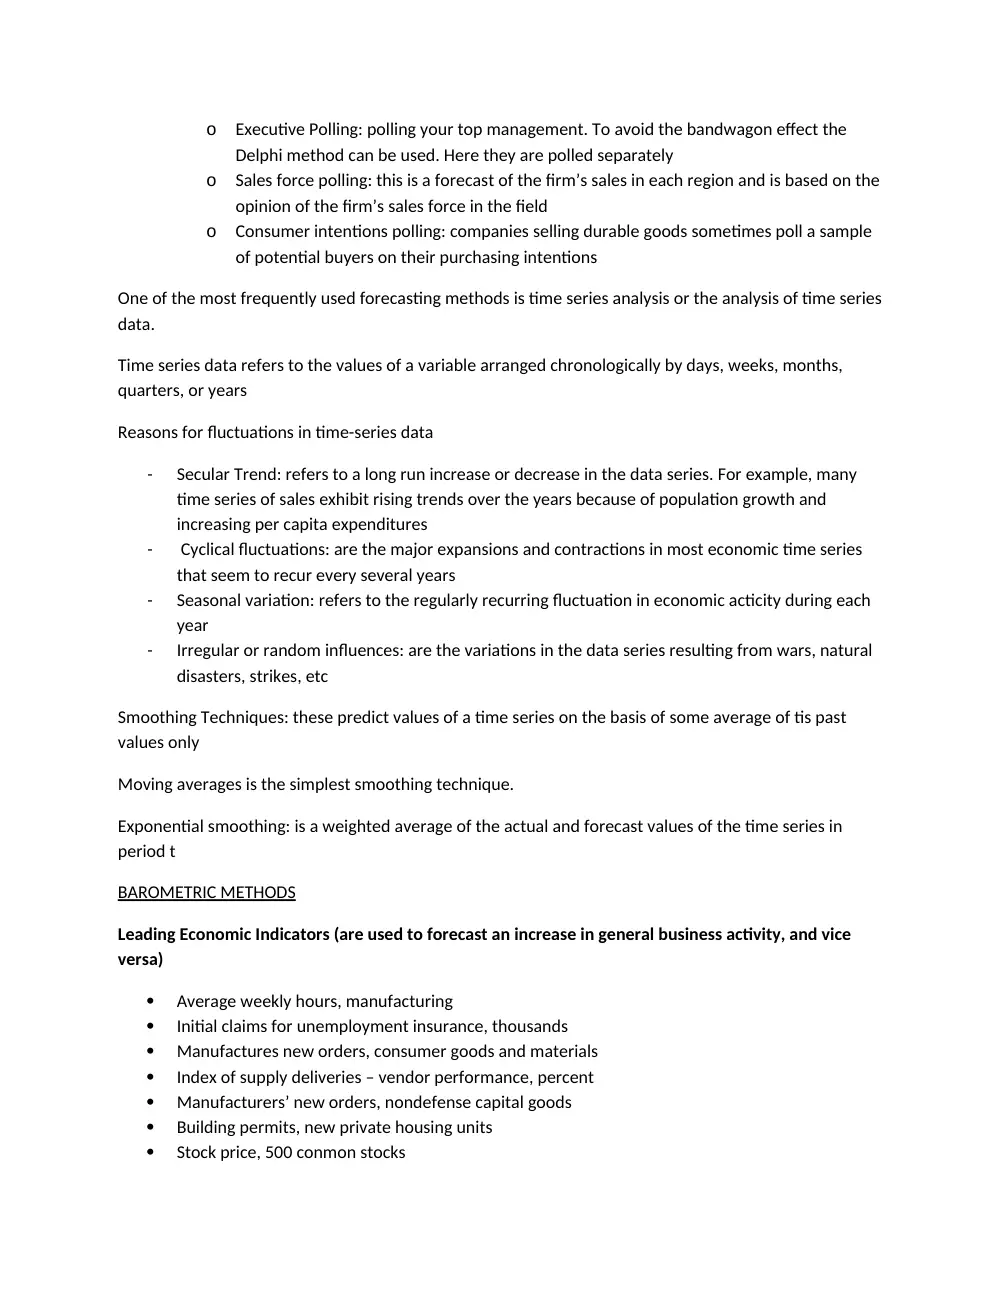
Executive Polling: polling your top management. To avoid the bandwagon effect the
Delphi method can be used. Here they are polled separately
o
Sales force polling: this is a forecast of the firm’s sales in each region and is based on the
opinion of the firm’s sales force in the field
o
Consumer intentions polling: companies selling durable goods sometimes poll a sample
of potential buyers on their purchasing intentions
One of the most frequently used forecasting methods is time series analysis or the analysis of time series
data.
Time series data refers to the values of a variable arranged chronologically by days, weeks, months,
quarters, or years
Reasons for fluctuations in time-series data
-
Secular Trend: refers to a long run increase or decrease in the data series. For example, many
time series of sales exhibit rising trends over the years because of population growth and
increasing per capita expenditures
-
Cyclical fluctuations: are the major expansions and contractions in most economic time series
that seem to recur every several years
-
Seasonal variation: refers to the regularly recurring fluctuation in economic acticity during each
year
-
Irregular or random influences: are the variations in the data series resulting from wars, natural
disasters, strikes, etc
Smoothing Techniques: these predict values of a time series on the basis of some average of tis past
values only
Moving averages is the simplest smoothing technique.
Exponential smoothing: is a weighted average of the actual and forecast values of the time series in
period t
BAROMETRIC METHODS
Leading Economic Indicators (are used to forecast an increase in general business activity, and vice
versa)
Average weekly hours, manufacturing
Initial claims for unemployment insurance, thousands
Manufactures new orders, consumer goods and materials
Index of supply deliveries – vendor performance, percent
Manufacturers’ new orders, nondefense capital goods
Building permits, new private housing units
Stock price, 500 conmon stocks
Money supply, M2
Interest rate spread, 10 year treasury bonds less federal funds
Index of consumer expectations
Coincident indicators: some time series move in step or coincide with movement’s in general
economic activity
Employees on nonagricultural payrolls
Personal income less transfer payments
Industrial production
Manufacturing and trade sales
Lagging Indicators are time series that lag movements in economic activity
Average duration of unemployment, weeks
Ratio, manufacturing and trade inventories to sales
Change in labor cost per unit of output, manufacturing
Average prime rate charged by banks
Commercial and industrial loans outstanding
Ratio, consumer installment credit outstanding to personal income
Change in consumer price index for services
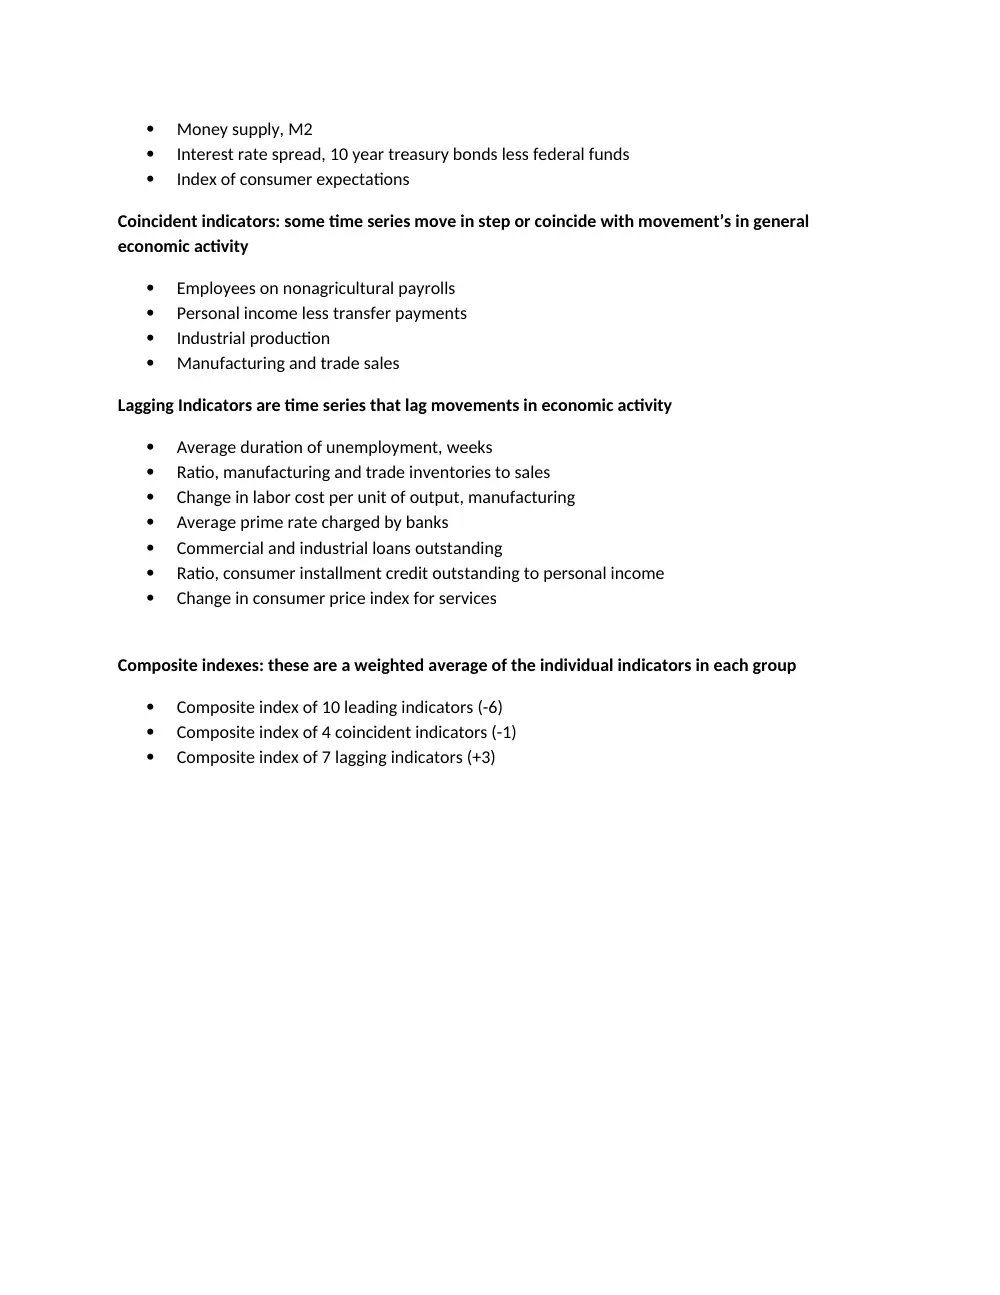
Composite indexes: these are a weighted average of the individual indicators in each group
Composite index of 10 leading indicators (-6)
Composite index of 4 coincident indicators (-1)
Composite index of 7 lagging indicators (+3)