
BUSS 230 Midterm, Fall 2013
American University of Beirut · Managerial Economics · 17 pages
Showing the first 10 of 17 pages. Download the PDF to see all of it.
More BUSS 230 files
- Midterm Solution · Fall 2013Exam · with solutionView
- Midterm Review Questions Solution · Fall 2011Exam · with solutionView
- Midterm Review Questions · Fall 2011ExamView
- Midterm · Fall 2006ExamView
- Midterm · Spring 2005ExamView
- Midterm · Fall 2005ExamView
- Midterm · Spring 2004ExamView
- Midterm · Spring 2004ExamView
Show the text of this exam
BUSS 230 | Fall 2013-2014 | Dr. George G. Namur
Page 1 of 17
BUSS 230 Managerial Economics
Fall 2013 – 2014
Dr. George G. Namur
Midterm Review Problems
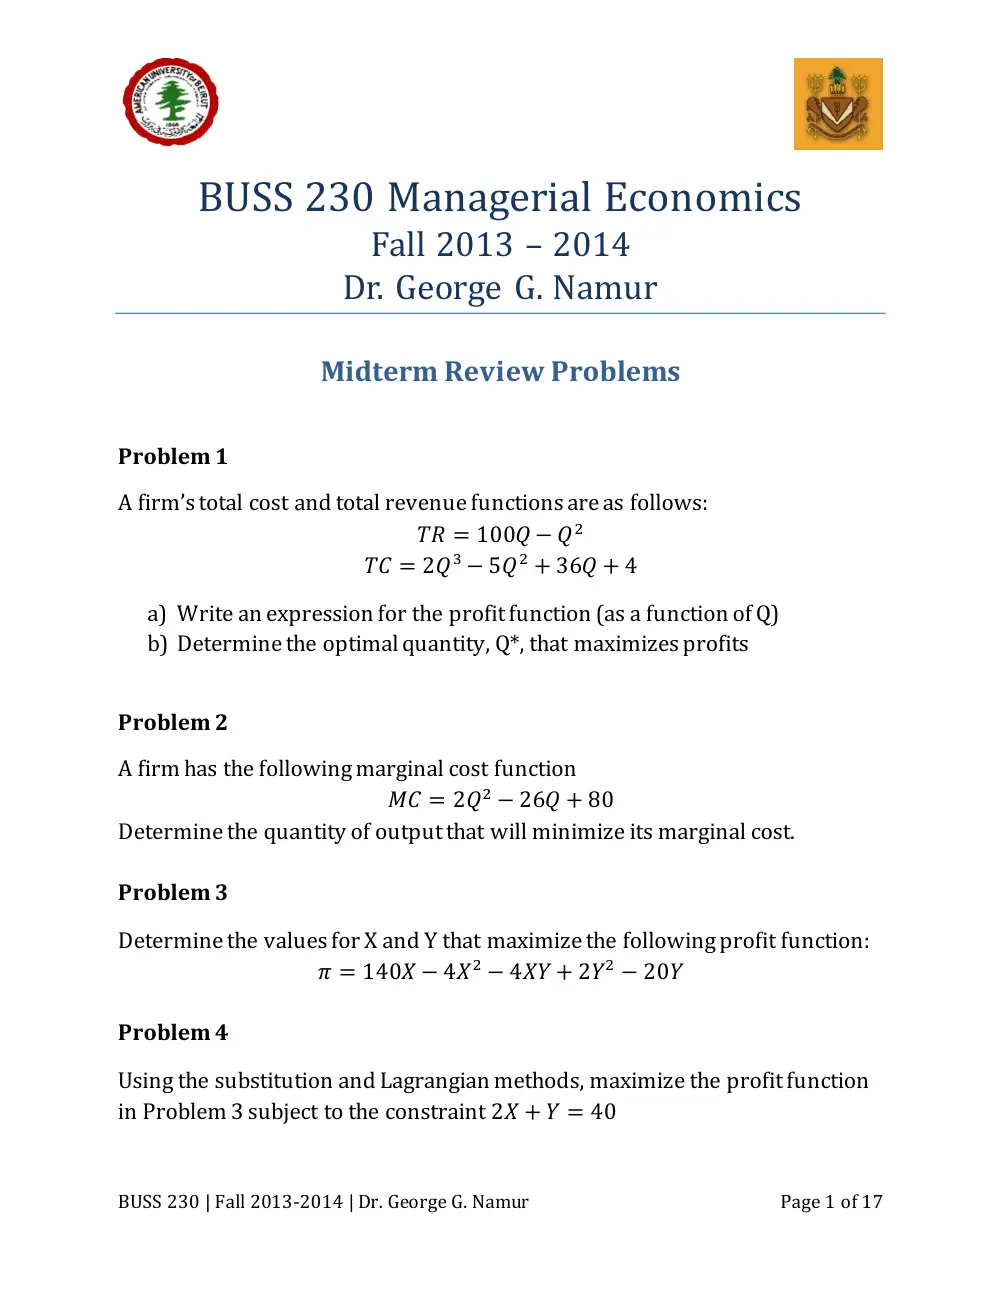
Problem 1
A firm’s total cost and total revenue functions are as follows:
a) Write an expression for the profit function (as a function of Q)
b) Determine the optimal quantity, Q*, that maximizes profits
Problem 2
A firm has the following marginal cost function
Determine the quantity of output that will minimize its marginal cost.
Problem 3
Determine the values for X and Y that maximize the following profit function:
Problem 4
Using the substitution and Lagrangian methods, maximize the profit function
in Problem 3 subject to the constraint
BUSS 230 | Fall 2013-2014 | Dr. George G. Namur
Page 2 of 17
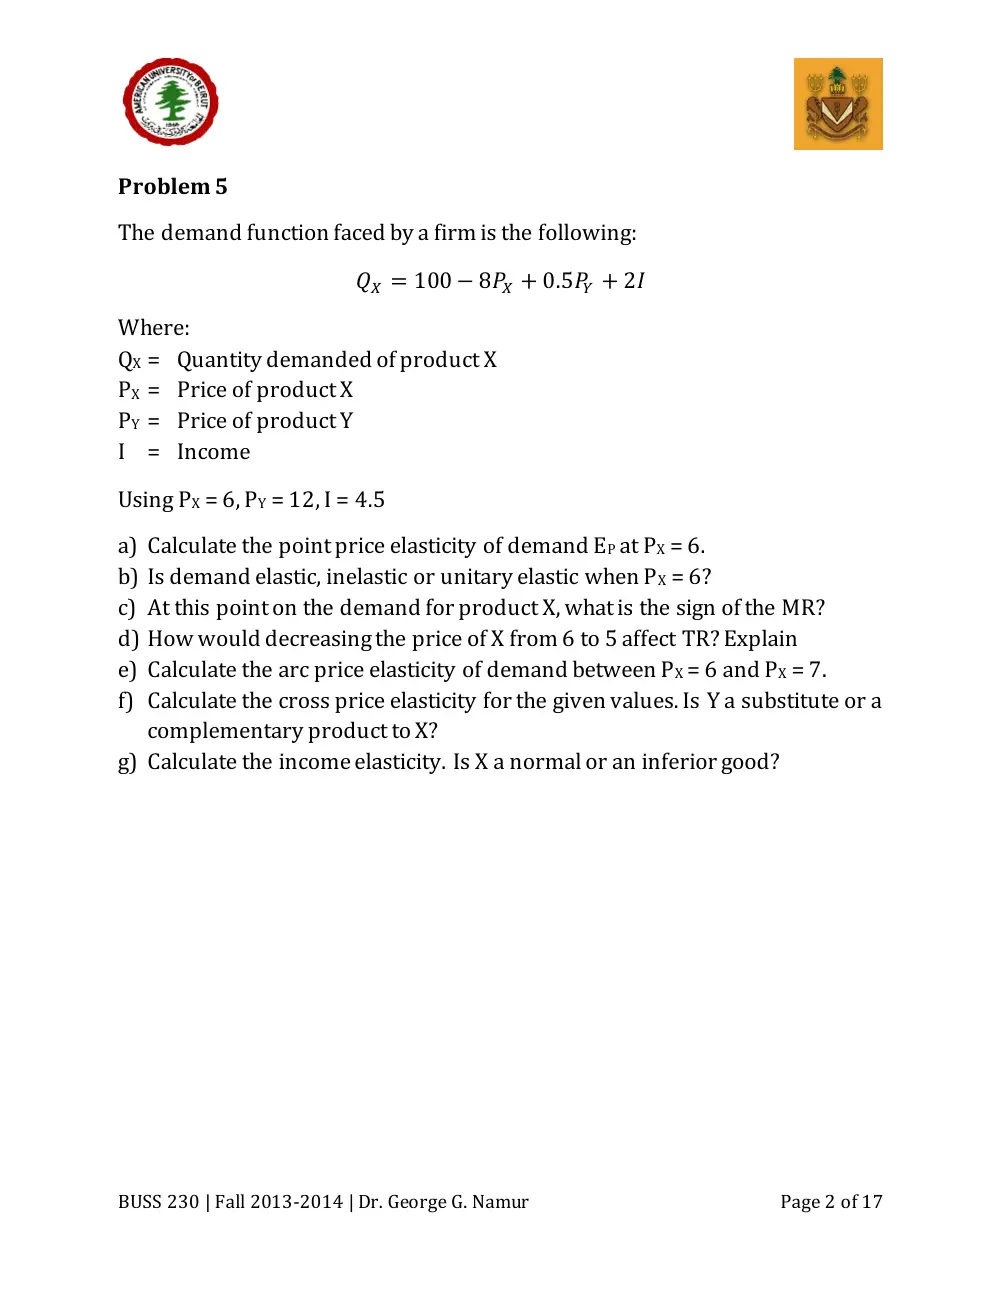
Problem 5
The demand function faced by a firm is the following:
Where:
QX = Quantity demanded of product X
PX = Price of product X
PY = Price of product Y
I = Income
Using PX = 6, PY = 12, I = 4.5
a) Calculate the point price elasticity of demand EP at PX = 6.
b) Is demand elastic, inelastic or unitary elastic when PX = 6?
c) At this point on the demand for product X, what is the sign of the MR?
d) How would decreasing the price of X from 6 to 5 affect TR? Explain
e) Calculate the arc price elasticity of demand between PX = 6 and PX = 7.
f) Calculate the cross price elasticity for the given values. Is Y a substitute or a
complementary product to X?
g) Calculate the income elasticity. Is X a normal or an inferior good?
BUSS 230 | Fall 2013-2014 | Dr. George G. Namur
Page 3 of 17
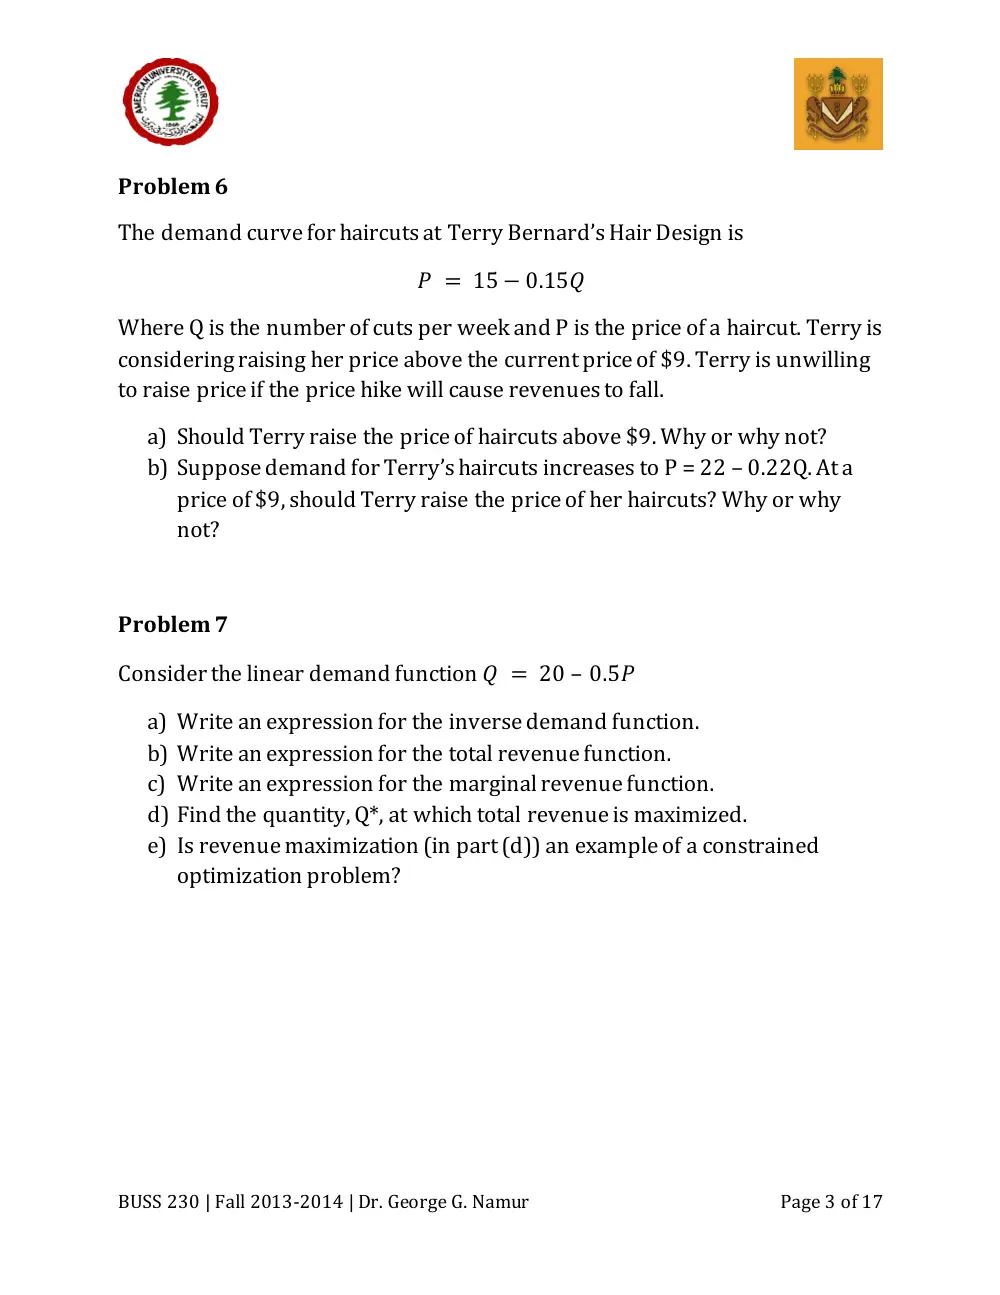
Problem 6
The demand curve for haircuts at Terry Bernard’s Hair Design is
Where Q is the number of cuts per week and P is the price of a haircut. Terry is
considering raising her price above the current price of $9. Terry is unwilling
to raise price if the price hike will cause revenues to fall.
a) Should Terry raise the price of haircuts above $9. Why or why not?
b) Suppose demand for Terry’s haircuts increases to P = 22 – 0.22Q. At a
price of $9, should Terry raise the price of her haircuts? Why or why
not?
Problem 7
Consider the linear demand function –
a) Write an expression for the inverse demand function.
b) Write an expression for the total revenue function.
c) Write an expression for the marginal revenue function.
d) Find the quantity, Q*, at which total revenue is maximized.
e) Is revenue maximization (in part (d)) an example of a constrained
optimization problem?
BUSS 230 | Fall 2013-2014 | Dr. George G. Namur
Page 4 of 17
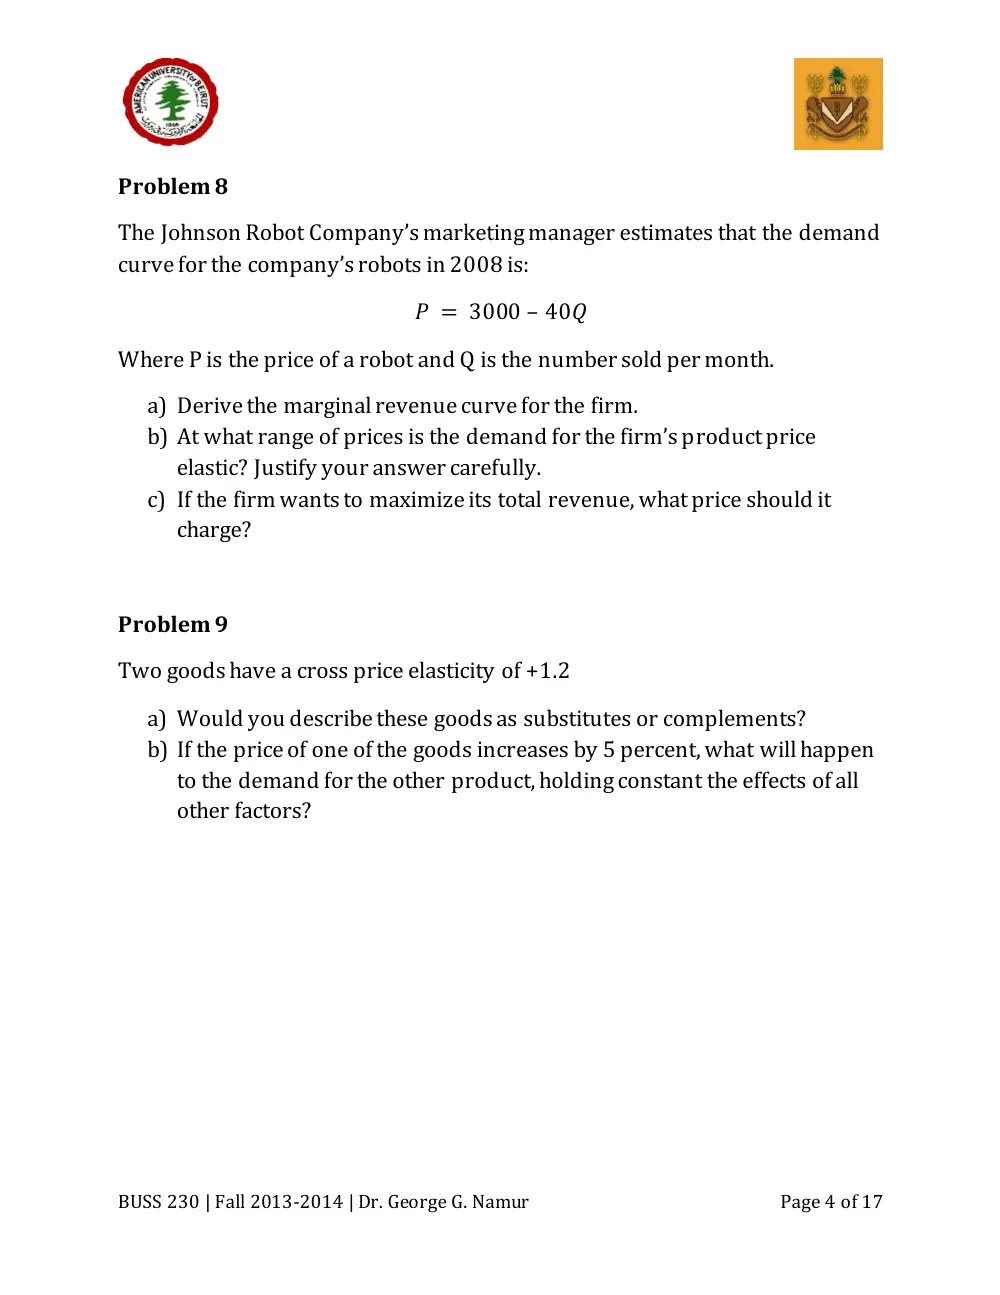
Problem 8
The Johnson Robot Company’s marketing manager estimates that the demand
curve for the company’s robots in 2008 is:
–
Where P is the price of a robot and Q is the number sold per month.
a) Derive the marginal revenue curve for the firm.
b) At what range of prices is the demand for the firm’s product price
elastic? Justify your answer carefully.
c) If the firm wants to maximize its total revenue, what price should it
charge?
Problem 9
Two goods have a cross price elasticity of +1.2
a) Would you describe these goods as substitutes or complements?
b) If the price of one of the goods increases by 5 percent, what will happen
to the demand for the other product, holding constant the effects of all
other factors?
BUSS 230 | Fall 2013-2014 | Dr. George G. Namur
Page 5 of 17
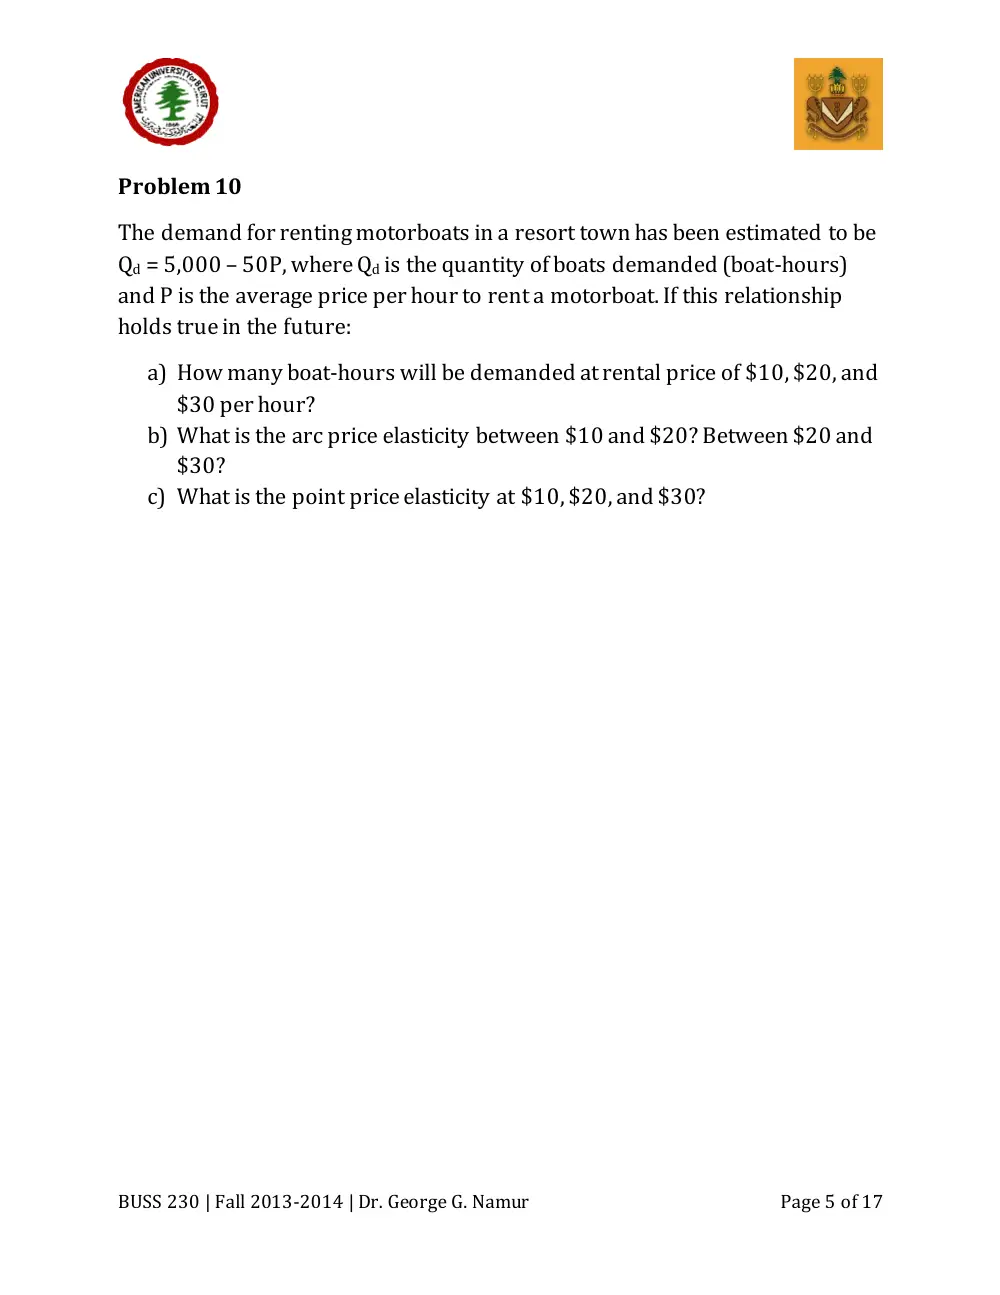
Problem 10
The demand for renting motorboats in a resort town has been estimated to be
Qd = 5,000 – 50P, where Qd is the quantity of boats demanded (boat-hours)
and P is the average price per hour to rent a motorboat. If this relationship
holds true in the future:
a) How many boat-hours will be demanded at rental price of $10, $20, and
$30 per hour?
b) What is the arc price elasticity between $10 and $20? Between $20 and
$30?
c) What is the point price elasticity at $10, $20, and $30?
BUSS 230 | Fall 2013-2014 | Dr. George G. Namur
Page 6 of 17
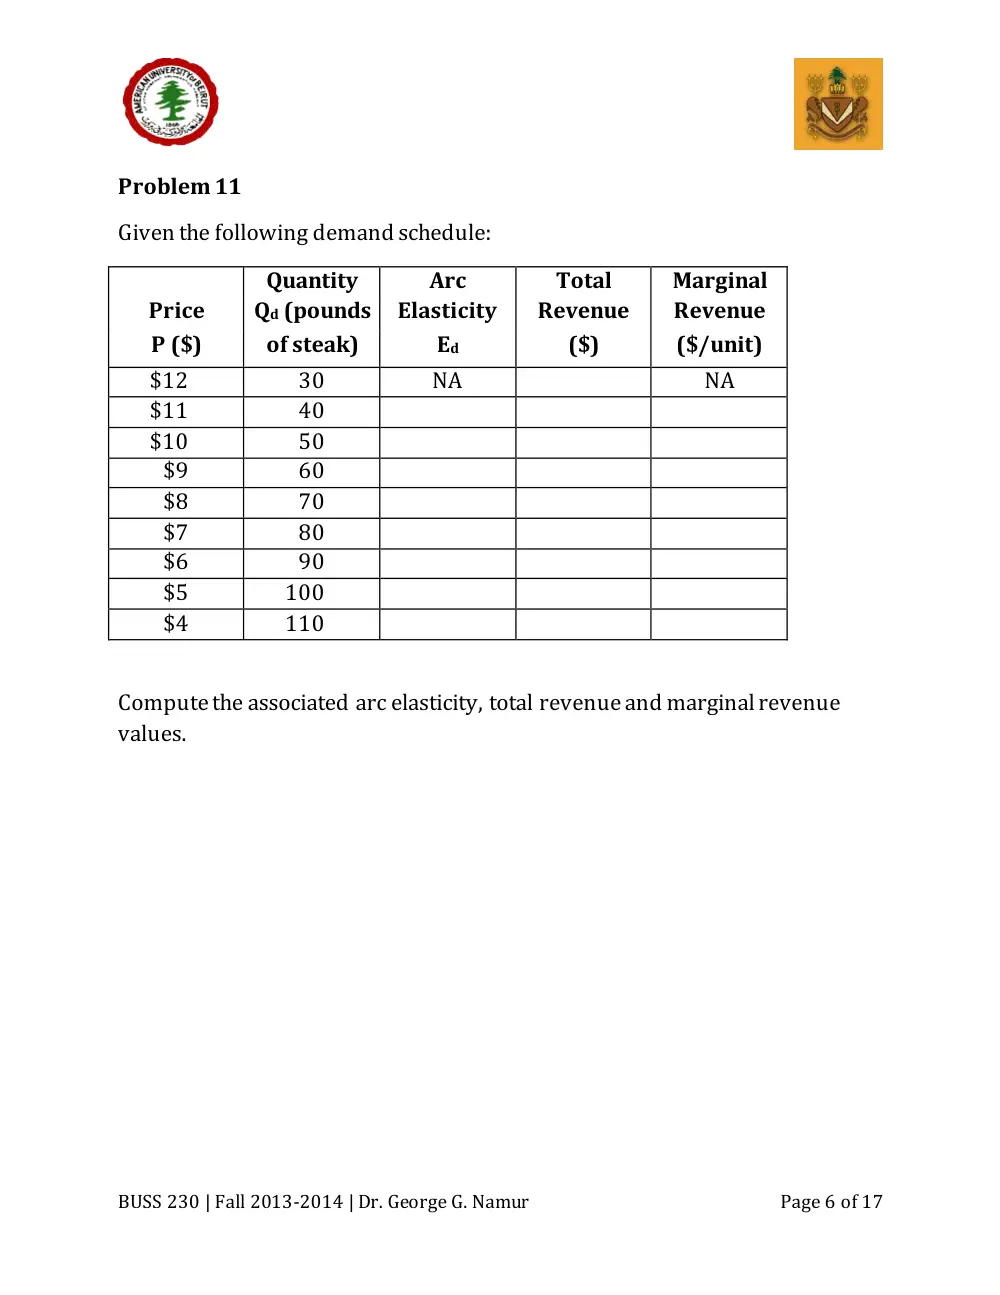
Problem 11
Given the following demand schedule:
Quantity
Arc
Total
Marginal
Price
Qd (pounds
Elasticity
Revenue
Revenue
P ($)
of steak)
Ed
($)
($/unit)
$12
30
NA
NA
$11
40
$10
50
$9
60
$8
70
$7
80
$6
90
$5
100
$4
110
Compute the associated arc elasticity, total revenue and marginal revenue
values.
BUSS 230 | Fall 2013-2014 | Dr. George G. Namur
Page 7 of 17
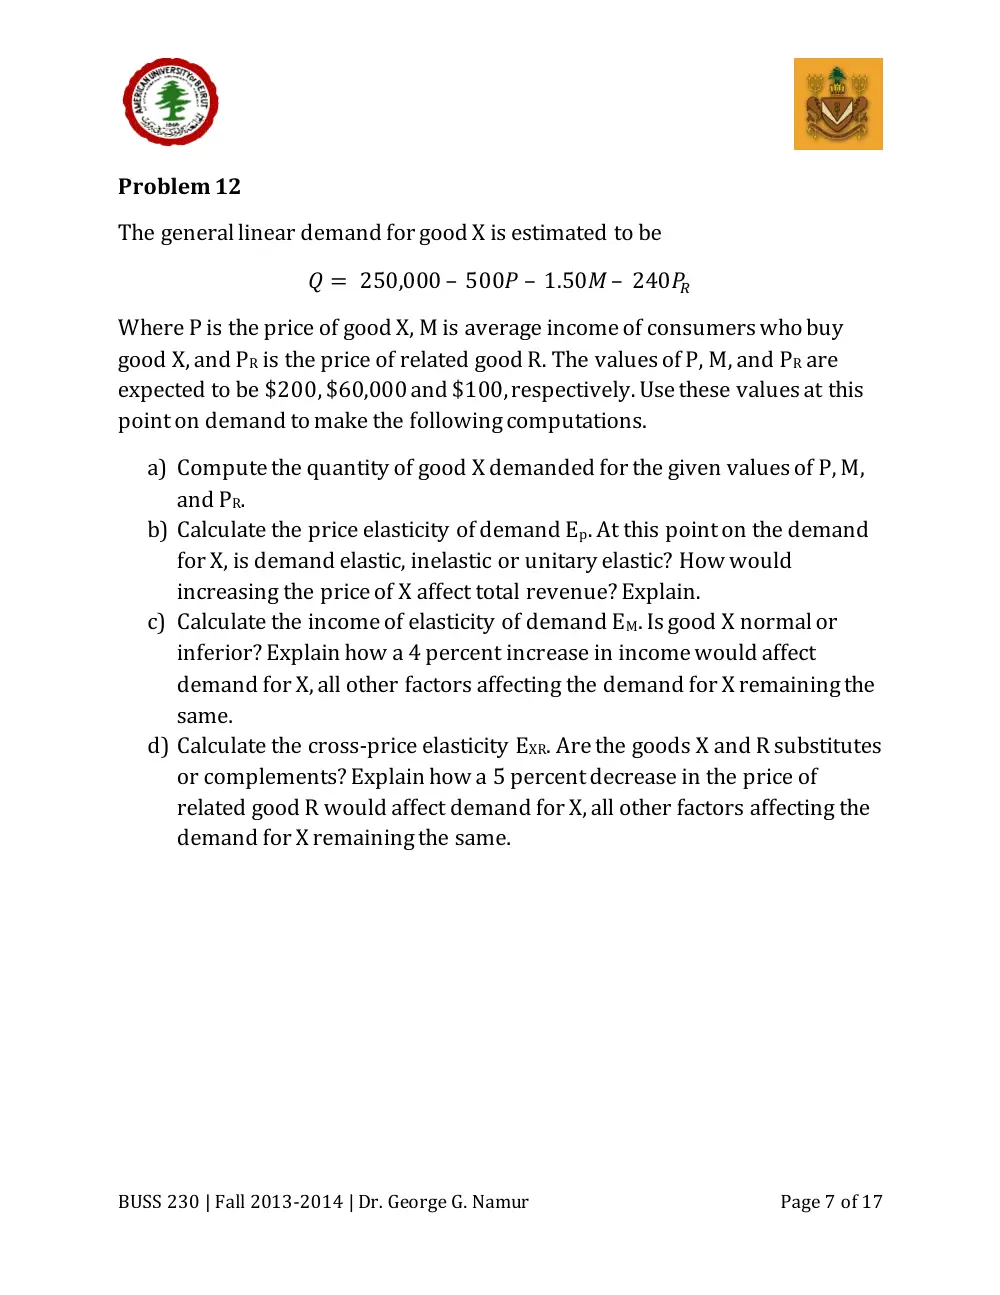
Problem 12
The general linear demand for good X is estimated to be
– – –
Where P is the price of good X, M is average income of consumers who buy
good X, and PR is the price of related good R. The values of P, M, and PR are
expected to be $200, $60,000 and $100, respectively. Use these values at this
point on demand to make the following computations.
a) Compute the quantity of good X demanded for the given values of P, M,
and PR.
b) Calculate the price elasticity of demand Ep. At this point on the demand
for X, is demand elastic, inelastic or unitary elastic? How would
increasing the price of X affect total revenue? Explain.
c) Calculate the income of elasticity of demand EM. Is good X normal or
inferior? Explain how a 4 percent increase in income would affect
demand for X, all other factors affecting the demand for X remaining the
same.
d) Calculate the cross-price elasticity EXR. Are the goods X and R substitutes
or complements? Explain how a 5 percent decrease in the price of
related good R would affect demand for X, all other factors affecting the
demand for X remaining the same.
BUSS 230 | Fall 2013-2014 | Dr. George G. Namur
Page 8 of 17
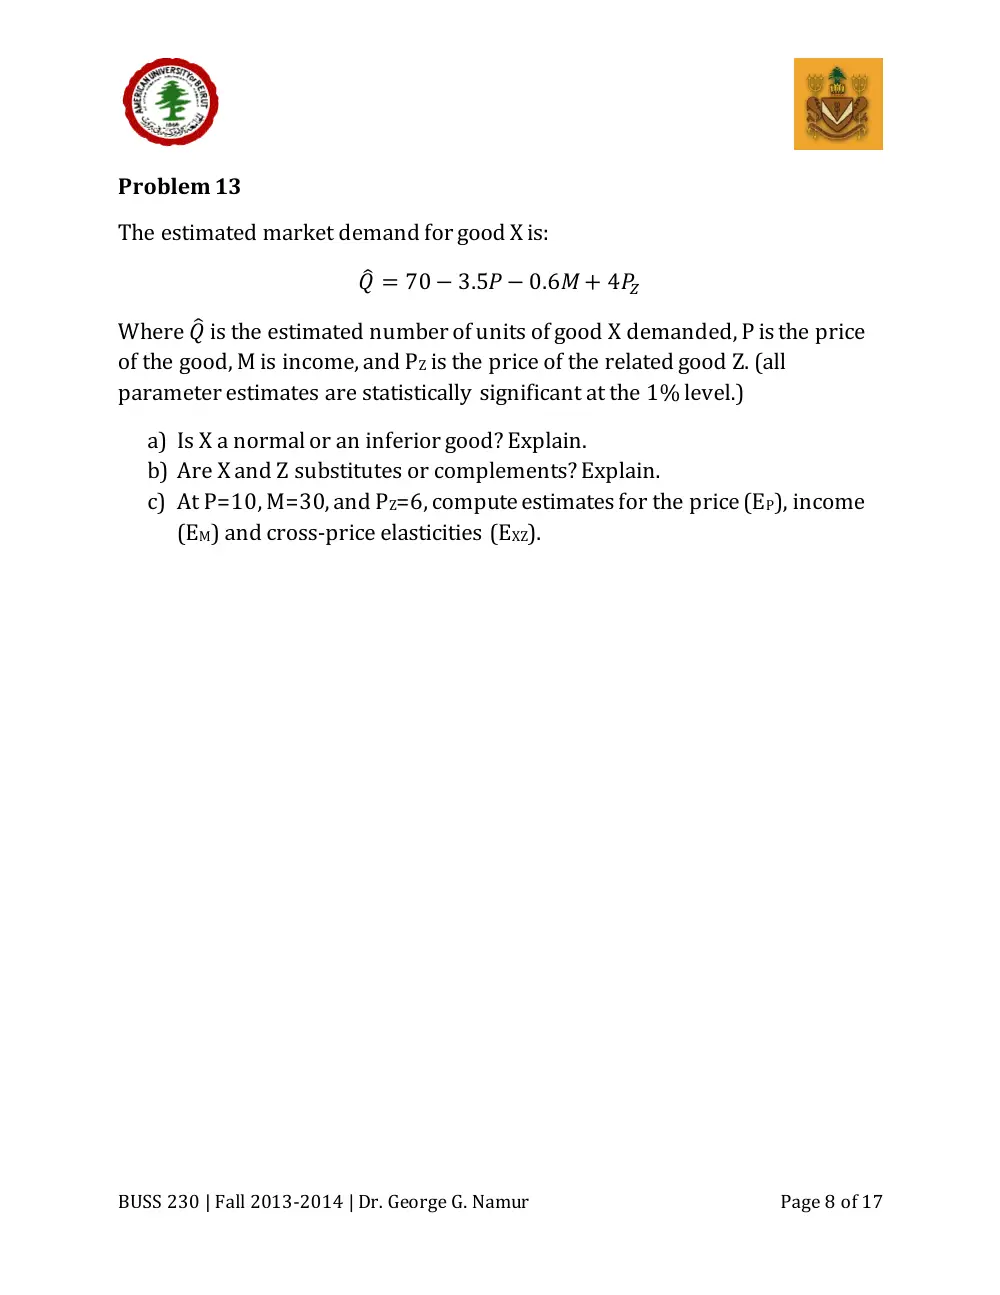
Problem 13
The estimated market demand for good X is:
̂
Where ̂ is the estimated number of units of good X demanded, P is the price
of the good, M is income, and PZ is the price of the related good Z. (all
parameter estimates are statistically significant at the 1% level.)
a) Is X a normal or an inferior good? Explain.
b) Are X and Z substitutes or complements? Explain.
c) At P=10, M=30, and PZ=6, compute estimates for the price (EP), income
(EM) and cross-price elasticities (EXZ).
BUSS 230 | Fall 2013-2014 | Dr. George G. Namur
Page 9 of 17
Problem 14
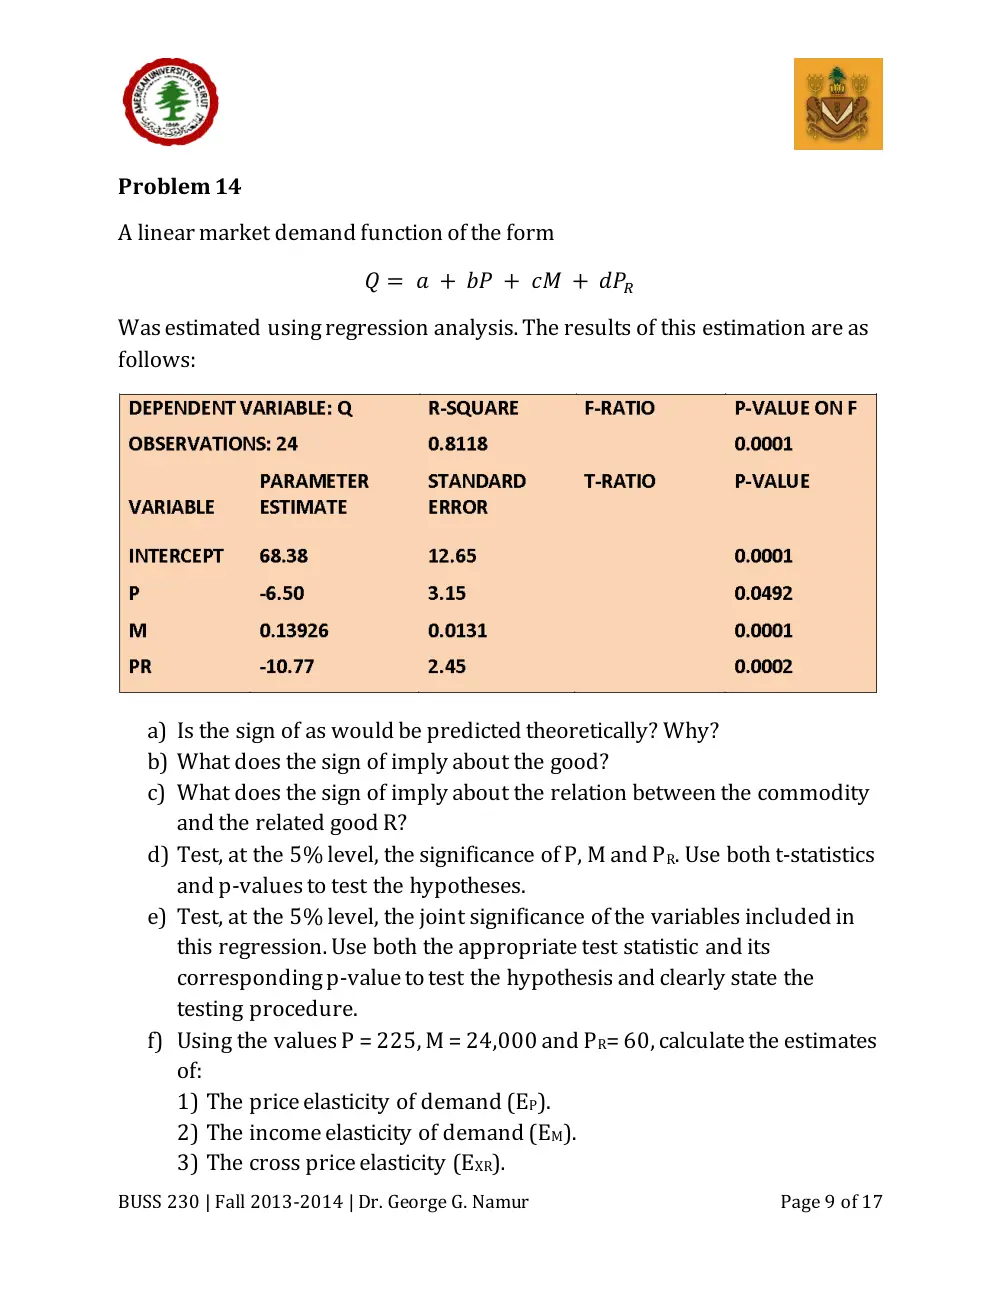
A linear market demand function of the form
Was estimated using regression analysis. The results of this estimation are as
follows:
a) Is the sign of as would be predicted theoretically? Why?
b) What does the sign of imply about the good?
c) What does the sign of imply about the relation between the commodity
and the related good R?
d) Test, at the 5% level, the significance of P, M and PR. Use both t-statistics
and p-values to test the hypotheses.
e) Test, at the 5% level, the joint significance of the variables included in
this regression. Use both the appropriate test statistic and its
corresponding p-value to test the hypothesis and clearly state the
testing procedure.
f) Using the values P = 225, M = 24,000 and PR= 60, calculate the estimates
of:
1) The price elasticity of demand (EP).
2) The income elasticity of demand (EM).
3) The cross price elasticity (EXR).
BUSS 230 | Fall 2013-2014 | Dr. George G. Namur
Page 10 of 17
Problem 15
Wilpen Company, a price-setting firm, produces nearly 80 percent of all tennis
balls purchased in the United States. Wilpen estimates the U.S. demand for its
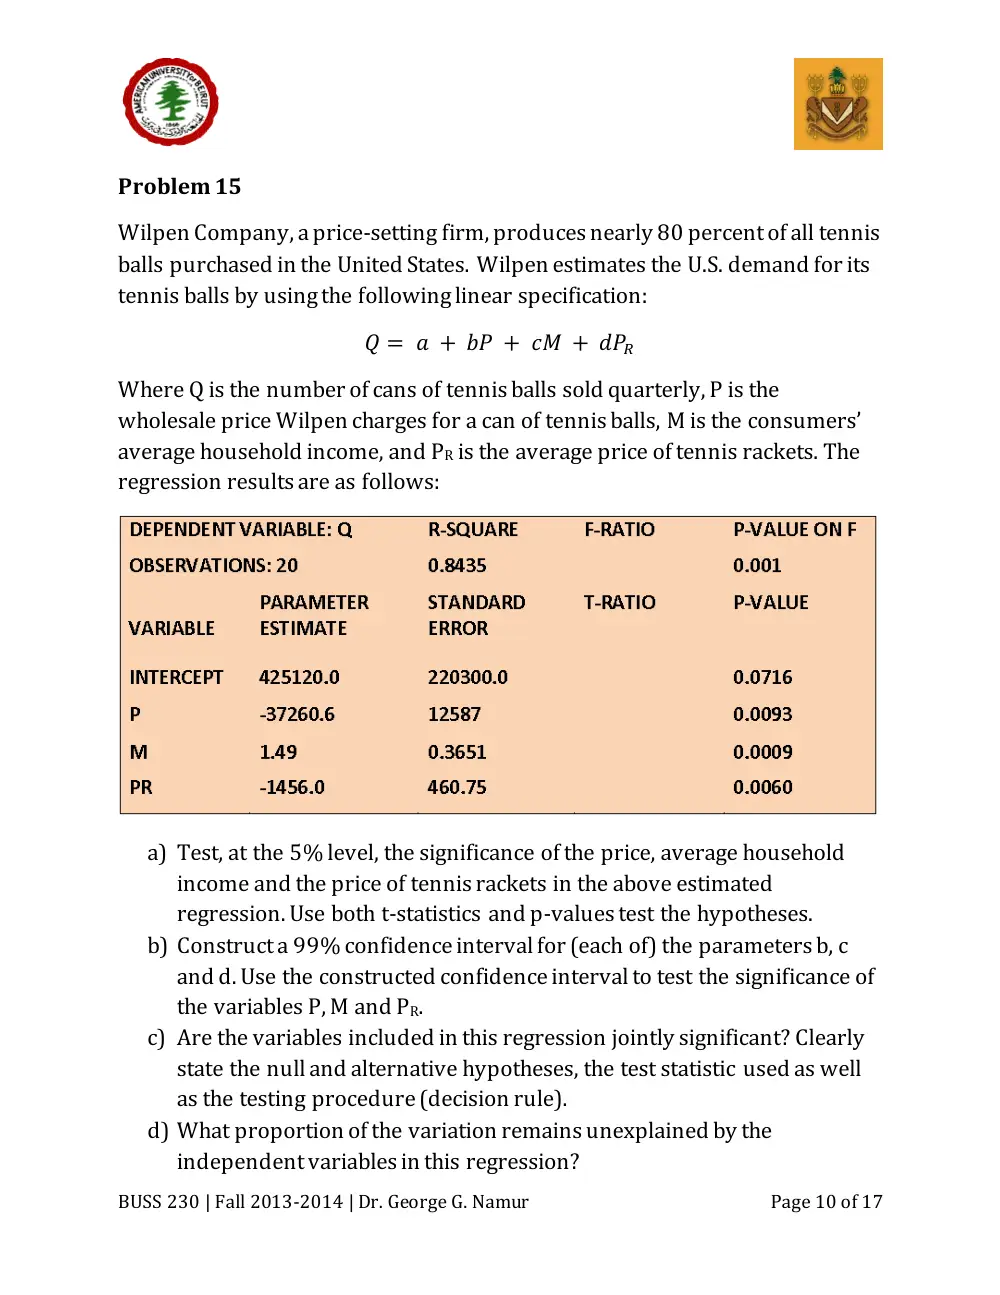
tennis balls by using the following linear specification:
Where Q is the number of cans of tennis balls sold quarterly, P is the
wholesale price Wilpen charges for a can of tennis balls, M is the consumers’
average household income, and PR is the average price of tennis rackets. The
regression results are as follows:
a) Test, at the 5% level, the significance of the price, average household
income and the price of tennis rackets in the above estimated
regression. Use both t-statistics and p-values test the hypotheses.
b) Construct a 99% confidence interval for (each of) the parameters b, c
and d. Use the constructed confidence interval to test the significance of
the variables P, M and PR.
c) Are the variables included in this regression jointly significant? Clearly
state the null and alternative hypotheses, the test statistic used as well
as the testing procedure (decision rule).
d) What proportion of the variation remains unexplained by the
independent variables in this regression?
BUSS 230 | Fall 2013-2014 | Dr. George G. Namur
Page 11 of 17
e) Compute the Adjusted R2of this regression.
Wilpen plans to charge to charge a wholesale price of $1.65 per can. The
average price of a tennis racket is $110, and the consumers’ average
household income is $24,600.
f) What is the estimated number of cans of tennis balls demanded?
g) At the values of P, M and PR given, what are the estimated vales of the
price (EP), income (EM), and the cross price elasticity of demand (EXR).
h) What will happen, in percentage terms, to the number of cans of tennis
balls demanded if the price of tennis balls decreases 15 percent?
i) What will happen, in percentage terms, to the number of cans of tennis
balls demanded if average household income increases by 20 percent?
j) What will happen, in percentage terms, to the number of cans of tennis
balls demanded if the average price of tennis rackets increases by 25
percent?
BUSS 230 | Fall 2013-2014 | Dr. George G. Namur
Page 12 of 17
Problem 16
The estimated market demand for good X is:
̂
where ̂is the estimated number of units of good X demanded, P is the price of
good X, M is income, and PG is the price of related good G. (All parameter
estimates are statistically significant at the 1 percent level of significance.)
a) Is the sign of the coefficient associated with the price consistent with
theory? Why or why not?
b) Given the above equation, is good X a normal or inferior good?
c) Are goods X and G complements or substitutes?
d) At P = $12, M = $30,000, and PG = $50, what is the predicted quantity of
good X?
e) At the values in part (d), compute the following elasticities:
1) Own Price elasticity EP.
2) Cross-price elasticity EXG.
3) Income elasticity EM.
f) The R2 from this regression is 0.65. What proportion of the variation in
the demand for X is explained by the above regression? What
proportion of variation in demand remains unexplained?
g) Given a sample size n=25, compute the F-statistic for this demand
equation.
h) Test, at the 5% level, the joint significance of all the variables included
in the regression.
i) All else constant, what would be the effect (in percentage terms) of a
20% increase in income?
j) All else constant, what would the effect (in percentage terms) of 15%
increase in the price of the related product G?
BUSS 230 | Fall 2013-2014 | Dr. George G. Namur
Page 13 of 17
Problem 17
Rubax, a U.S. manufacturer of athletic shoes, estimates the following linear
trend model for shoe sales:
Where:
Qt = sales of athletic shoes in the quarter t
t = 1, 2, …, 28 [2001Q1, 2001Q2, ….,2007Q4]
D1 = 1 for the 1st quarter of the year, 0 otherwise
D2 = 1 for 2nd quarter of the year, 0 otherwise
D3 = 1 for the 3rd quarter of the year, 0 otherwise
The regression analysis produces the following results:
Observations
R-Square
28
0.9651
Variable
Parameter
Estimate
Standard
Error
Intercept
184500
10310
T
2100
340
D1
3280
1510
D2
6250
2220
D3
7010
1580
BUSS 230 | Fall 2013-2014 | Dr. George G. Namur
Page 14 of 17
a) Is there sufficient statistical evidence of an upward trend in shoe sales?
b) Do these data indicate a statistically significant seasonal pattern of sales
for Rubax shoes? If so, what is the seasonal pattern exhibited by the
data? Carefully state the seasonal pattern, if any, and justify your
answer.
c) Using the estimated forecast equation, forecast sales of Rubax shoes for
2008Q3 and 2009Q2.
d) How would you improve this forecast equation?
BUSS 230 | Fall 2013-2014 | Dr. George G. Namur
Page 15 of 17
Problem 18
A firm experienced the demand shown in the following table:
3-Year
Exponential
Actual
Moving
Smoothing
Year
Demand
Average
(w = 0.3)
1995
800
NA
NA
1996
925
NA
1997
900
NA
1998
1,025
1999
1,150
2000
1,160
2001
1,200
2002
1,150
a) Compute the forecasts based on a 3-year moving average for 1998,
1999, 2000, 2001 and 2002.
b) Compute exponential smoothing forecasts of demand using w = 0.3 for
1996, 1997, 1998, 1999, 2000, 2001, 2002. You may begin the
exponential smoothing forecasting by assuming that the first forecast
value (F1) is equal to the actual (realized) value (A1).
c) What criterion would you use to evaluate the accuracy of these
forecasts? Write down the expression of the criterion you propose and
define the elements of the expression carefully.
d) Compute the criterion you propose in part (c) for the 3-year moving
average and the exponential smoothing forecasting methods. Which
forecasting method does better?
BUSS 230 | Fall 2013-2014 | Dr. George G. Namur
Page 16 of 17
Problem 19
The demand for tea has been estimated as
–
Where:
Q = thousands of pounds of tea sold
P = price per pound of tea
I = per capita disposable personal income in thousands of dollars
PC = price per pound of coffee
a) If next year’s tea price is forecast to be $3, per capita disposable
personal income is estimated to be $15,000 (i.e., 15), and the price per
pound of coffee is estimated to be $4, compute the expected quantity
demanded for the coming year.
b) Economic forecasters believe the probability of a major recession next
year is high and would reduce per capita income to $13,000 (13). In
addition, a frost in Brazil is likely to increase the price of coffee to $7 per
round. What impact would these changes in the economic outlook have
on the demand for tea?
BUSS 230 | Fall 2013-2014 | Dr. George G. Namur
Page 17 of 17
Problem 20
Savings-Mart (a chain of discount department stores) sells patio and lawn
furniture. Sales are seasonal, with higher sales during the spring and summer
quarters and lower sales during the fall and winter quarters. The company
developed the following quarterly sales forecasting model:
–
Where :
Ŷt
=
predicted sales ($million) in quarter t
8.25 =
quarterly sales ($ million) when t = 0
t
=
time period (quarter) where fourth quarter of 2000 = 0, first
quarter of 2001 = 1, second quarter of 2001 = 2, …
D1
=
1 for first-quarter observations, 0 otherwise
D2
=
1 for second-quarter observations, 0 otherwise
D3
=
1 for third-quarter observations, 0 otherwise
Forecast Savings-Mart’s sales of patio and lawn furniture for each quarter of
2006.