
CHEN 490 Notes Log Examples (Final), Fall 2014
American University of Beirut · Fundamentals of Petroleum Engineering · 8 pages


More CHEN 490 files
- Notes Logging (Final) · Fall 2014Final examView
- Notes Drilling Notes(Final) · Fall 2014Final examView
- Notes Final Outline · Fall 2014Final examView
- Notes Flow Equations (Final) · Fall 2014Final examView
- Notes Resevoir Engineering (Final) · Fall 2014Final examView
- Notes Rotary Drilling Hydraulics (Final) · Fall 2014Final examView
- Notes · Fall 2016NotesView
- Homework HW 6 · Fall 2014HomeworkView
Show the text of this final exam
In the late 1950’s, the sonic log gained acceptance as
areliable porosity log; its measurement responds primari-
ly to porosity and is essentially independent of saturation.
The sonic log, coupled with the focused resistivity logs
— laterolog and induction — made possible modern for-
mation evaluation from well logs. The sonic log provid-
ed a measurement of porosity; the focused resistivity logs,
a measurement of true resistivity of the noninvaded virgin
formation.
Subsequent improvements in sonic logging included the
BHC borehole compensated sonic, the LSS* long-spaced
sonic, and the Array-Sonic* tools. The latter tools per-
mit the recording of the entire sonic wavetrain. From an
analysis of the wavetrain, the shear and Stoneley transit
times can be extracted as well as the compressional tran-
sit time.
The logging of formation bulk density, another
measurement primarily dependent on formation porosi-
ty, was commercially introduced in the early 1960’s. An
FDC* compensated formation density log, which com-
pensated for the mudcake, quickly followed in 1964. In
1981, the Litho-Density* log provided an improved bulk
density measurement and a lithology-sensitive photoelec-
tric absorption cross section measurement.
The recovery of physical rock samples and formation
fluid samples with wireline tools also has a rich history.
Sidewall coring, using a hollow, cylindrical ‘‘bullet’’ shot
into the formation and retrieved by pulling it out, has
existed since 1937. Obviously, this technique has
undergone continuous improvement over the one-half
century since its introduction. For very hard rocks,
downhole mechanical coring tools exist that actually drill
out the rock samples.
In 1957, a formation tester was introduced. It recovered
a sample of the formation fluids and the pore pressure
was measured during the sampling process. The FIT for-
mation interval tester and the RFT* repeat formation
tester have followed. The older tools could make only
one pressure measurement and recover only one fluid
sample per trip into the well; the RFT tool can make an
unlimited number of pressure measurements and recover
two fluid samples per trip.
To handle those formations in which the formation
water is fresh, or varies in salinity, or in which the salini-
ty is unknown, dielectric measurements have been
developed. The EPT* electromagnetic propagation log
was introduced in 1978; the DPT* deep propagation log,
in 1985.
The preceding historical sketch has not, by any means,
covered all the measurements now made with wireline well
logging devices. Other logging measurements include
nuclear magnetic resonance, nuclear spectrometry (both
natural and induced), and numerous cased hole
parameters.
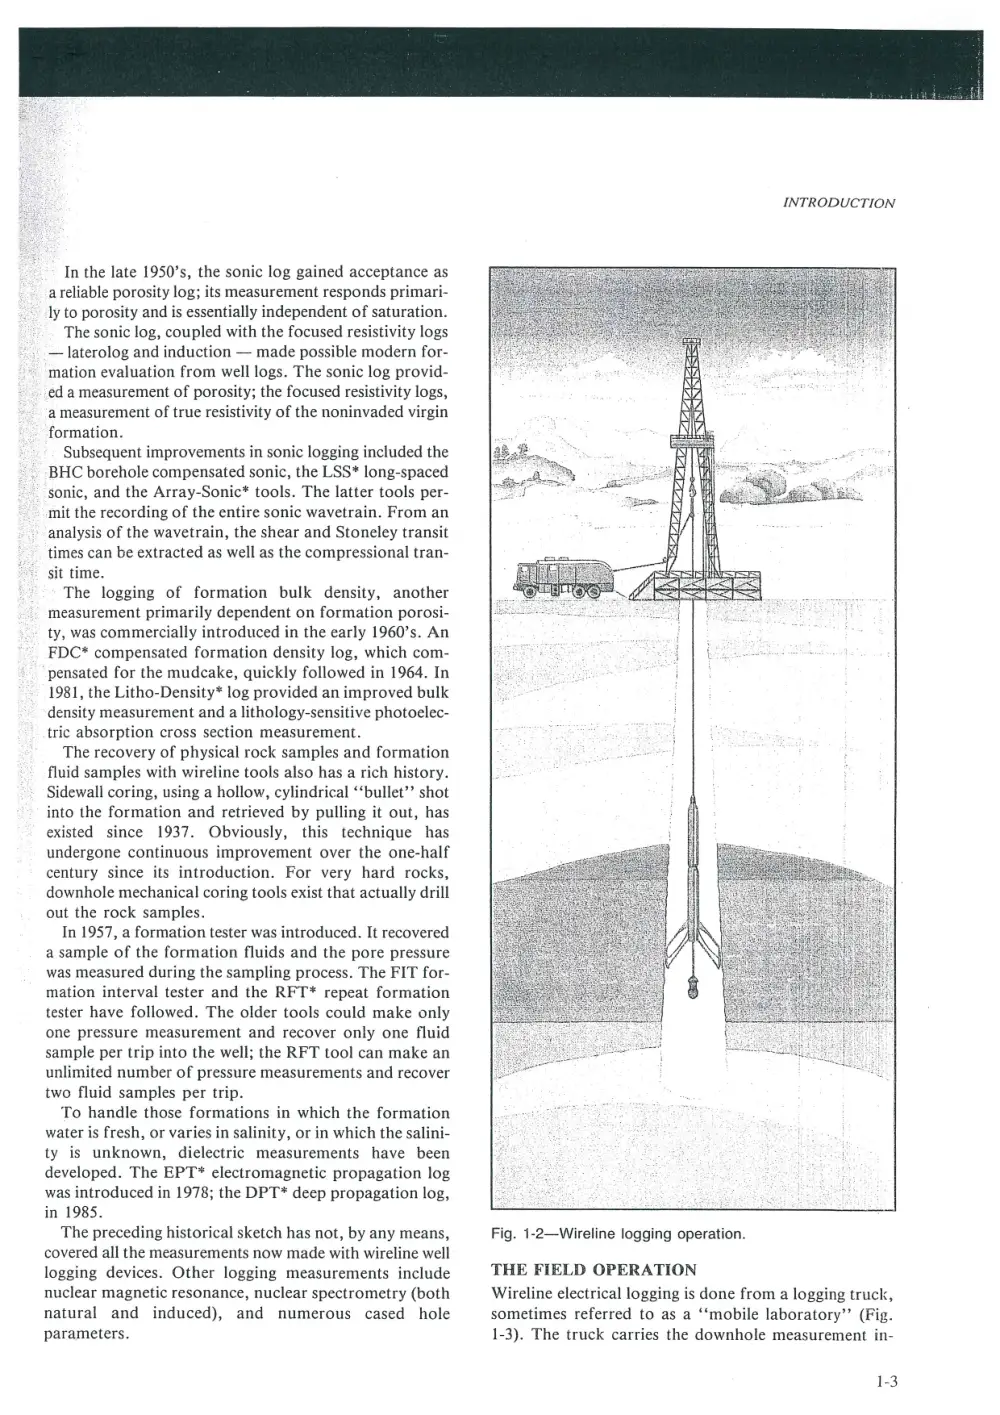
INTRODUCTION
Fig. 1-2—Wireline logging operation.
THE FIELD OPERATION
Wireline electrical logging is done from a logging truck,
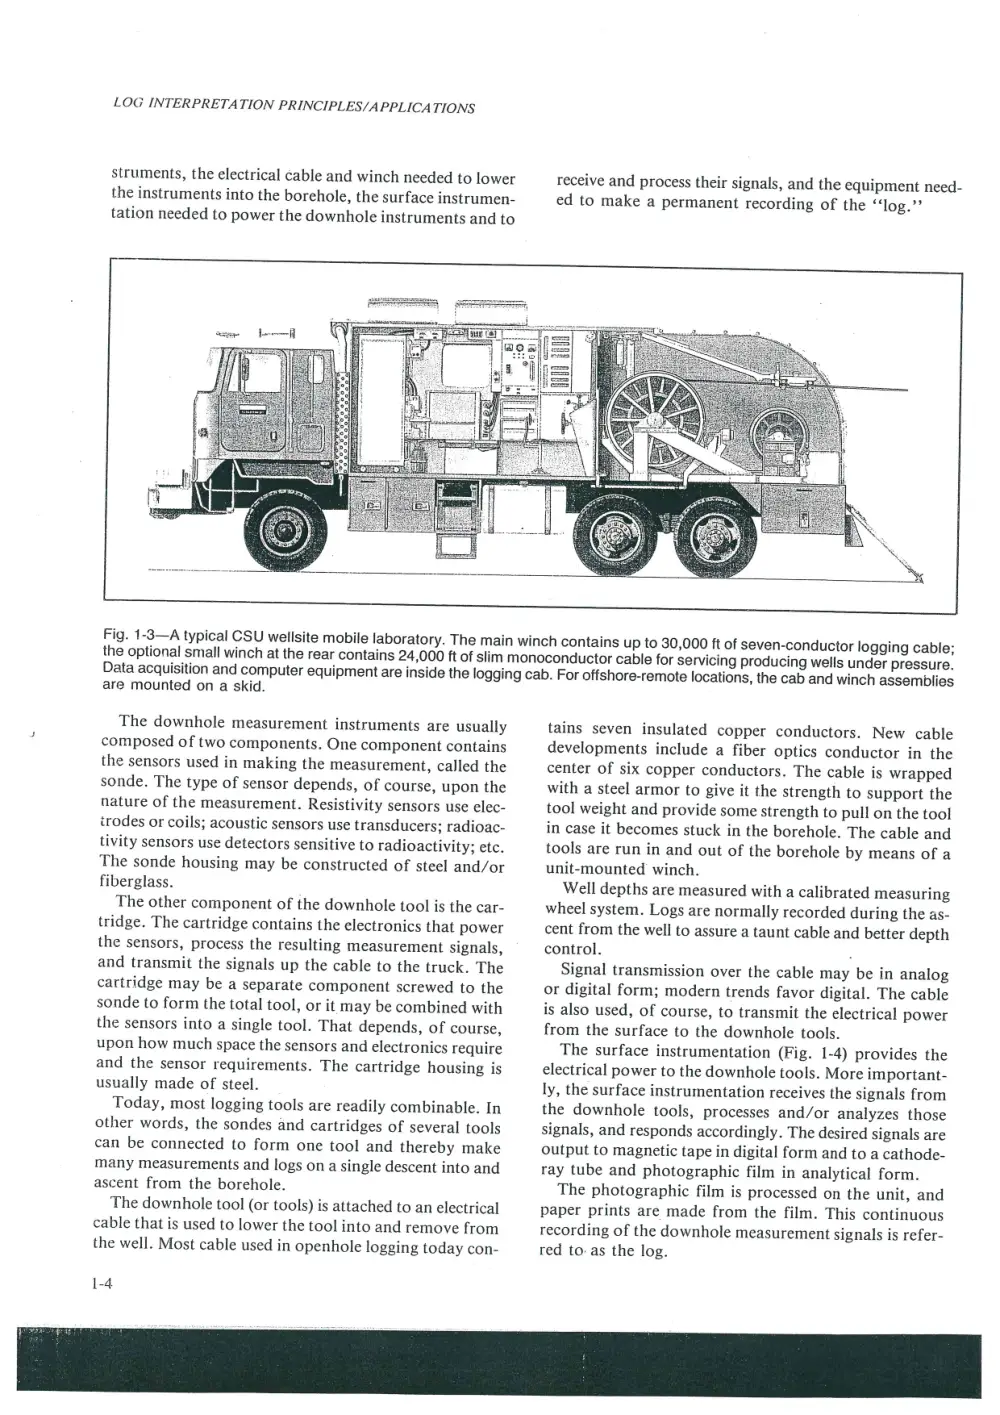
sometimes referred to as a ‘‘mobile laboratory”’ (Fig.
1-3). The truck carries the downhole measurement in-
1-3
LOG INTERPRETATION PRINCIPLES/APPLICATIONS
struments, the electrical cable and winch needed to lower
the instruments into the borehole, the surface instrumen-
tation needed to power the downhole instruments and to
receive and process their signals, and the equipment need-
ed to make a permanent recording of the ‘‘log.””
Fig. 1-3—A typical CSU wellsite mobile laboratory. The main winch contains up to 30,000 ft of seven-conductor logging cable;
the optional small winch at the rear contains 24,000 ft of slim monoconductor cable for servicing producing wells under pressure.
Data acquisition and computer equipment are inside the logging cab. For offshore-remote locations, the cab and winch assemblies
are mounted on a skid.
The downhole measurement instruments are usually
composed of two components. One component contains
the sensors used in making the measurement, called the
sonde. The type of sensor depends, of course, upon the
nature of the measurement. Resistivity sensors use elec-
irodes or coils; acoustic sensors use transducers; radioac-
tivity sensors use detectors sensitive to radioactivity; etc.
The sonde housing may be constructed of steel and/or
fiberglass.
The other component of the downhole tool is the car-
tridge. The cartridge contains the electronics that power
the sensors, process the resulting measurement signals,
and transmit the signals up the cable to the truck. The
cartridge may be a separate component screwed to the
sonde to form the total tool, or it may be combined with
the sensors into a single tool. That depends, of course,
upon how much space the sensors and electronics require
and the sensor requirements. The cartridge housing is
usually made of steel.
Today, most logging tools are readily combinable. In
other words, the sondes and cartridges of several tools
can be connected to form one tool and thereby make
many measurements and logs on a single descent into and
ascent from the borehole.
The downhole tool (or tools) is attached to an electrical
cable that is used to lower the tool into and remove from
the well. Most cable used in openhole logging today con-
1-4
tains seven insulated copper conductors. New cable
developments include a fiber optics conductor in the
center of six copper conductors. The cable is wrapped
with a steel armor to give it the strength to support the
tool weight and provide some strength to pull on the tool
in case it becomes stuck in the borehole. The cable and
tools are run in and out of the borehole by means of a
unit-mounted winch.
Well depths are measured with a calibrated measuring
wheel system. Logs are normally recorded during the as-
cent from the well to assure a taunt cable and better depth
control. .
Signal transmission over the cable may be in analog
or digital form; modern trends favor digital. The cable
is also used, of course, to transmit the electrical power
from the surface to the downhole tools.
The surface instrumentation (Fig. 1-4) provides the
electrical power to the downhole tools. More important-
ly, the surface instrumentation receives the signals from
the downhole tools, processes and/or analyzes those
signals, and responds accordingly. The desired signals are
output to magnetic tape in digital form and to a cathode-
ray tube and photographic film in analytical form.
The photographic film is processed on the unit, and
paper prints are made from the film. This continuous
recording of the downhole measurement signals is refer-
red to: as the log.
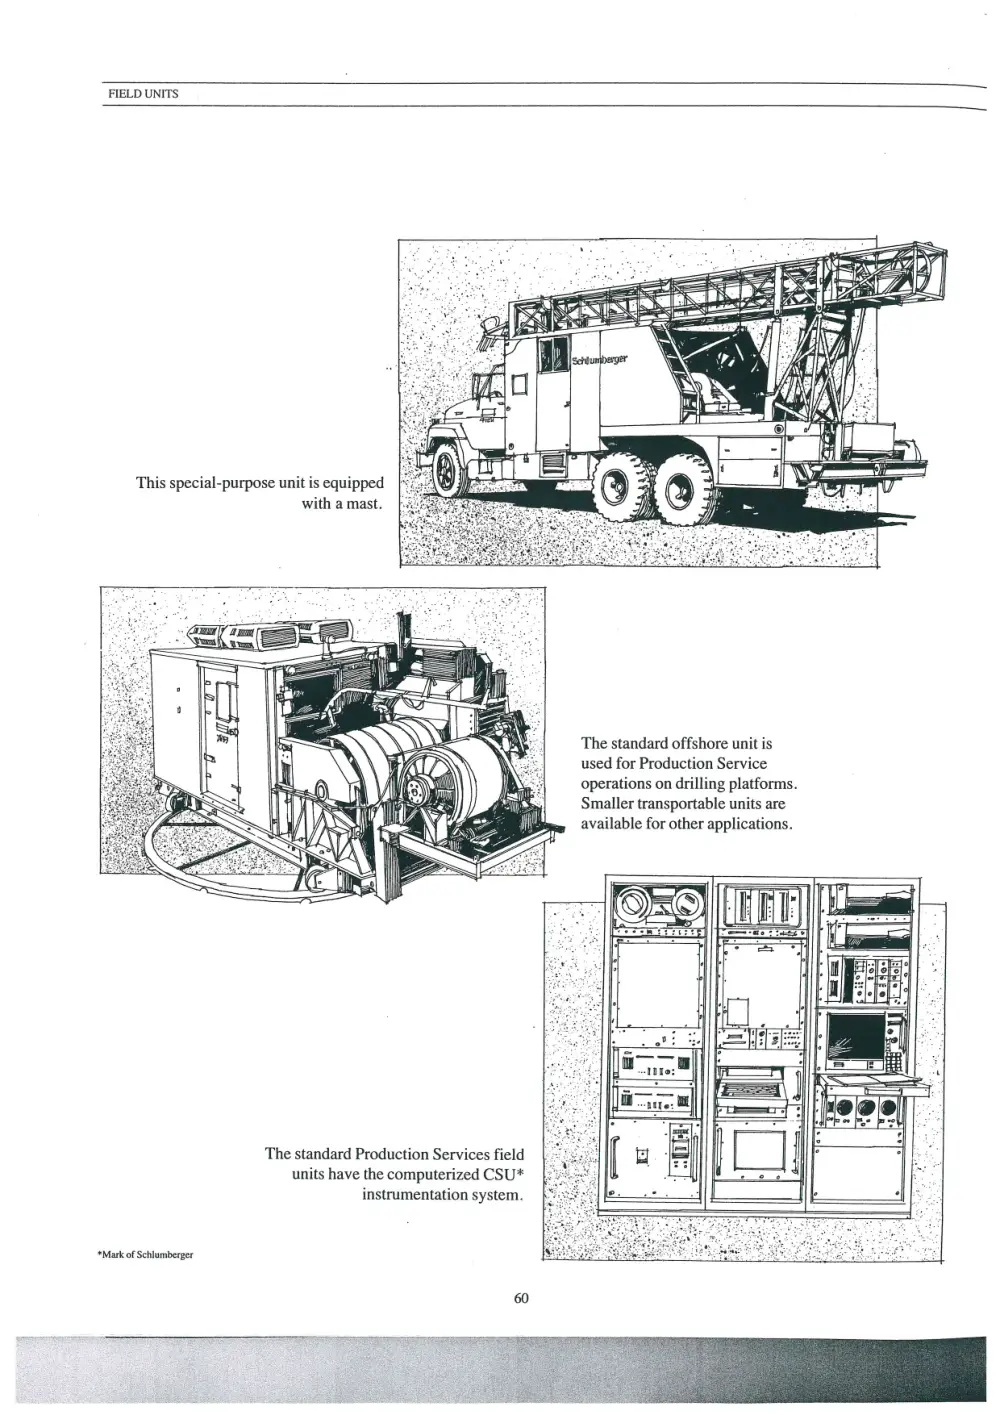
FIELD UNITS
This special-purpose unit is equipped
with a mast.
The standard offshore unit is
used for Production Service
operations on drilling platforms.
Smaller transportable units are
available for other applications.
The standard Production Services field
units have the computerized CSU*
instrumentation system.
*Mark of Schlumberger
U LEGEND
‘Loceins ENomEER_JOHN DOE __uniT wo. 100_}
arm nceco 2880 yo10.820 yom _a40_rx| Neo New Cone art weet -@uasra OLosieu FT
Ost ont sren rest fo seccnos
DATE LOGGED_5-2-55 _TO_7-3-55 ___| wR wore TURNS API CC'S:
se ERO ata | 1s Taras earn cr ore or
same sr_o000 | bo ncouae our RETURNS
Zz __AT. KB_265.5 DEPTH CORRESPONDS TO DRILL PIPE MEASUREMENTS.
—
EMERG + OL EMULSION. LOW LITHOLOGY POROSITY
J sano EEE] umestone ESSE
ag x sHace_E ==) vocomme EZ eee
24 cnert_EEEERE crane ve fain
7
a85e Lowe Famed orpamvonite SQ 9000
a =
2335 TOTALGAS seeceees METHANE —=
[DRILLING RATE. MUD ANALYSIS. CUTTINGS ANALYSIS.
Gre ren nn. Lar NS aE [THOLC OL GAS. ot GAS.
190 190. %
pag
ee
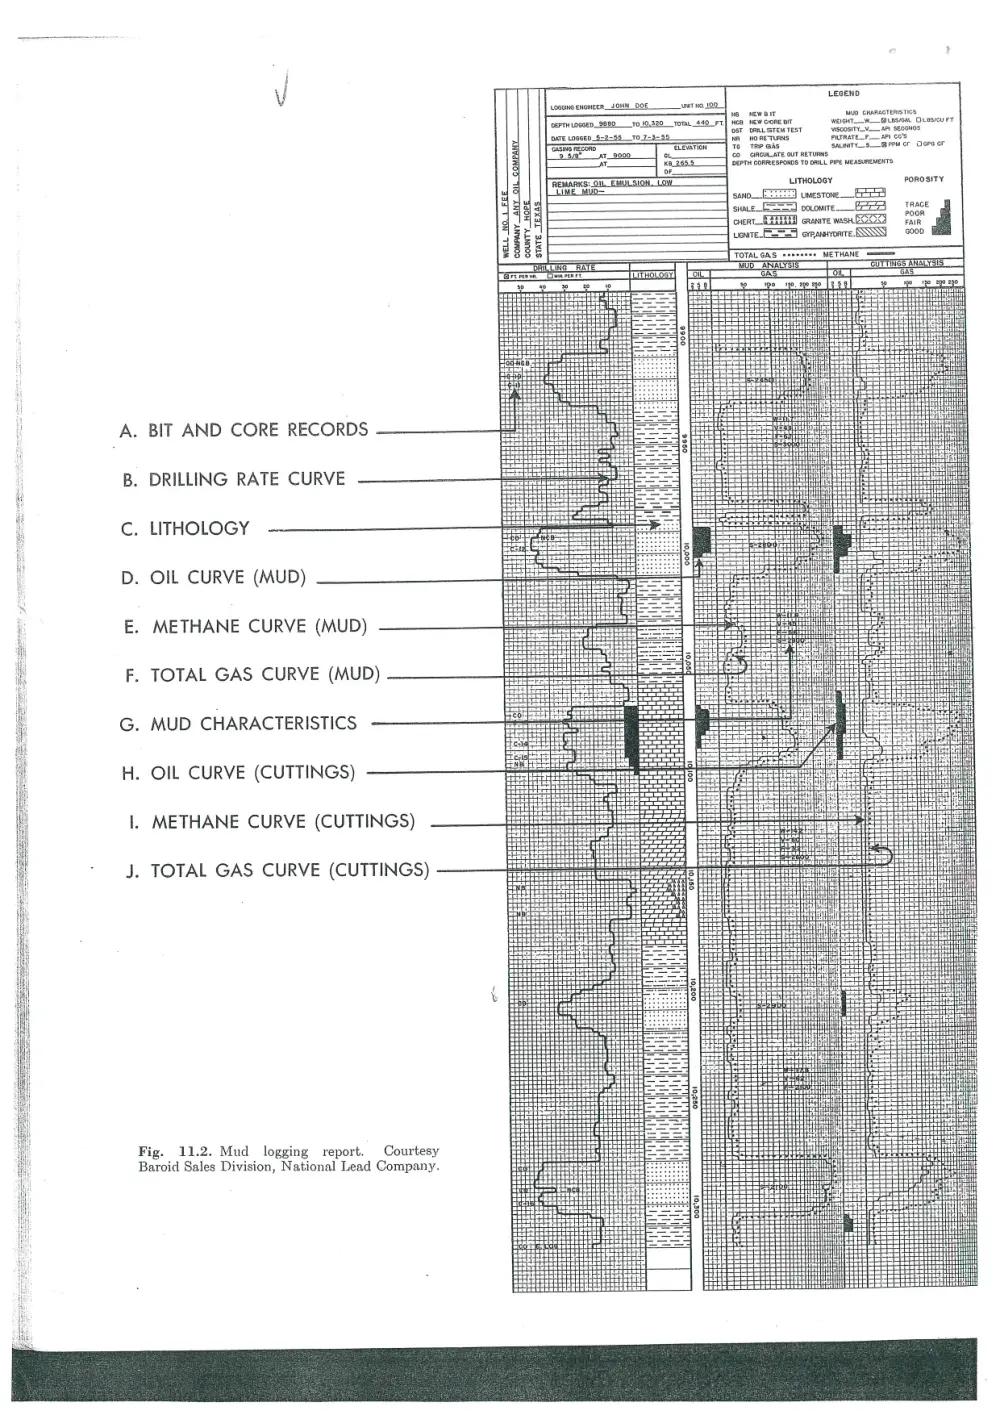
A. BIT AND CORE RECORDS
B. DRILLING RATE CURVE
C. LITHOLOGY
D. OIL CURVE (MUD)
E. METHANE CURVE (MUD)
F. TOTAL GAS CURVE (MUD)
G. MUD CHARACTERISTICS
H. OIL CURVE (CUTTINGS)
I. METHANE CURVE (CUTTINGS)
J. TOTAL GAS CURVE (CUTTINGS)
Fig. 11.2. Mud logging report. Courtesy
Baroid Sales Division, National Lead Company.
196 WELL LOGGING Vv [Chap. 11
Line in drilling operations column
Thanae Chania AT 9.00 ANAND #0O;P =) A rations.
@ phe GEOLOGRAPH, CHART moves to the left indicating that 40
7, ‘orenaton LLIN ‘O- driller got on bottom with new bit and a =
en Lease oe) started drilling at 11:26. Total trip time, ———
ee NE-MWn BE sec. 12. JEN »2W as indicated by “Trip Action”, 3 hours vs =
coun LW/COLA/ state and 17 minutes. :
aate ot toon JOS
rue on Bern: ro.orf:
omg Time DRG OPERATIONS. vores te) B This is the way a connection looks
on the Geolograph chart. The drill-
er raised the drill pipe from bottom at
12:03, broke out the kelly, picked up a
single pipe (adding it to the drilling
string), picked up the kelly and resumed
drilling. This operation required 11 min-
utes, and the driller has written the
depth of the hole, at that time, on the
chart. Thus, every connection is a con-
venient datum for determining the depth
of any drilling or down-time break,
either immediately above or below.
—
20
20
0
9:00
os
10
20 [ A 4-foot hard streak was encount-
ih 2s ered at 5,235 feet, as indicated by
: 20 the increased spacing of the foot marks
3s on this time chart.
40
4s
° D A connection was made at 5,259
lone _ feet and a vertical test was run at
this point to determine the vertical devi-
ation of the hole. The driller has noted
on the chart that the test was actually
taken at 5,250 feet and the deviation was
¥% degree. The vertical test and connec-
tion required 34 minutes.
o E Soft bed was drilled from 5,266 to
20 5,269 feet. Because of the thinness
ss of this bed, no core or drill stem test
11:00 was attempted.
a F This section represents 5 feet of
drilling. Note that every 5 feet the
base line is offset for 1 foot, making a
convenient marker for determining the
depth of significant drilling changes.
3s G Connection was made at 5,287 feet.
¥2100 Note similarity to the record at “B”.
1s H A hard streak was encountered
20 from 5,288 to 5,290 feet.
= | At 5,290 feet, the formation soft-
” ened, drilling continued to 5,300
oa feet where the driller was given orders
*e to cease drilling and circulate for
ss samples.
1:00
os
J Circulating for samples started at
6:39 as indicated by movement of
the line to the right. After circulating
for 35 minutes, samples showed stain 30
and odor, and a drill stem test was 88
ordered.
Fig. 11.1. Typical mechanical drilling log record. Courtesy Geolograph Mechanical Well
th Logging Service.
Deters L 45
OEPTH
4615
4626
4625
4630
4835 |
4640
4645
4685
4655
4666
4665
46706
4675 |
4680
4685
46396
4635
4769
4796S
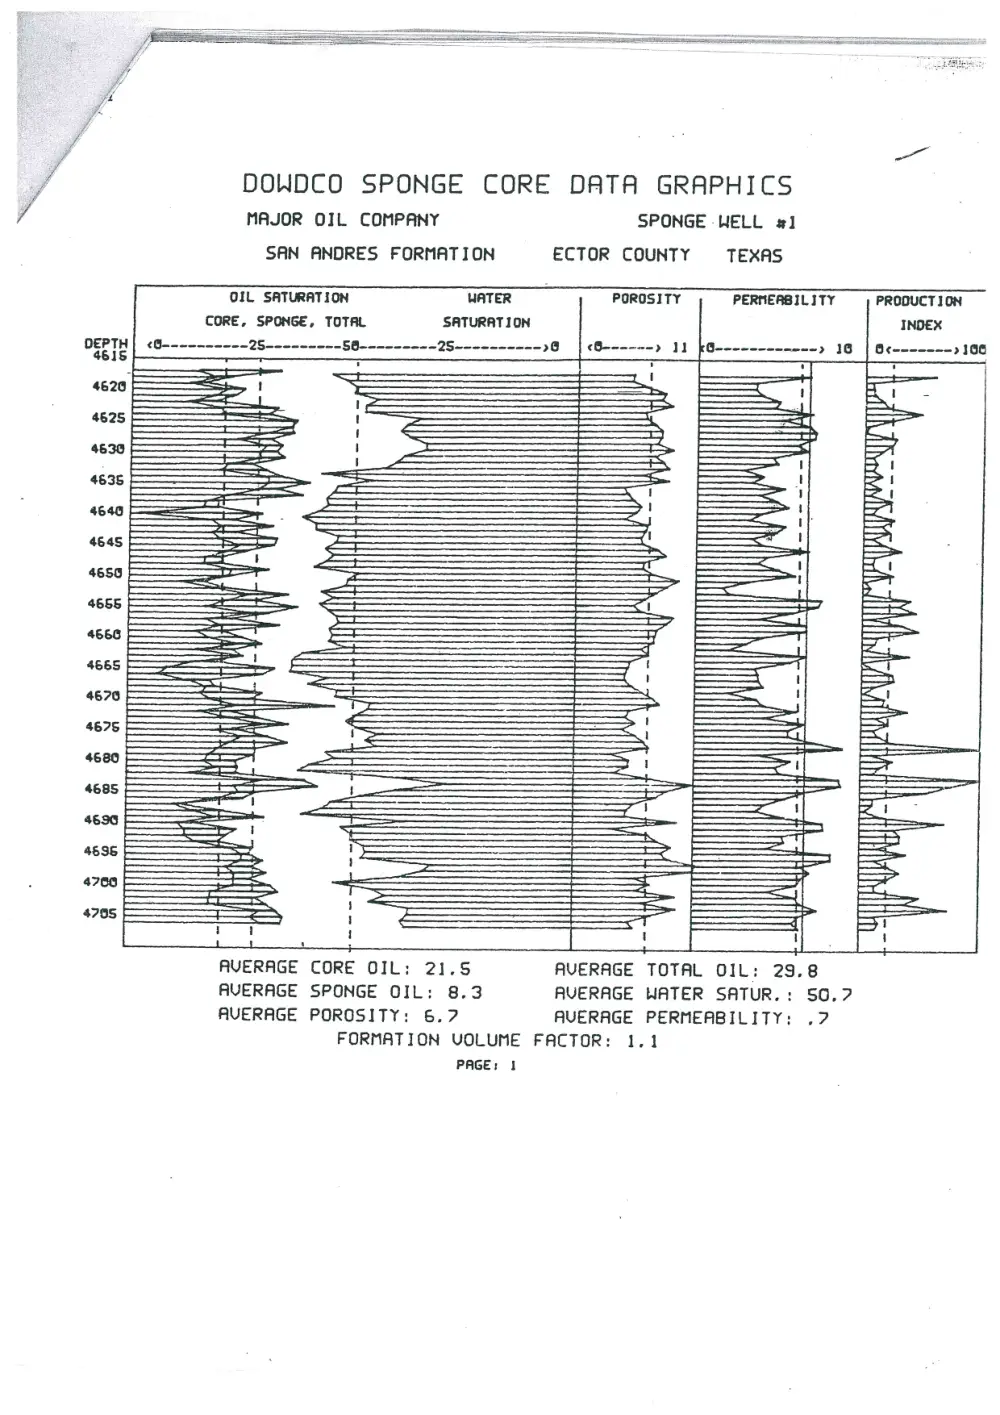
DOWDCO SPONGE CORE DATA GRAPHICS
MAJOR OIL COMPANY
SPONGE WELL #1
SAN ANDRES FORMATION ECTOR COUNTY TEXAS
OIL SATURATION WATER POROSITY PERMEABILITY PROOUCT ION
CORE, SPONGE, TOTAL SATURATION INDEX
<G---------- 2G---- 2 S6--------— 2S~--------- 28 6¢------- 2106
— 7 7 —
—= 1 a
——
|
|
|
Wy
—_-
=
i
t--lH
AVERAGE CORE OIL: 21.5
AVERAGE SPONGE OIL: 8.3
AVERAGE POROSITY: 6.7
FORMATION VOLUME FACTOR:
PAGE: 1
AVERAGE TOTAL OIL: 29.8
RVERAGE WATER SATUR. :
AVERAGE PERMEABILITY:
1,1
$0.7
.?
d
ments of rock properties, such as those obtained from down-
hole logs, pressure build-up analysis and seismic surveys. In
general, however, these formation evaluation techniques
yield average properties over several feet to several hundred
feet of vertical section. All can determine properties at a
greater distance from the wellbore than seen by a single core,
but none yields as detailed information on vertical section
properties and heterogeneity as may be obtained from core
studies. In fact, gathering core data enhances the under-
standing of response in these other important formation
study tools.
Thick formations of constant and known chemical compo-
sition that have undergone little alteration after deposition,
that contain no mineral impurities within the pore space, or
that have water of constant salinity, can likely be evaluated
adequately without cores for completion purposes or to de-
termine oil-in-place. Unfortunately, this ideal case is seldom
encountered in the real world, and core data are still re-
quired to evaluate subsequent improved recovery schemes.
CONSIDERATIONS PRIOR TO CORING
When sampling a particular reservoir, coring operation
objectives should be clearly defined and established early.
These objectives influence the type of core to be cut, its size,
coring fluid to be used and the analysis to follow. Most cor-
ing devices require that a coring point be predetermined so
that the tool may be attached to the bottom of the drillstring.
Unless a total section in the well is to be cored, some geologic
control is required. Otherwise, data such as gas shows, oil
shows or drilling breaks supplied by a hydrocarbon well log-
ger are used to indicate the coring point.
One type of wireline coring tool allows a center plug to be
recovered from the drill bit so that coring can be done at any
selected depth. Another tool allows recovered cores to be
spatially oriented, while others allow reservoir pressure to be
maintained during core recovery. All of these, run at the bot-
tom of the drillstring, supply a continuous vertical section of
core from 2 to 8 in. in diameter from which needed informa-
tion may be derived.
Percussion sidewall and the sidewall drilled cores now un-
der development have a unique advantage in that coring
points are selected after the well is drilled and downhole logs
have been run to identify zones of interest. Unfortunately,
these devices do not furnish a continuous core, since they
sample small portions of the reservoir at selected intervals:
While they are of tremendous value in formation evaluation
and for petrographic studies, alteration of percussion side-
wall cores makes them unsuitable for the special core analysis
tests that furnish hard engimeering data. It is anticipated,
however, that tools such as the new sidewall device designed
to drill 1-in.-diameter core¥ at right angles to the wellbore
will overcome this latter limitation.
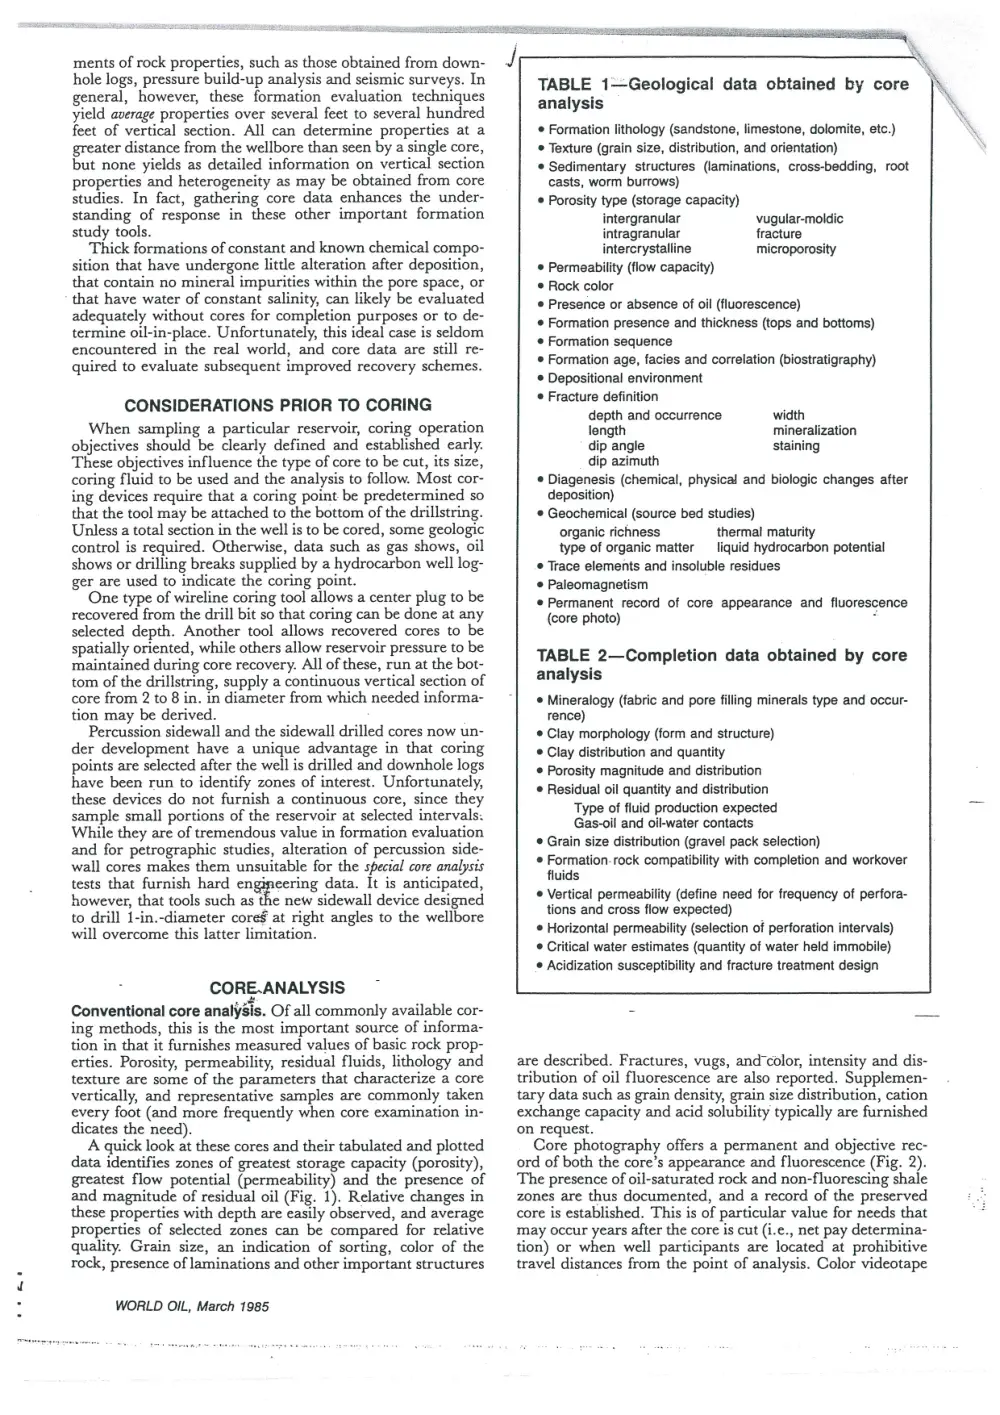
. CORE.ANALYSIS
Conventional core analysis. Of all commonly available cor-
ing methods, this is the most important source of informa-
tion in that it furnishes measured values of basic rock prop-
erties. Porosity, permeability, residual fluids, lithology and
texture are some of the parameters that characterize a core
vertically, and representative samples are commonly taken
every foot (and more frequently when core examination in-
dicates the need).
A quick look at these cores and their tabulated and plotted
data identifies zones of greatest storage capacity (porosity),
greatest flow potential (permeability) and the presence of
and magnitude of residual oil (Fig. 1). Relative changes in
these properties with depth are easily observed, and average
properties of selected zones can be compared for relative
quality. Grain size, an indication of sorting, color of the
rock, presence of laminations and other important structures
WORLD OIL, March 1985
cae,
TABLE 1—Geological data obtained by core
analysis
e Formation lithology (sandstone, limestone, dolomite, etc.)
Texture (grain size, distribution, and orientation)
¢ Sedimentary structures (laminations, cross-bedding, root
casts, worm burrows)
Porosity type (storage capacity)
intergranular
intragranular
intercrystalline
© Permeability (flow capacity)
© Rock color
© Presence or absence of oil (fluorescence)
© Formation presence and thickness (tops and bottoms)
© Formation sequence
© Formation age, facies and correlation (biostratigraphy)
© Depositional environment
¢ Fracture definition
vugular-moldic
fracture
microporosity
depth and occurrence width
length mineralization
dip angle staining
dip azimuth
© Diagenesis (chemical, physical and biologic changes after
deposition)
© Geochemical (source bed studies)
organic richness thermal maturity
type of organic matter —_ liquid hydrocarbon potential
© Trace elements and insoluble residues
e@ Paleomagnetism
© Permanent record of core appearance and fluorescence
(core photo) .
TABLE 2—Completion data obtained by core
analysis
© Mineralogy (fabric and pore filling minerals type and occur-
rence)
© Clay morphology (form and structure)
® Clay distribution and quantity
© Porosity magnitude and distribution
¢ Residual oil quantity and distribution
Type of fluid production expected
Gas-oil and oil-water contacts
® Grain size distribution (gravel pack selection)
© Formation-rock compatibility with completion and workover
fluids
¢ Vertical permeability (define need for frequency of perfora-
tions and cross flow expected)
© Horizontal permeability (selection of perforation intervals)
© Critical water estimates (quantity of water held immobile)
¢ Acidization susceptibility and fracture treatment design
\
are described. Fractures, vugs, and°color, intensity and dis-
tribution of oil fluorescence are also reported. Supplemen-
tary data such as grain density, grain size distribution, cation
exchange capacity and acid solubility typically are furnished
on request.
Core photography offers a permanent and objective rec-
ord of both the core’s appearance and fluorescence (Fig. 2).
The presence of oil-saturated rock and non-fluorescing shale
zones are thus documented, and a record of the preserved
core is established. This is of particular value for needs that
may occur years after the core is cut (i.e., net pay determina-
tion) or when well participants are located at prohibitive
travel distances from the point of analysis. Color videotape
4665
4670
4675 |
4680 |
4685 |
46390
4635
4760
$7958
DOWDCO SPONGE CORE DATA GRAPHICS
MAJOR OIL COMPANY
SAN ANDRES FORMATION
SPONGE WELL #1
ECTOR COUNTY TEXAS
WATER
SATURATION
OIL SATURATION
CORE, SPONGE, TOTAL
POROSITY
PERMEABILITY
PRODUCTION
HH
ee a
a !
4 =H
AVERAGE CORE OIL: 21.5
AVERAGE SPONGE OIL: 8.3
AVERAGE POROSITY: 6.7
FORMATION VOLUME
PAGE: 1
AVERAGE TOTAL OIL: 29.8
AVERAGE WATER SATUR. :
AVERAGE PERMEABILITY:
FACTOR: 1.1
so.?
2?