
CHEN 490 Notes Logging (Final), Fall 2014
American University of Beirut · Fundamentals of Petroleum Engineering · 16 pages



Showing the first 10 of 16 pages. Download the PDF to see all of it.
More CHEN 490 files
- Notes Log Examples (Final) · Fall 2014Final examView
- Notes Drilling Notes(Final) · Fall 2014Final examView
- Notes Final Outline · Fall 2014Final examView
- Notes Flow Equations (Final) · Fall 2014Final examView
- Notes Resevoir Engineering (Final) · Fall 2014Final examView
- Notes Rotary Drilling Hydraulics (Final) · Fall 2014Final examView
- Notes · Fall 2016NotesView
- Homework HW 6 · Fall 2014HomeworkView
Show the text of this final exam
11 21
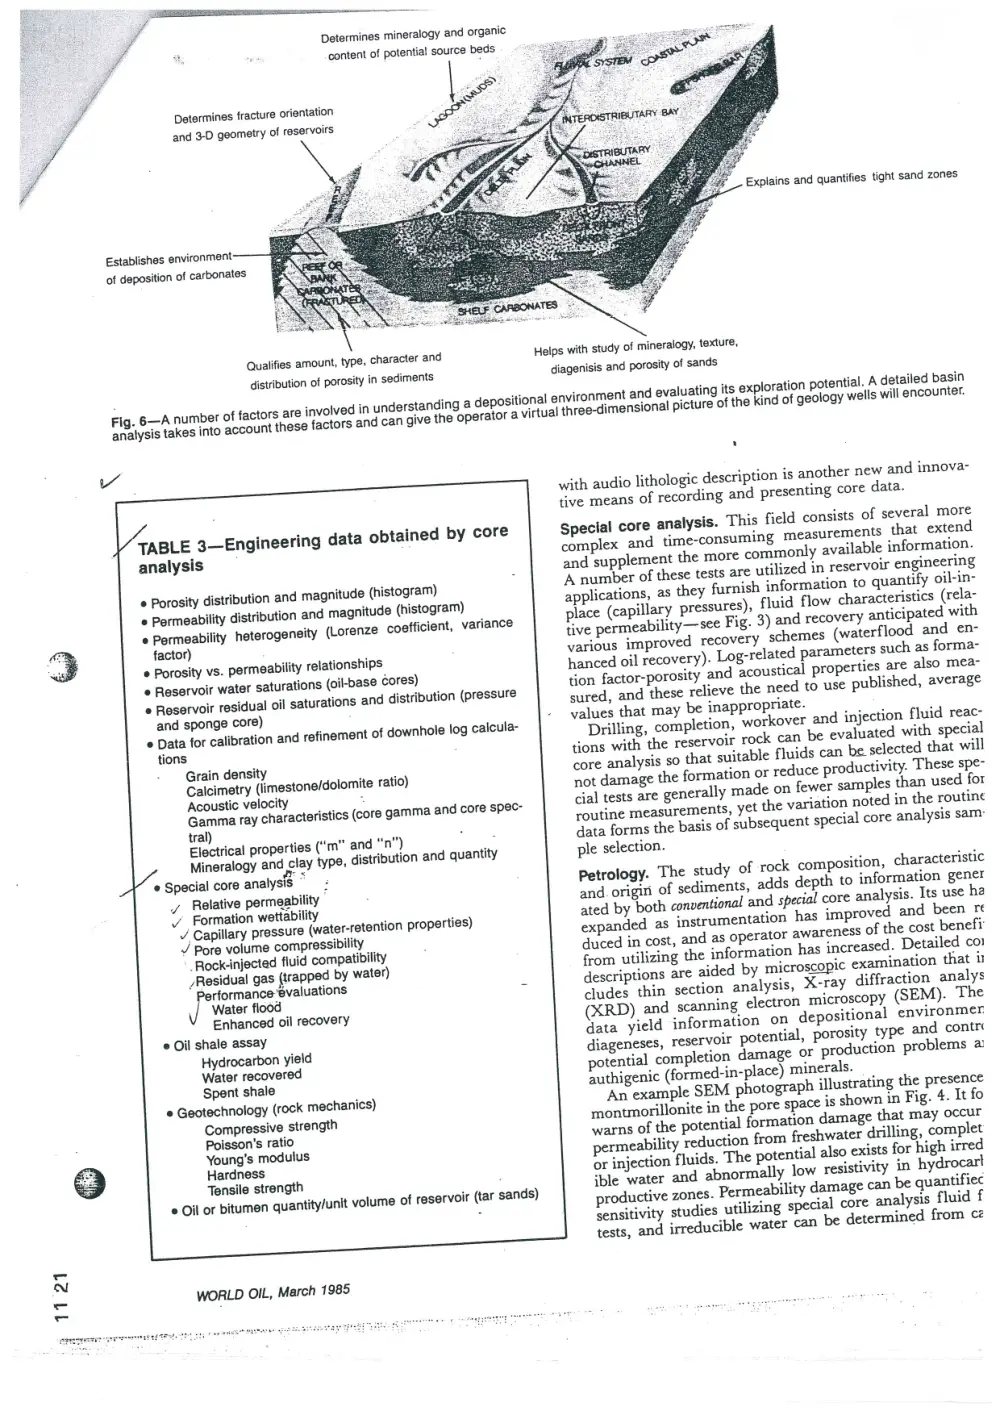
Determines fracture orientation
and 3-D geometry of reservoirs
\G
Establishes environment:
of deposition of carbonates
Qualifies amount, type, character and
distribution of porosity in sediments
Fig. 6—A number of factors are involved in understanding a depo:
analysis takes into account these factors and can give the operator a virtual three-dimensional
a
TABLE 3—Engineering data obtained by core
analysis :
© Porosity distribution and magnitude (histogram)
e Permeability distribution and magnitude (histogram)
e Permeability heterogeneity (Lorenze coefficient, variance
factor)
® Porosity vs. permeability relationships
e Reservoir water saturations (oil-base cores)
Reservoir residual oil saturations and distribution (pressure
and sponge core) i
Data for calibration and refinement of downhole log calcula-
tions
Grain density
Calcimetry (limestone/dolomite ratio)
Acoustic velocity A
Gamma ray characteristics (core gamma and core spec-
tral)
Electrical properties (‘m" and “n") -
Mineralogy and clay type, distribution and quantity
e Special core analysis ~
Relative permeability
Formation wettability
/ Capillary pressure (water-retention properties)
J Pore volume compressibility
-Rock-injected fluid compatibility
/Residual gas {trapped by water)
erformance evaluations
Water flood
Enhanced oil recovery
e Oil shale assay
Hydrocarbon yield
Water recovered
Spent shale
Geotechnology (rock mechanics)
Compressive strength
Poisson's ratio
Young’s modulus
Hardness
Tensile strength
Oil or bitumen quantity/unit volume of reservoir (tar sands)
WORLD OIL, March 1985
aa
Explains and quantifies tight sand zones
Helps with study of mineralogy, texture,
diagenisis and porosity of sands
sitional environment and evaluating its exploration potential. A detailed basin
| picture of the kind of geology wells will encounter.
with audio lithologic description is another new and innova-
tive means of recording and presenting core data.
Special core analysis. This field consists of several more
complex and time-consuming measurements that extend
and supplement the more commonly available information.
A number of these tests are utilized in reservoir engineering
applications, as they furnish information to quantify oil-in-
place (capillary pressures), fluid flow characteristics (rela-
tive permeability —see Fig. 3) and recovery anticipated with
various improved recovery schemes (waterflood and en-
hanced oil recovery). Log-related parameters such as forma-
tion factor-porosity and acoustical properties are also mea-
sured, and these relieve the need to use published, average
values that may be inappropriate.
Drilling, completion, ‘workover and injection fluid reac-
tions with the reservoir rock can be evaluated with special
core analysis so that suitable fluids can be selected that will
not damage the formation or reduce productivity. These spe-
cial tests are generally made on fewer samples than used for
routine measurements, yet the variation noted in the routine
data forms the basis of subsequent special core analysis sam:
ple selection.
Petrology. The study of rock composition, characteristic
and. origin of sediments, adds depth to information gener
ated by both conventional and special core analysis. Its use ha
expanded as instrumentation has improved and been re
duced in cost, and as operator awareness of the cost benef
from utilizing the information has increased. Detailed cor
descriptions are aided by microscopic examination that ii
cludes thin section analysis, X-ray diffraction analys
(XRD) and scanning electron microscopy (SEM). The
data yield information on depositional environmen
diageneses, reservoir potential, porosity type and contr‘
potential completion damage OF production problems a!
authigenic (formed-in-place) minerals.
An example SEM photograph illustrating the presence
montmorillonite in the pore space is shown in Fig. 4. It fo
warns of the potential formation damage that may occur
permeability reduction from freshwater drilling, complet
or injection fluids. The potential also exists for high irred
ible water and abnormally low resistivity in hydrocarl
productive zones. Permeability damage can be quantifiec
sensitivity studies utilizing special core analysis fluid f
tests, and irreducible water can be determined from cz
1121
_ aiaiperpmeresrmrorresemas mses ae
Determines mineralogy and organic
content of potential source beds
Determines fracture orientation Se
and 3-D geometry of reservoirs 3
Establishes environment
of deposition of carbonates
Qualifies amount, type. character and
distribution of porosity in sediments
analysi
v
TABLE 3—Engineering data obtained by core
analysis
© Porosity distribution and magnitude (histogram)
e Permeability distribution and magnitude (histogram)
e Permeability heterogeneity (Lorenze coefficient, variance
factor)
Porosity vs. permeability relationships
e Reservoir water saturations (oil-base cores)
Reservoir residual oil saturations and distribution (pressure
and sponge core)
Data for calibration and refinement of downhole log calcula-
tions
Grain density
Calcimetry (limestone/dolomite ratio)
Acoustic velocity f
Gamma ray characteristics (core gamma and core spec-
tral)
Electrical properties (‘m" and “n”) -
Mineralogy and clay type, distribution and quantity
e Special core analysis .
_/ Relative permeability
VY Formation wettability
/ Capillary pressure (water-retention properties)
/ Pore volume compressibility
Rock-injected fluid compatibility
/Residual gas (trapped by water)
Performance evaluations -
Water flood
Enhanced oil recovery
e Oil shale assay
Hydrocarbon yield
Water recovered
Spent shale
Geotechnology (rock mechanics)
Compressive strength
Poisson's ratio
Young’s modulus
Hardness
Tensile strength
e Oil or bitumen quantity/unit volume of reservoir (tar sands)
WORLD OIL, March 1985
Explains and quantifies tight sand zones
Helps with study of mineralogy, texture,
diagenisis and porosity of sands
Fig. 6—A number of factors are involved in understanding a depositional environment and evaluating its exploration potential. A detailed basin
s takes into account these factors and can give the operator a virtual three-dimensional picture of the kind of geology wells will encounter.
with audio lithologic description is another new and innova-
tive means of recording and presenting core data.
Special core analysis. This field consists of several more
complex and time-consuming measurements that extend
and supplement the more commonly available information.
A number of these tests are utilized in reservoir engineering
applications, as they furnish information to quantify oil-in-
place (capillary pressures); fluid flow characteristics (rela-
tive permeability—see Fig. 3) and recovery anticipated with
various improved recovery schemes (waterflood and en-
hanced oil recovery). Log-related parameters such as forma-
tion factor-porosity and acoustical properties are also mea-
sured, and these relieve the need to use published, average
values that may be inappropriate.
Drilling, completion, workover and injection fluid reac-
tions with the reservoir rock can be evaluated with special
core analysis so that suitable fluids can be selected that will
not damage the formation or reduce productivity. These spe-
cial tests are generally made on fewer samples than used for
routine measurements, yet the variation noted in the routine
data forms the basis of subsequent special core analysis sam:
ple selection.
Petrology. The study of rock composition, characteristic
and. origin of sediments, adds depth to information gener
ated by both conventional and special core analysis. Its use ha
expanded as instrumentation has improved and been re
duced in cost, and as operator awareness of the cost benefir
from utilizing the information has increased. Detailed con
descriptions are aided by microscopic examination that
cludes thin section analysis, X-ray diffraction analys
(XRD) and scanning electron microscopy (SEM). The
data yield information on depositional environmer
diageneses, reservoir potential, porosity type and contri
potential completion damage or production problems a!
authigenic (formed-in-place) minerals.
An example SEM photograph illustrating the presence
montmorillonite in the pore space is shown in Fig. 4. It fo
warns of the potential formation damage that may occur
permeability reduction from freshwater drilling, complet
or injection fluids. The potential also exists for high irred
ible water and abnormally low resistivity in hydrocart
productive zones. Permeability damage can be quantifiec
sensitivity studies utilizing special core analysis fluid f
tests, and irreducible water can be determined from cz
vl
ments of rock properties, such as those obtained from down-
hole logs, pressure build-up analysis and seismic surveys. In
general, however, these formation evaluation techniques
yield average properties over several feet to several hundred
feet of vertical section. All can determine properties at a
greater distance from the wellbore than seen by a single core,
but none yields as detailed information on vertical section
properties and heterogeneity as may be obtained from core
studies. In fact, gathering core data enhances the under-
standing of response in these other important formation
study tools.
Thick formations of constant and known chemical compo-
sition that have undergone little alteration after deposition,
that contain no mineral impurities within the pore space, or
that have water of constant salinity, can likely be evaluated
adequately without cores for completion purposes or to de-
termine oil-in-place. Unfortunately, this ideal case is seldom
encountered in the real world, and core data are still re-
quired to evaluate subsequent improved recovery schemes.
CONSIDERATIONS PRIOR TO CORING
When sampling a particular reservoir, coring operation
objectives should be clearly defined and established early.
These objectives influence the type of core to be cut, its size,
coring fluid to be used and the analysis to follow. Most cor-
ing devices require that a coring point be predetermined so
that the tool may be attached to the bottom of the drillstring.
Unless a total section in the well is to be cored, some geologic
control is required. Otherwise, data such as gas shows, oil
shows or drilling breaks supplied by a hydrocarbon well log-
ger are used to indicate the coring point.
One type of wireline coring tool allows a center plug to be
recovered from the drill bit so that coring can be done at any
selected depth. Another tool allows recovered cores to be
spatially oriented, while others allow reservoir pressure to be
maintained during core recovery. All of these, run at the bot-
tom of the drillstring, supply a continuous vertical section of
core from 2 to 8 in. in diameter from which needed informa-
tion may be derived.
Percussion sidewall and the sidewall drilled cores now un-
der development have a unique advantage in that coring
points are selected after the well is drilled and downhole logs
have been run to identify zones of interest. Unfortunately,
these devices do not furnish a continuous core, since they
sample small portions of the reservoir at selected intervals.
While they are of tremendous value in formation evaluation
and for petrographic studies, alteration of percussion side-
wall cores makes them unsuitable for the special core analysis
tests that furnish hard engineering data. It is anticipated,
however, that tools such as the new sidewall device designed
to drill 1-in.-diameter core§ at right angles to the wellbore
will overcome this latter limitation.
. CORE.ANALYSIS
Conventional core analySis. Of all commonly available cor-
ing methods, this is the most important source of informa-
tion in that it furnishes measured values of basic rock prop-
erties. Porosity, permeability, residual fluids, lithology and
texture are some of the parameters that characterize a core
vertically, and representative samples are commonly taken
every foot (and more frequently when core examination in-
dicates the need).
A quick look at these cores and their tabulated and plotted
data identifies zones of greatest storage capacity (porosity),
greatest flow potential (permeability) and the presence of
and magnitude of residual oil (Fig. 1). Relative changes in
these properties with depth are easily observed, and average
properties of selected zones can be compared for relative
quality. Grain size, an indication of sorting, color of the
rock, presence of laminations and other important structures
WORLD OIL, March 1985
TABLE 1—Geological data obtained by core
analysis
¢ Formation lithology (sandstone, limestone, dolomite, etc.)
Texture (grain size, distribution, and orientation)
© Sedimentary structures (laminations, cross-bedding, root
casts, worm burrows)
Porosity type (storage capacity)
intergranular
intragranular
intercrystalline
© Permeability (flow capacity)
© Rock color
e Presence or absence of oil (fluorescence)
e Formation presence and thickness (tops and bottoms)
© Formation sequence
© Formation age, facies and correlation (biostratigraphy)
© Depositional environment
¢ Fracture definition
vugular-moldic
fracture
microporosity
depth and occurrence width
length mineralization
dip angle staining
dip azimuth
© Diagenesis (chemical, physical and biologic changes after
deposition)
© Geochemical (source bed studies)
organic richness thermal maturity
type of organic matter —_ liquid hydrocarbon potential
© Trace elements and insoluble residues
@ Paleomagnetism
Permanent record of core appearance and fluorescence
(core photo) -
TABLE 2—Completion data obtained by core
analysis
© Mineralogy (fabric and pore filling minerals type and occur-
rence)
© Clay morphology (form and structure)
© Clay distribution and quantity
© Porosity magnitude and distribution
¢ Residual oil quantity and distribution
Type of fluid production expected
Gas-oil and oil-water contacts
® Grain size distribution (gravel pack selection)
© Formation-rock compatibility with completion and workover
fluids
¢ Vertical permeability (define need for frequency of perfora-
tions and cross flow expected)
© Horizontal permeability (selection of perforation intervals)
© Critical water estimates (quantity of water held immobile)
¢ Acidization susceptibility and fracture treatment design
are described. Fractures, vugs, and color, intensity and dis-
tribution of oil fluorescence are also reported. Supplemen-
tary data such as grain density, grain size distribution, cation
exchange capacity and acid solubility typically are furnished
on request.
Core photography offers a permanent and objective rec-
ord of both the core’s appearance and fluorescence (Fig. 2).
The presence of oil-saturated rock and non-fluorescing shale
zones are thus documented, and a record of the preserved
core is established. This is of particular value for needs that
may occur years after the core is cut (i.e., net pay determina-
tion) or when well participants are located at prohibitive
travel distances from the point of analysis. Color videotape
—
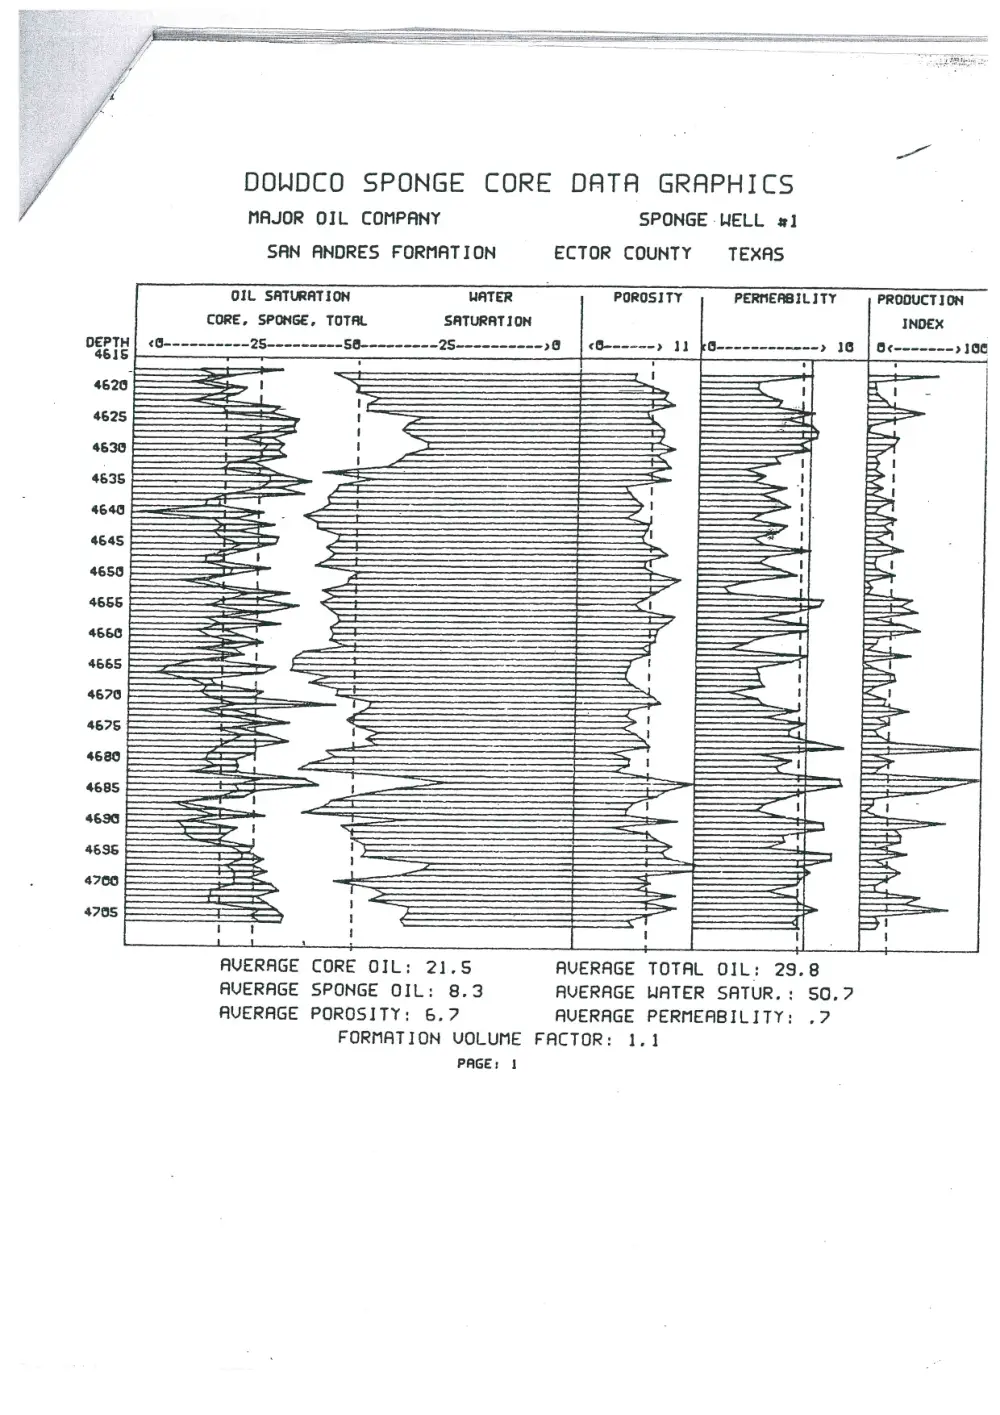
DOWDCO SPONGE CORE DATA GRAPHICS
MAJOR OIL COMPANY SPONGE WELL #1
SAN ANDRES FORMATION ECTOR COUNTY TEXAS
OIL SATURATION WATER POROSITY PERMEABILITY PRODUCTION
CORE, SPONGE, TOTAL SATURATION | INDEX
DEPTH} <G@---------- 2$--------- @ | «Q------» 1] ’G----------~- > 16 | O¢------- 2106
4615 ay “. ; ;
<2 |
46625
|
i)
|
|
|
H
|
i
|
Ht
:
==
=
=F
==
=
ia
fe me we
1 L 2
AVERAGE CORE OIL: 21.5
AVERAGE SPONGE OIL: 8.3
AVERAGE POROSITY: 6.7
FORMATION VOLUME FACTOR:
PAGE: 1
LL +
AVERAGE TOTAL OIL: 29.8
AVERAGE WATER SATUR.: 50.7
AVERAGE PERMEABILITY: .?
isl
ancl
M weet
fi
a Oh
tw ane -
| USE FOR ANSWER
rT
=
\* ube
FOR ANSWER
|
her S|
|
|
ip
aa
bat
rsa
faut
S|
> |
ogee
\
iat
chet ater
Wn eee va Ge
an
oh
rapa
5
fom $
( Bo
\S ola fe
es
Tho
wily Aha
UW
Caw b
3
ues
alti xt
Re
is Waed fo lis!
Ape
Pe
ro RE)
nid 2g
Bg
SpAst:
'
MELGCAESO RTT
ey
Ve wes sh
Hapa gg ape: rat fs
ae “Patsy Ss an co | cy [_
“peg oe be a a REG 7
2 Tistiaty Sf | = cl va: +31 tel
ifehs gsr eee ey Hf
f ea nl ) | |
Tiel | |i
ron _|
rt
EH
ried
fo siinabaty | aoc 04 9)
> Obtew
Sy,
R
0
| is Nepyeng |
1 | | | \.1 .
| | | |
i | i r
ce eee co
vr ts i
PCR AAW lon
| r =
|
weber hare \\
—
“IZ AL ede, tk
WoW KWo
“pp
ne agente ae
Piet Teehas
<alions ye
Wihtoe
Z
Z|
ll —_ 1 |
im FOR ANSWER
| 25 _2- The. therium Senes |_|
1a 4- “The naw Senes | | Cc Cer Coco |
| T_T
| | | |
TA
J Pa “the pot ss tum Hotep
ap Lae
CI Percfeteapuscisas canter traces a ie
| Selle a, a5 a cnsegrenta, eet méassobl ingercsareaee
—] ES 5 Qywe Si ive Saasty af Ath we vodldelion, wo Et