
DCSN 200 Final, Fall 2004
American University of Beirut · Managerial Decision Making · 14 pages


Showing the first 10 of 14 pages. Download the PDF to see all of it.
More DCSN 200 files
- Final · Spring 2011Final examView
- Final · Fall 2009Final examView
- Final · Spring 2003Final examView
- Other SAMPLE · Spring 2019FileView
- Homework Solution Assignment 5 · Spring 2013Homework · with solutionView
- Syllabus · Spring 2011LabView
- Midterm Spring 2011 · Spring 2011ExamView
- Lecture Chapter 8 · Fall 2011LabView
Show the text of this final exam
0h
Question 1. (15
{ac SW TOS
AMERICAN UNIVERSITY OF BEIRUT
Suliman S, Olayan School of Business
OPIM 205: Computer Modeling for Management
Fall 2003-2004 Final Exam
Date, Jan 21* , 2004; Time: 5:30 pm-7:30 pm.
marks)
A portfolio Manager has been given $100,000 to invest. (S)He will choose investments
from a list of five projects. The projects require the cash flows at time 0 and yield the net
present values (NPV) shown in the table.
Projects Cash at time 0 in $1000s NPV in $1000s
1 10 15
2 15 30
3 20 30
4 30 20
5 40 50
(i) Build a linear programming model to determine the investment plan that
maximizes NPV. [9]
(ii) In order to minimize the investment risks, the portfolio manager has
decided on the following:
a. If either projects 1 or 2, or even if both, are selected then a
handling fixed charge of $5,000 should be incurred. (3]
b. If both projects 1 and 2 are selected, then project 5 must not be
selected.
[3]
Modify the formulation in (i) to meet the above two conditions.
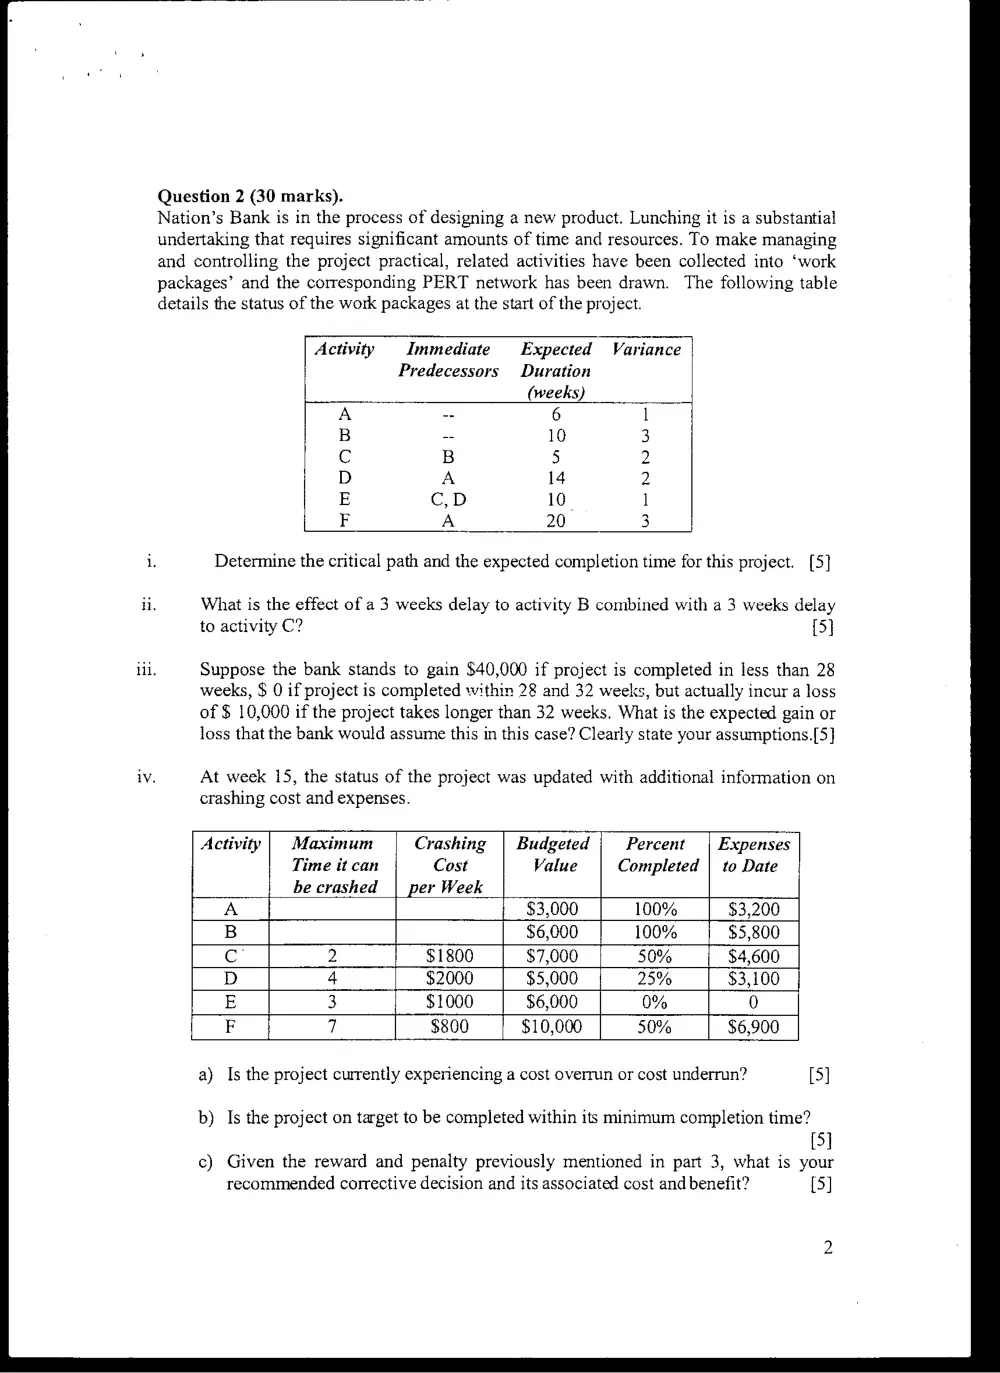
Question 2 (30 marks).
Nation’s Bank is in the process of designing a new product. Lunching it is a substantial
undertaking that requires significant amounts of time and resources. To make managing
and controlling the project practical, related activities have been collected into ‘work
packages’ and the corresponding PERT network has been drawn. The following table
details the status of the work packages at the start of the project.
Activity Immediate Expected Variance
Predecessors Duration
(weeks)
A - 6 1
B - 10 3
Cc B 5 2
D A 14 2
E C,D 10° 1
F A 20 3
i. Determine the critical path and the expected completion time for this project. [5]
ii, What is the effect of a 3 weeks delay to activity B combined with a 3 weeks delay
to activity C? {5]
lil. Suppose the bank stands to gain $40,000 if project is completed in less than 28
weeks, $ 0 if project is completed within 28 and 32 weeks, but actually incur a loss
of $ 10,000 if the project takes longer than 32 weeks. What is the expected gain or
loss that the bank would assume this in this case? Clearly state your assumptions.[5]
iv. At week 15, the status of the project was updated with additional information on
crashing cost and expenses.
Activity | Maximum Crashing | Budgeted Percent | Expenses
Time it can Cost Value Completed | to Date
be crashed | per Week
A $3,000 100% $3,200
B $6,000 100% $5,800
C 2 $1800 $7,000 50% $4,600
D 4 $2000 $5,000 25% $3,100
E 3 $1000 $6,000 0% 0
F 7 $800 $10,000 50% $6,900
a) Is the project currently experiencing a cost overrun or cost underrun? [5]
b) Is the project on target to be completed within its minimum completion time?
[5]
c) Given the reward and penalty previously mentioned in part 3, what is your
recommended corrective decision and its associated cost and benefit? [5]
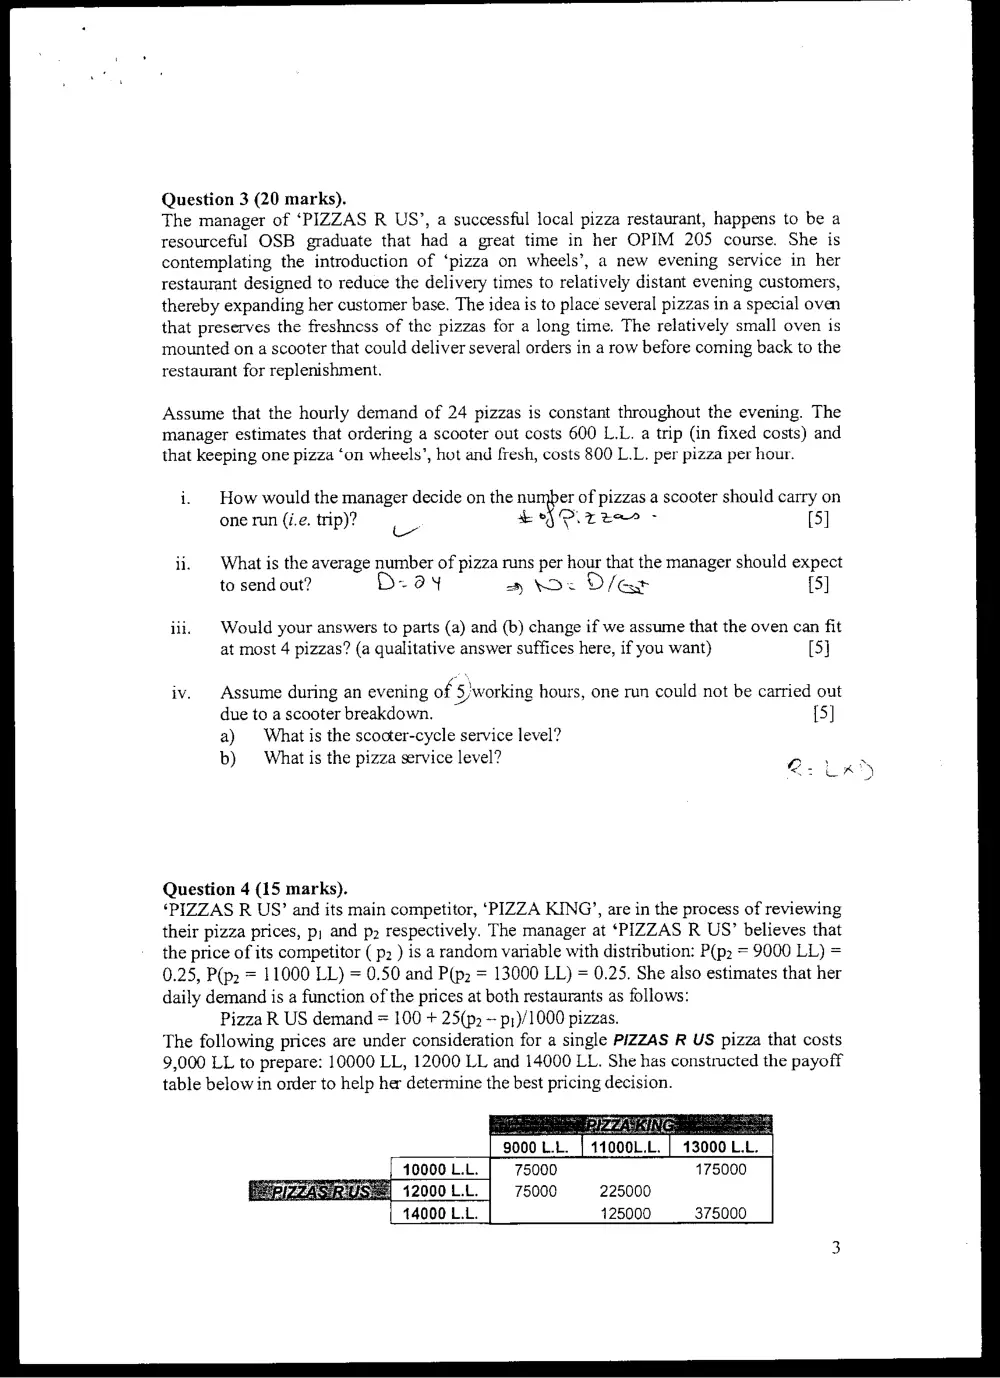
Question 3 (20 marks).
The manager of ‘PIZZAS R US’, a successful local pizza restaurant, happens to be a
resourceful OSB graduate that had a great time in her OPIM 205 course. She is
contemplating the introduction of ‘pizza on wheels’, a new evening service in her
restaurant designed to reduce the delivery times to relatively distant evening customers,
thereby expanding her customer base. The idea is to place several pizzas in a special oven
that preserves the freshness of the pizzas for a long time. The relatively small oven is
mounted on a scooter that could deliver several orders in a row before coming back to the
restaurant for replenishment.
Assume that the hourly demand of 24 pizzas is constant throughout the evening. The
manager estimates that ordering a scooter out costs 600 L.L. a trip (in fixed costs) and
that keeping one pizza ‘on wheels’, hot and fresh, costs 800 L.L. per pizza per hour.
i. How would the manager decide on the number of pizzas a scooter should carry on
one run (i.e. trip)? Le ef POrria - [5]
What is the average number of pizza runs per hour that the manager should expect
to send out? Day a bos D/@st {5]
Would your answers to parts (a) and (b) change if we assume that the oven can fit
at most 4 pizzas? (a qualitative answer suffices here, if you want) [5]
Assume during an evening of 5)working hours, one run could not be carried out
due to a scooter breakdown. {5]
a) What is the scocter-cycle service level?
b) What is the pizza service level?
Question 4 (15 marks).
‘PIZZAS R US’ and its main competitor, ‘PIZZA KING’, are in the process of reviewing
their pizza prices, p; and p2 respectively. The manager at ‘PIZZAS R US’ believes that
the price of its competitor ( p2 ) is a random vanable with distribution: P(p2 = 9000 LL) =
0.25, P(p2 = 11000 LL) = 0.50 and P(p2 = 13000 LL) = 0.25. She also estimates that her
daily demand is a function of the prices at both restaurants as follows:
Pizza R US demand = 100 + 25(p2 - p;)/1000 pizzas.
The following prices are under consideration for a single PIZZAS R US pizza that costs
9,000 LL to prepare: 10000 LL, 12000 LL and 14000 LL. She has constructed the payoff
table below in order to help her determine the best pricing decision.
11000L.L.
10000 L.L. 75000 175000
42000 L.L. 75000 225000
14000 L.L. 125000 375000
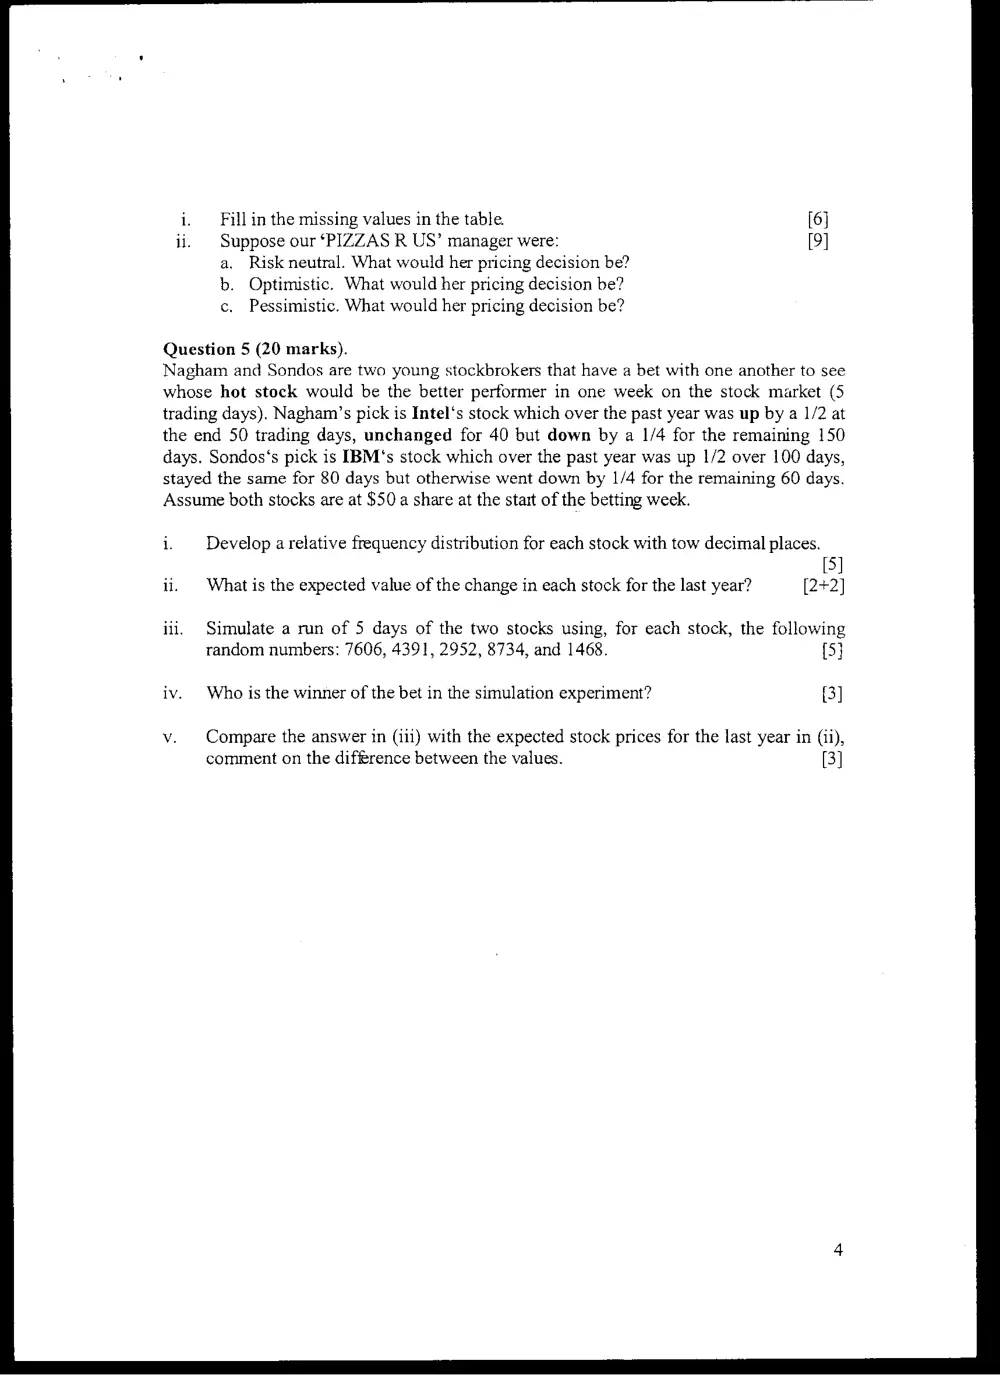
i. Fill in the missing values in the table.
ii. Suppose our ‘PIZZAS R US’ manager were:
a. Risk neutral. What would her pricing decision be?
b. Optimistic. What would her pricing decision be?
c. Pessimistic. What would her pricing decision be?
Question 5 (20 marks).
Nagham and Sondas are two young stockbrokers that have a bet with one another to see
whose hot stock would be the better performer in one week on the stock market (5
trading days). Nagham’s pick is Intel‘s stock which over the past year was up by a 1/2 at
the end 50 trading days, unchanged for 40 but down by a 1/4 for the remaining 150
days. Sondos‘s pick is IBM's stock which over the past year was up 1/2 over 100 days,
stayed the same for 80 days but otherwise went down by 1/4 for the remaining 60 days.
Assume both stocks are at $50 a share at the start of the betting week.
i. Develop a relative frequency distribution for each stock with tow decimal places.
5
ii. | What is the expected value of the change in each stock for the last year? (2+2
Simulate a run of 5 days of the two stocks using, for each stock, the following
random numbers: 7606, 4391, 2952, 8734, and 1468. 5
Who is the winner of the bet in the simulation experiment? 3
Compare the answer in (iii) with the expected stock prices for the last year in (ii),
comment on the diffrence between the values. 3
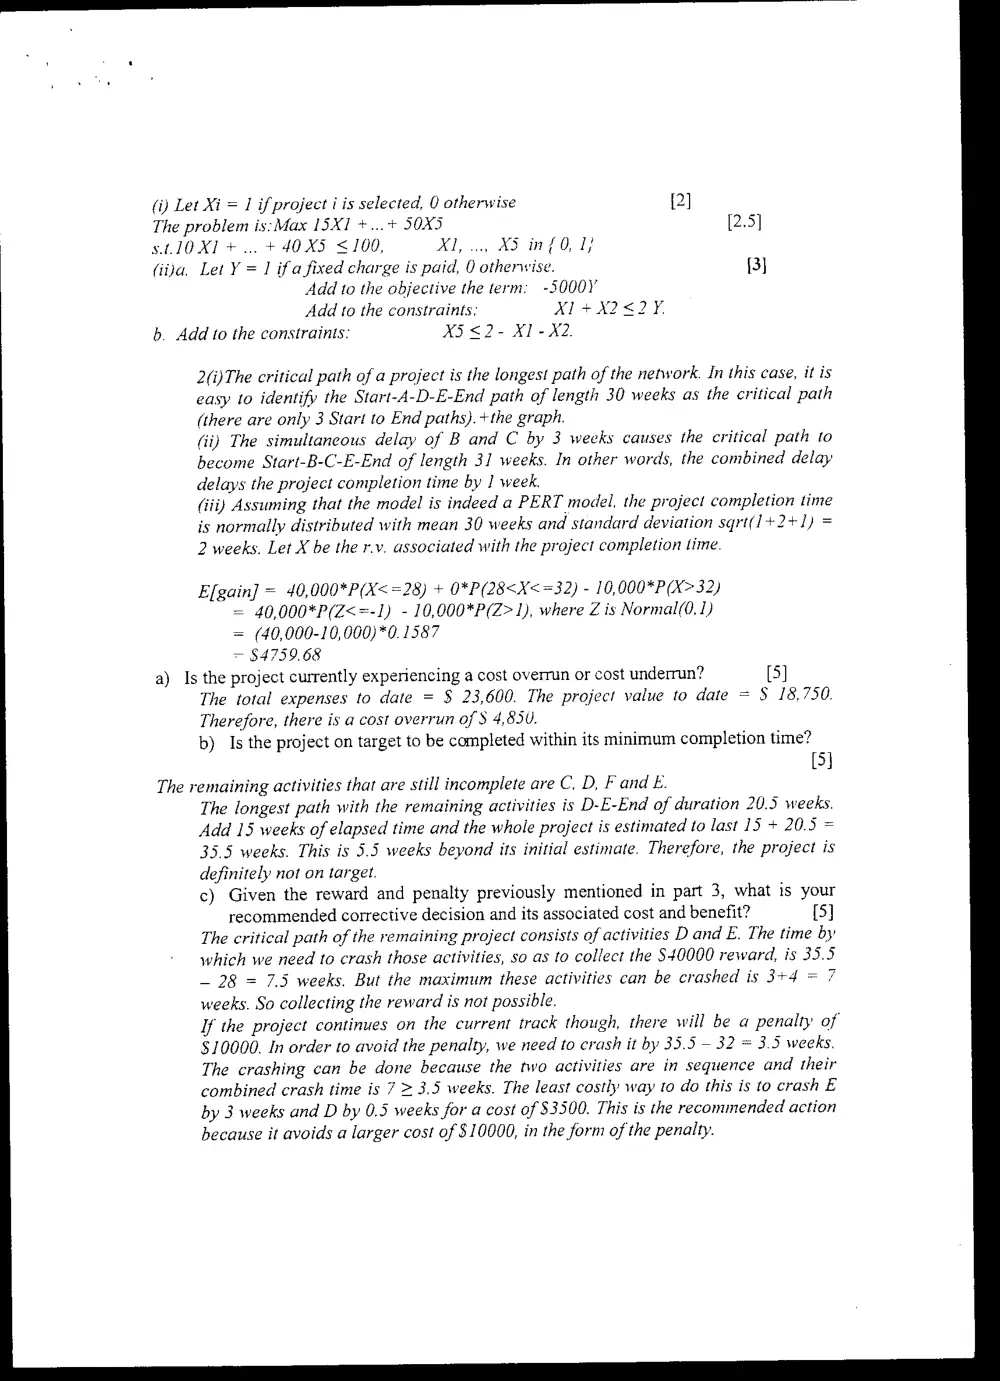
(i) Let Xi = 1 if project i is selected, 0 otherwise {2]
The problem is:Max 15X1 +...+ 503 [2.5]
st OX] +... + 40X5 < 100, XI, ..., X35 inf 0,1)
(iija, Let Y = 1 ifa fixed charge is paid, 0 otherwise. {3]
Add to the objective the term: -5000Y
Add to the constraints; X1+X2<2 ¥.
b. Add to the constraints: X5 <2- X1-X2.
2(i)The critical path of a project is the longest path of the network. In this case, it is
easy to identify the Start-A-D-E-End path of length 30 weeks as the critical path
(there are only 3 Start to End paths).+the graph.
(ii) The simultaneous delay of B and C by 3 weeks causes the critical path to
become Start-B-C-E-End of length 3] weeks. In other words, the combined delay
delays the project completion time by 1 week.
(iii) Assuming that the model is indeed a PERT model. the project completion time
is normally distributed with mean 30 weeks and standard deviation sqri(1+2+1) =
2 weeks. Let X be the r.v. associated with the project completion time.
Efgain] = 40,000*P(X<=28) + 0*P(28<X<=32) - 10,000*P(X> 32)
= 40,000*P(Z<=-1) - 10,000*P(Z> 1), where Z is Normal(0, 1)
= (40,000-10,000)*0.1587
= $4759.68
a) Is the project currently experiencing a cost overrun or cost underrun? [5]
The total expenses to date = $ 23,600. The project value to date = $ 18,750.
Therefore, there is a cost overrun of $ 4,850.
b) Is the project on target to be completed within its minimum completion time?
[5]
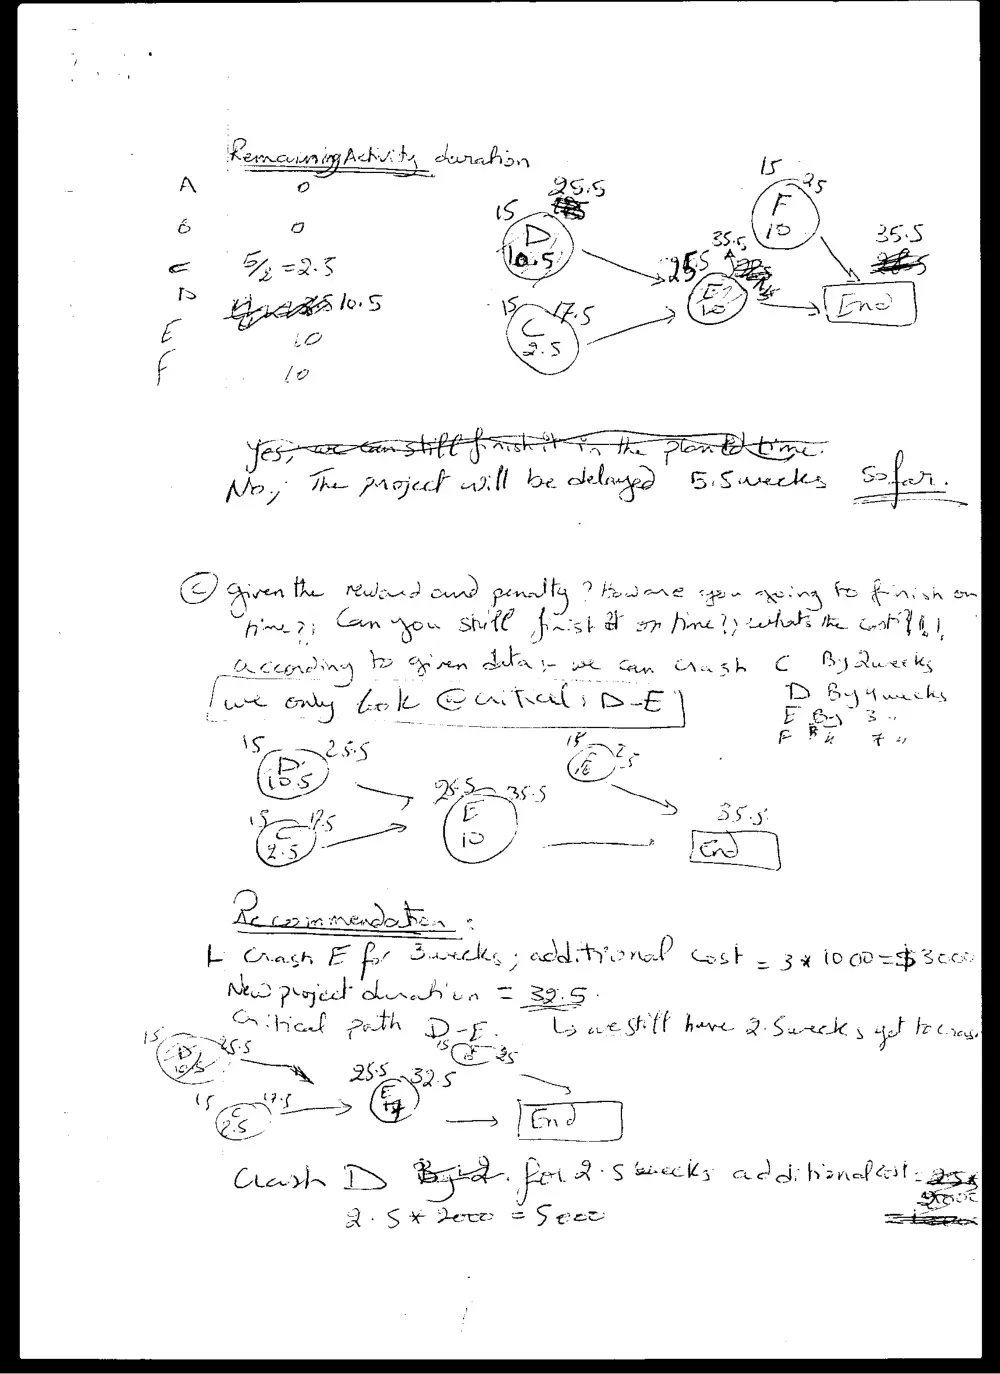
The remaining activities that are still incomplete are C, D, F and E.
The longest path with the remaining activities is D-E-End of duration 20.5 weeks.
Add 15 weeks of elapsed time and the whole project is estimated to last 15 + 20.5 =
35.5 weeks. This is 5.5 weeks beyond its initial estimate. Therefore, the project is
definitely not on target.
c) Given the reward and penalty previously mentioned in part 3, what is your
recommended corrective decision and its associated cost and benefit? [5]
The critical path of the remaining project consists of activities D and E. The time by
which we need to crash those activities, so as to collect the $40000 reward, is 35.5
~ 28 = 7.5 weeks. But the maximum these activities can be crashed is 3+4 = 7
weeks. So collecting the reward is not possible.
If the project continues on the current track though, there will be a penalty of
$10000. In order to avoid the penalty, we need to crash it by 35.5 — 32 = 3.5 weeks.
The crashing can be done because the two activities are in sequence and their
combined crash time is 7 = 3.5 weeks. The least costly way to do this is to crash E
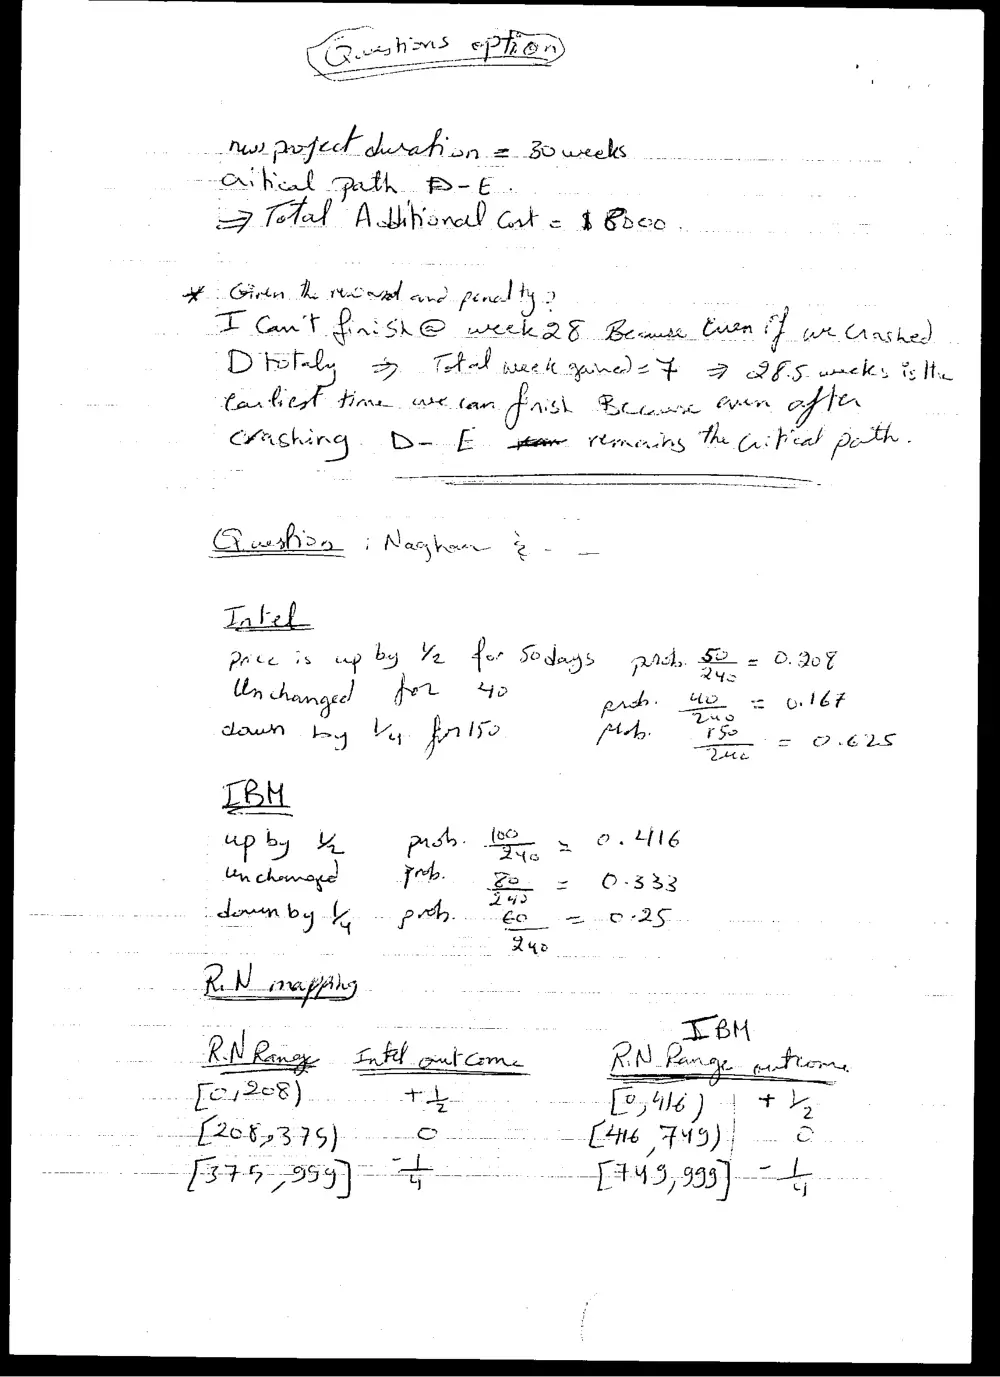
by 3 weeks and D by 0.5 weeks for a cost of $3500. This is the recommended action
because it avoids a larger cost of $10000, in the form of the penalty.
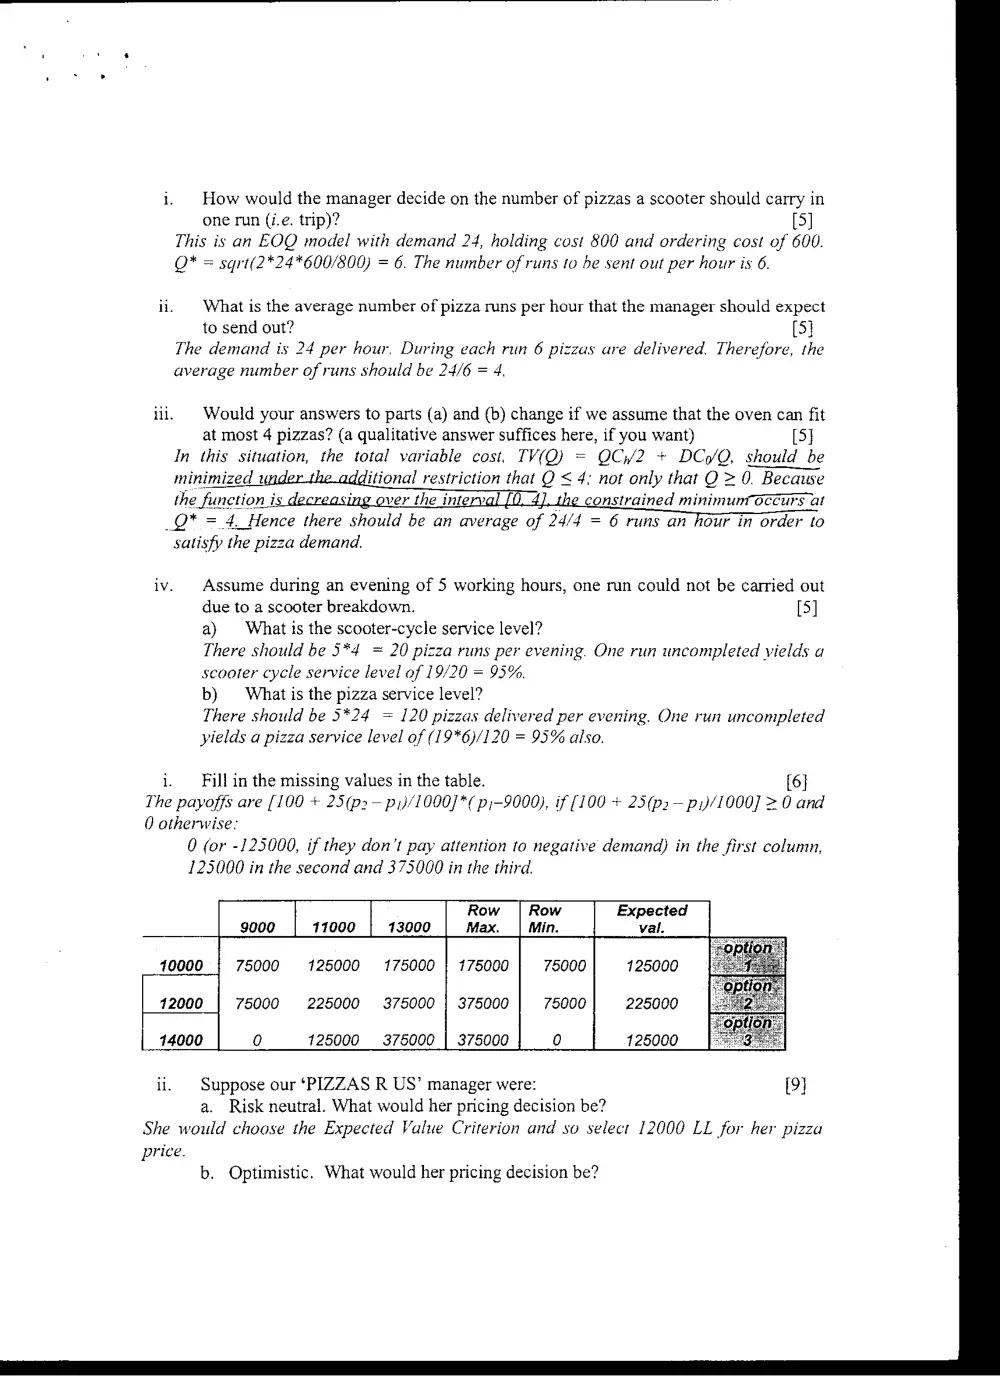
i. How would the manager decide on the number of pizzas a scooter should carry in
one run (i.e. trip)? (5]
This is an EOQ model with demand 24, holding cost 800 and ordering cost of 600.
= sqrt(2*24*600/800) = 6. The number of runs to be sent out per hour is 6.
ii. | What is the average number of pizza runs per hour that the manager should expect
to send out? (5}
The demand is 24 per hour. During each run 6 pizzas are delivered. Therefore, the
average number of runs should be 24/6 = 4.
iii. | Would your answers to parts (a) and (b) change if we assume that the oven can fit
at most 4 pizzas? (a qualitative answer suffices here, if you want) [5]
In this situation, the total variable cost. TV(Q) = QC/2 + DCo/Q, should be
minimized under the additional restriction that Q < 4. not only that Q = 0. Becawse
the function is decreasing over the interval [04], the constrained minimum Occurs at
_QO* = 4, Hence there should be an average of 24/4 = 6 runs an hour in order to
satisfy the pizza demand.
iv. Assume during an evening of 5 working hours, one run could not be carried out
due to a scooter breakdown. [5]
a) | What is the scooter-cycle service level?
There should be 5*4 = 20 pizza runs per evening. One run uncompleted yields a
scooter cycle service level of 19/20 = 93%.
b) What is the pizza service level?
There should be 5*24 = 120 pizzas delivered per evening. One run uncompleted
yields a pizza service level of (19*6)/120 = 95% also.
i. Fill in the missing values in the table. [6]
The payoffs are [100 + 23(p2— p1}/1000] *¢ p;-9000), if [100 + 23(p2— pi)/1000] = 0 and
0 otherwise:
0 (or -125000, if they don’t pay attention to negative demand) in the first column,
125000 in the second and 375000 in the third.
Row | Row Expected
go00 11000 13000 Max. | Min. val.
10000 75000 125000 175000 | 175000 75000 125000
12000 75000 225000 375000 | 375000 75000 225000
14000 0 125000__ 375000 | 375000 0 125000
ii. Suppose our ‘PIZZAS R US’ manager were: [9]
a. Risk neutral. What would her pricing decision be?
She would choose the Expected Value Criterion and so select 12000 LL for her pizza
price.
b. Optimistic. What would her pricing decision be?
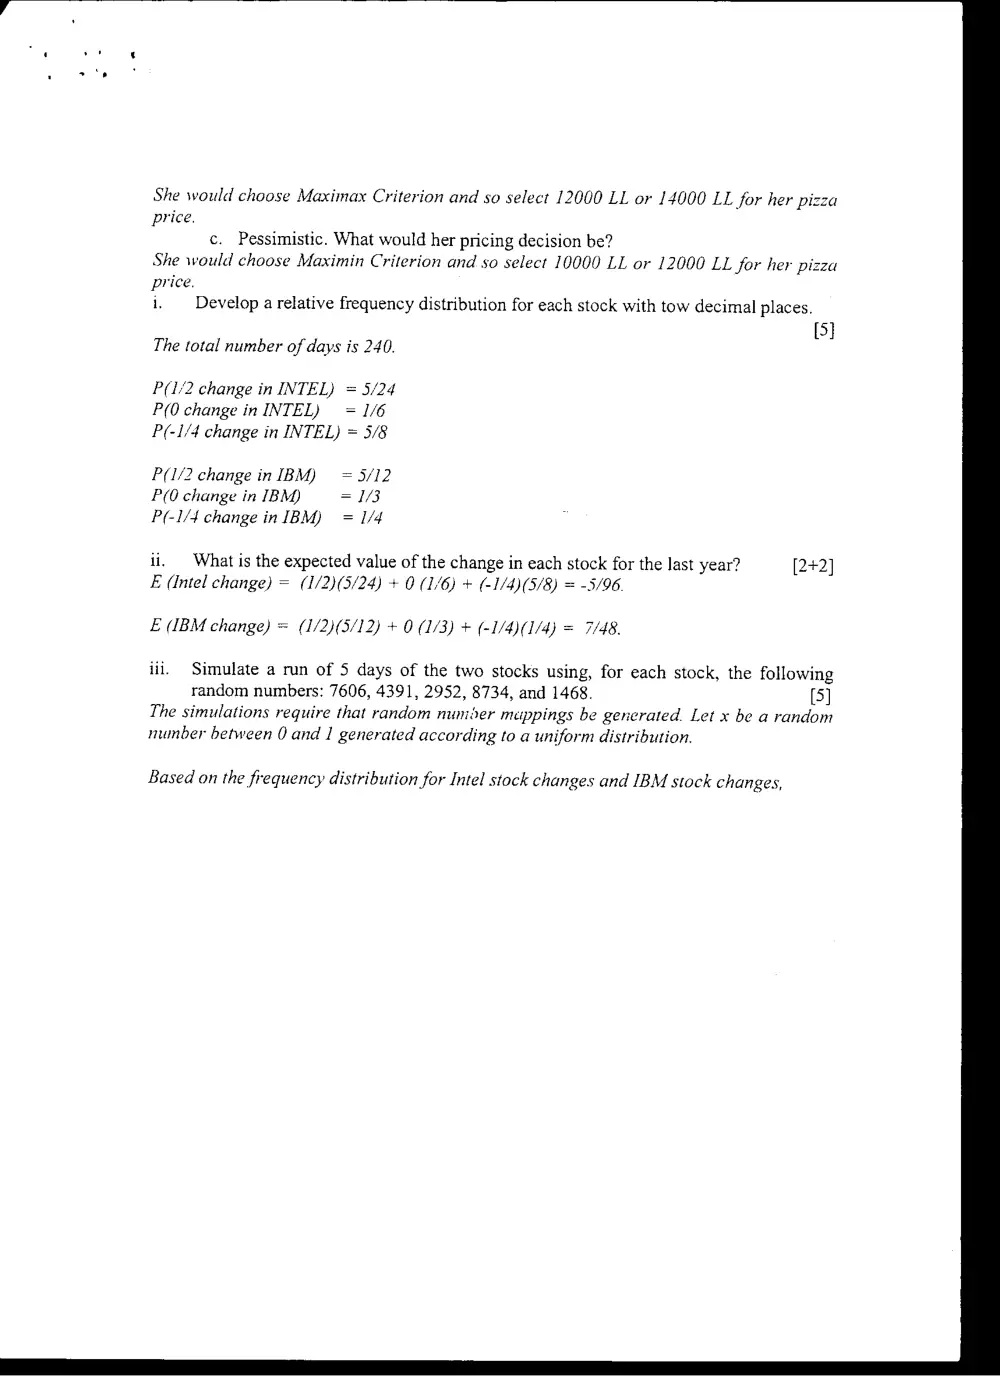
She would choose Maximax Criterion and so select 12000 LL or 14000 LL for her pizza
price.
c. Pessimistic. What would her pricing decision be?
She would choose Maximin Criterion and so select 10000 LL or 12000 LL for her pizza
price.
i. Develop a relative frequency distribution for each stock with tow decimal places.
[5}
The total number of days is 240.
P(1/2 change in INTEL) = 5/24
P(0 change in INTEL) = 1/6
P(-1/4 change in INTEL) = 5/8
P(1/2 change in IBM) — = 5/12
P(O change in IBM) = 1/3
P(-1/4 change in IBM) = 1/4
ii, What is the expected value of the change in each stock for the last year? (2+2]
E (Intel change) = (1/2)(3/24) + 0 (1/6) + (-1/4)(5/8) = -5/96.
E (IBM change) = (1/2)(5/12) + 0 (1/3) + (-I/4)(1/4) = 7/48.
iii. Simulate a run of 5S days of the two stocks using, for each stock, the following
random numbers: 7606, 4391, 2952, 8734, and 1468. (5]
The simulations require that random number mappings be generated. Let x be a random
number between 0 and 1 generated according to a uniform distribution.
Based on the frequency distribution for Intel stock changes and IBM stock changes,
ie
Remo vy Achy: hy dena by
DOS Hf
eS ee SEPT She Oe %
flo, The prsjeck oaill be ol
CO) given the Rudond ound penal ?Hesere que aeing Fe Gaia om
Vp Con “ou swf post Bp Prey toh te coh YW 1
Aneto yan) te Cp ren Ada i PL Cay CAn sh Co By Que ks
7 D By 4unchs
cso tence, hess ”
b Crash & for Samtdes |: edd atyone? cock = 34 (OG@=sp sece
Neo Project adrHA'en 2 39.5.
onal pth Dap. G west here 2 Sancdes gol feces
S >
os
1 Bie. D oi. AS eects ade: lyanefecif - 2 :
Q : S$ % Dee = S eet =
ef 3 IS
t path B-€
es NahWoncd Cato § Eben |
Ho Geta de ncn ene fer nel ty >
Txt Ga: SLO peek QF Beane tote Yur Crsshed
Dill, 5 Ctl ck prdey~ 2 PFS woncles Ih
Cor: bik Howe ee, tan ofa BOR CU of te
crashing DL tere Hrnerdng te Cri beet pe