
DCSN 200 Final, Spring 2011
American University of Beirut · Managerial Decision Making · 14 pages


Showing the first 10 of 14 pages. Download the PDF to see all of it.
More DCSN 200 files
- Final · Fall 2009Final examView
- Final · Fall 2004Final examView
- Final · Spring 2003Final examView
- Other SAMPLE · Spring 2019FileView
- Homework Solution Assignment 5 · Spring 2013Homework · with solutionView
- Syllabus · Spring 2011LabView
- Midterm Spring 2011 · Spring 2011ExamView
- Lecture Chapter 8 · Fall 2011LabView
Show the text of this final exam
AMERICAN UNIVERSITY OF BEIRUT
SULIMAN OLAYAN SCHOOL OF BUSINESS
DCSN 200: OPERATIONS MANAGEMENT
FINAL EXAM
June 10, 2011
8:00 AM – 10:00 AM
NAME
_______________________________________________
STUDENT ID
___________________________________________
SECTION
_______________________________________________
INSTRUCTOR
___________________________________________
This exam is administered in full observance of the Olayan School of Business Honor Code
and the penalties it sets for violations of the standard of academic conduct. You are required
to fully understand the code and to strongly adhere to it. In particular, cellular telephones,
and computers of any shape or size are not allowed. No questions, no comments, no
borrowing and no disturbance of the peace of any kind will be permitted or tolerated. You
are required to stop working on the exam and hand it immediately when a proctor instructs
you to do so. Any cheating or attempted cheating will subject the offender to a zero on the
exam and a referral to the Student Affairs Committee for further penalties.
Do not start the exam (do not turn to the next page) until instructed to do so
You have 2 hours to complete the exam. You can answer questions in any order
Your understanding of the questions is part of the exam. No questions will be
answered by instructors. If in doubt, write your assumptions and continue solving
When you start the exam, make sure that your exam paper has 12 pages
You must hand in every page of the exam when you finish, including the formula
sheet. If any page has become detached, your name must be written on it
Write your answers in the space provided. Be concise and follow the instructions
closely. If you run out of space, continue on the back of the page, but indicate this
fact clearly.
“I vow to complete the exam on my own without giving or receiving help from anyone
and to adhere to the academic integrity standards reflected in the AUB student code of
conduct”
SIGNATURE
_______________________________________________
Page 1 of 14
PART I.
SHORT QUESTIONS (17 points)
1.
(2 points) Explain how just-in-time processes relate to the quality of an organization's
outputs.
2.
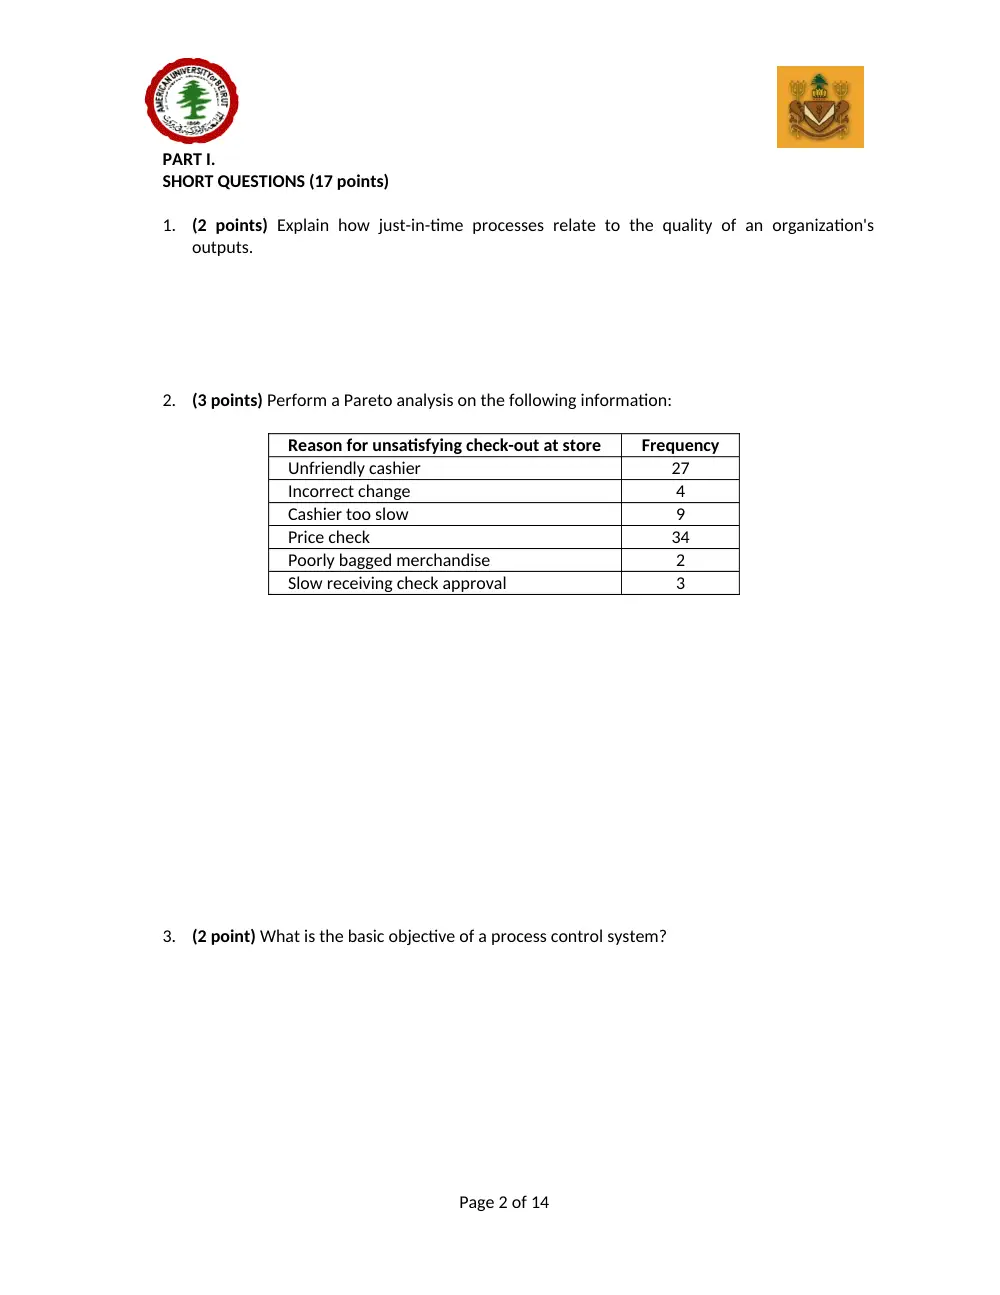
(3 points) Perform a Pareto analysis on the following information:
Reason for unsatisfying check-out at store
Frequency
Unfriendly cashier
27
Incorrect change
4
Cashier too slow
9
Price check
34
Poorly bagged merchandise
2
Slow receiving check approval
3
3.
(2 point) What is the basic objective of a process control system?
Page 2 of 14
4.
(2 point) Explain the purpose of assembly line balancing. Briefly describe its benefits.
5.
(2 point) What is the primary management challenge when implementing yield
management?
6.
(2 points) Why are x-bar and R-charts usually used together?
7.
(2 points) How sensitive is the EOQ to variations in demand or costs?
8.
(2 points) Compare the assumptions of the production order quantity model to those of the
basic EOQ model. Point out to the similarities and differences.
Page 3 of 14
PART II. SHORT PROBLEMS
Problem 1 (12points)
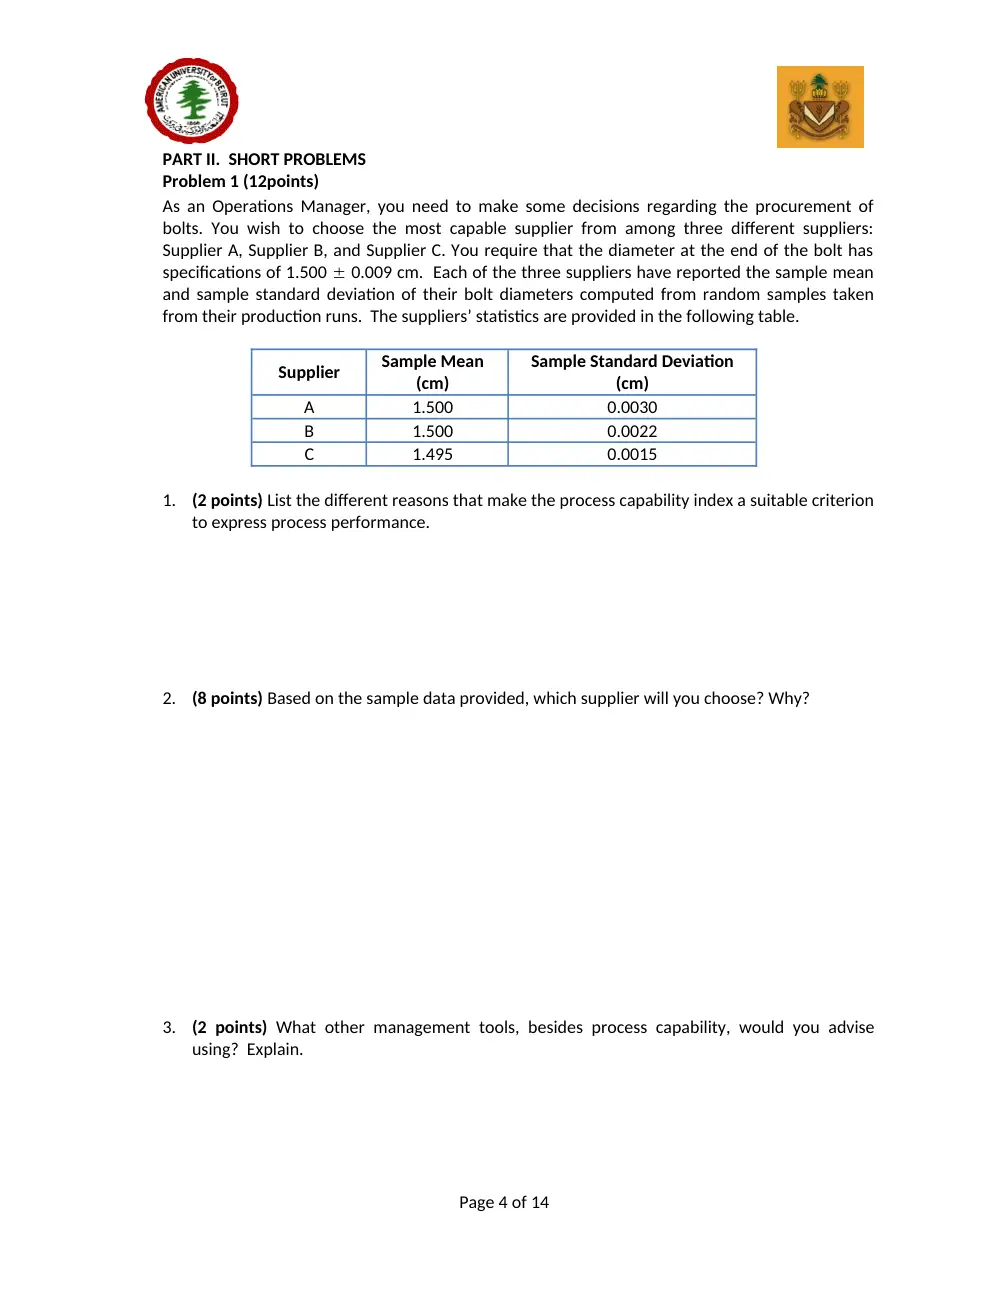
As an Operations Manager, you need to make some decisions regarding the procurement of
bolts. You wish to choose the most capable supplier from among three different suppliers:
Supplier A, Supplier B, and Supplier C. You require that the diameter at the end of the bolt has
specifications of 1.500 0.009 cm. Each of the three suppliers have reported the sample mean
and sample standard deviation of their bolt diameters computed from random samples taken
from their production runs. The suppliers’ statistics are provided in the following table.
Supplier
Sample Mean
(cm)
Sample Standard Deviation
(cm)
A
1.500
0.0030
B
1.500
0.0022
C
1.495
0.0015
1.
(2 points) List the different reasons that make the process capability index a suitable criterion
to express process performance.
2.
(8 points) Based on the sample data provided, which supplier will you choose? Why?
3.
(2 points) What other management tools, besides process capability, would you advise
using? Explain.
Page 4 of 14
Problem 2 (12points)
Suppose that the next season’s demand for industrial printers faced by XeroS is random and also
depends on the price set by XeroS. The price demand function is: , where A depends on how next
season’s economy behaves and p is the unit price of a printer. If the economy is POOR, then
A=20; if the economy is GOOD, then A=50. The probabilities of POOR and GOOD are respectively
60% and 40% (see table).
Economy
Probability
A
POOR
60%
20
GOOD
40%
50
The number of units available in stock (at the beginning of the season) is 30 and there is NO
possibility of replenishment. The holding cost is $5/unit (for any remaining units at the end of the
season) and the stockout cost is $10/unit.
XeroS needs to set one fixed price, p for the season: the values of p can either be $7 OR $10.
Which of the two prices do you recommend XeroS charges? Explain your answer carefully.
Hint: Select the price that leads to the highest expected profit for next season.
Page 5 of 14
PART III. EXTENDED PROBLEMS
Problem 1 (20points)
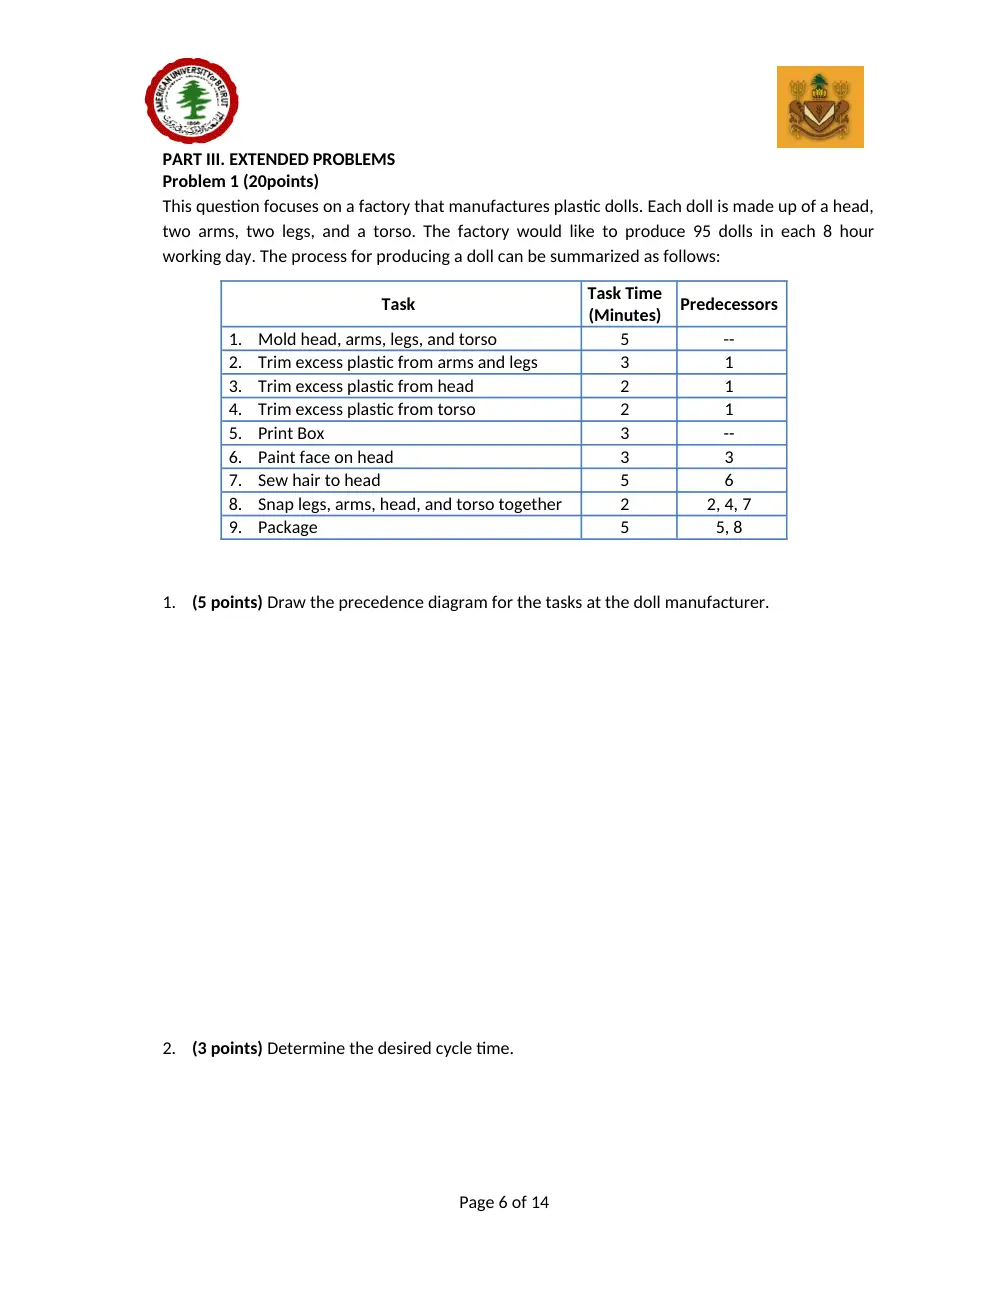
This question focuses on a factory that manufactures plastic dolls. Each doll is made up of a head,
two arms, two legs, and a torso. The factory would like to produce 95 dolls in each 8 hour
working day. The process for producing a doll can be summarized as follows:
Task
Task Time
(Minutes)
Predecessors
1.
Mold head, arms, legs, and torso
5
--
2.
Trim excess plastic from arms and legs
3
1
3.
Trim excess plastic from head
2
1
4.
Trim excess plastic from torso
2
1
5.
Print Box
3
--
6.
Paint face on head
3
3
7.
Sew hair to head
5
6
8.
Snap legs, arms, head, and torso together
2
2, 4, 7
9.
Package
5
5, 8
1.
(5 points) Draw the precedence diagram for the tasks at the doll manufacturer.
2.
(3 points) Determine the desired cycle time.
Page 6 of 14
3.
(2 point) Determine the theoretical minimum number of stations needed.
4.
(4 points) Assign tasks to stations in a forward manner using most following tasks priority
rule. Write clearly in which order tasks are selected by the priority rule and which tasks are
assigned to which station.
5.
(3 points) Calculate the efficiency of the line obtained in part 4 assuming the cycle time
obtained in part 2. Explain what the efficiency score you obtained means for the production
line. (If you weren’t successful at completing part 4 or part 2, make and clearly state any
reasonable assumption for these values.
6.
(3 points) For technology related reasons, Task 4 CANNOT currently be combined with any
other task and has to be a workstation by itself. How does this impact your efficiency?
Page 7 of 14
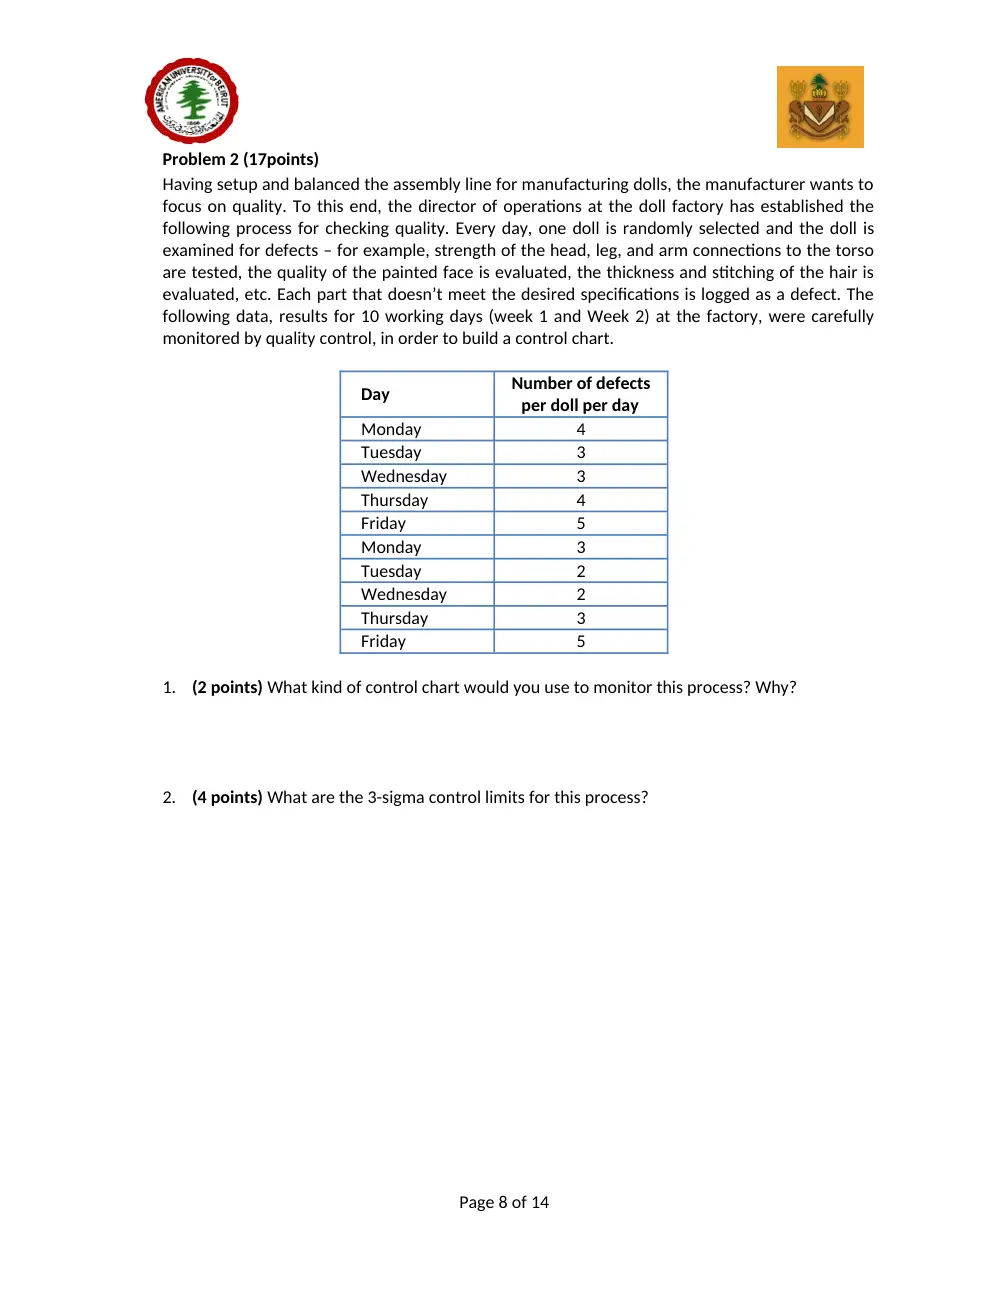
Problem 2 (17points)
Having setup and balanced the assembly line for manufacturing dolls, the manufacturer wants to
focus on quality. To this end, the director of operations at the doll factory has established the
following process for checking quality. Every day, one doll is randomly selected and the doll is
examined for defects – for example, strength of the head, leg, and arm connections to the torso
are tested, the quality of the painted face is evaluated, the thickness and stitching of the hair is
evaluated, etc. Each part that doesn’t meet the desired specifications is logged as a defect. The
following data, results for 10 working days (week 1 and Week 2) at the factory, were carefully
monitored by quality control, in order to build a control chart.
Day
Number of defects
per doll per day
Monday
4
Tuesday
3
Wednesday
3
Thursday
4
Friday
5
Monday
3
Tuesday
2
Wednesday
2
Thursday
3
Friday
5
1.
(2 points) What kind of control chart would you use to monitor this process? Why?
2.
(4 points) What are the 3-sigma control limits for this process?
Page 8 of 14
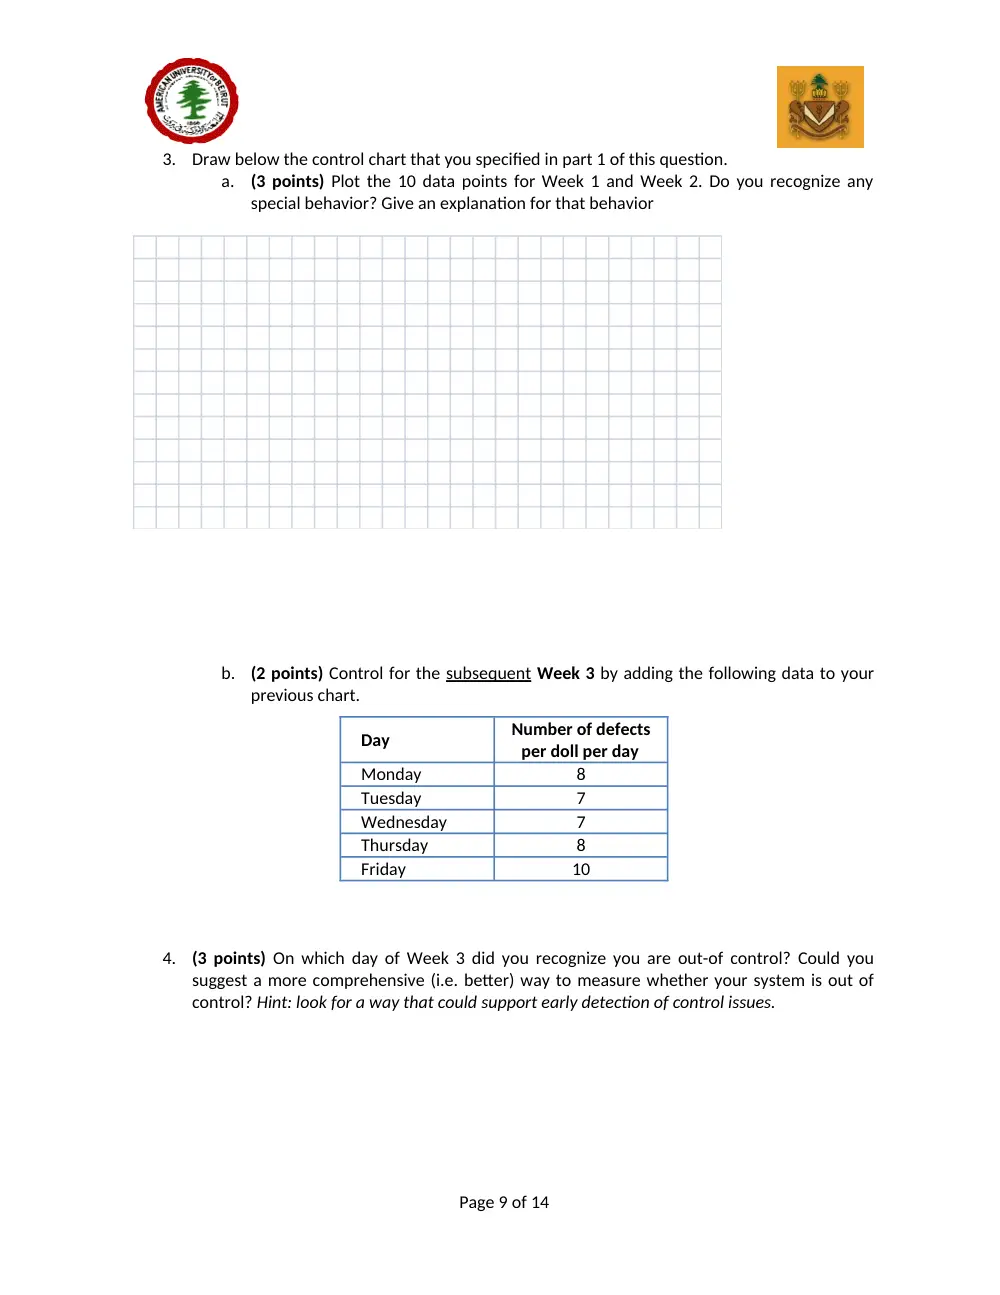
3.
Draw below the control chart that you specified in part 1 of this question.
a.
(3 points) Plot the 10 data points for Week 1 and Week 2. Do you recognize any
special behavior? Give an explanation for that behavior
b.
(2 points) Control for the subsequent Week 3 by adding the following data to your
previous chart.
Day
Number of defects
per doll per day
Monday
8
Tuesday
7
Wednesday
7
Thursday
8
Friday
10
4.
(3 points) On which day of Week 3 did you recognize you are out-of control? Could you
suggest a more comprehensive (i.e. better) way to measure whether your system is out of
control? Hint: look for a way that could support early detection of control issues.
Page 9 of 14
THE FOLLOWING QUESTION IS INDEPENDENT OF QUESTIONS 2 TO 4.
5.
(3 points) What other control chart can be used in measuring defect rate. What would you
need to do to transform the chart suggested in part 1 into the chart you are suggesting now?
Problem 3 (22points)
Assume that a retailer is facing a constant demand D=12,500 units/year for a smart phone (1
year=50weeks). The retailer is looking for a supplier in China.
Two suppliers were able to meet the quality criteria set by the retailer. The retailer has to pick one
of the two.
Both of them charge the same unit cost of c1 = c2 = $100 per unit and charge the same
transportation cost per order equal to $650/order. The difference is the following.
CASE 1
: Supplier 1 is selected. The retailer receives the order in one batch, one week after the
order is placed
CASE 2
: Supplier 2 is selected. The retailer begins receiving the order two weeks after the order
is placed. In this case, the order arrives in small batches of 350 units per week.
Suppose the total holding cost (also known as the carrying cost) is constant and equal to
$100/unit/year. For accounting purposes, the retailer wants to order a quantity of 1000 units
every four weeks.
THE FOLLOWING QUESTIONS ARE INDEPENDENT FROM EACH OTHER
1.
(3 points) What is the ROP of the retailer? Consider both cases (CASE 1 and 2).
2.
(3 points) Which supplier do you recommend the retailer selects? Explain.
Page 10 of 14
3.
(4 points) Suppose, the retailer can negotiate the cost, c1 of Supplier 1. Find the value of c1
that makes the retailer indifferent between the two suppliers.
4.
Suppose the retailer is not constrained by any accounting issues, and is considering a
different ordering policy (that is, a policy other than ordering 1000 units every four weeks)
a.
(4 points) Which quantity do you recommend the retailer order instead (consider
both cases: CASE 1 and 2)?
b.
(4 points) What is the total cost in each case? Which supplier do you recommend
that the retailer select and why?
5.
(4 points) Assume that demand per week is not constant but random with an average of 250
units per week and a standard deviation of 90 units. What is the ROP in each case given a
desired service level of 95% (Z95%=1.64). Would this make you change your mind about which
supplier to select? Explain why or why not.
Page 11 of 14
Formula Sheet
Upper and lower control limits:
Page 12 of 14
Page 13 of 14
Page 14 of 14
.337
1.816
0.184
10
.308
1.777
0.223
12
.266
1.716
0.284