
ECON 211 Problems, Spring 2008
American University of Beirut · Elementary Microeconomics Theory · 9 pages
More ECON 211 files
- Problems Solutions of Book · Spring 2008Problems · with solutionView
- Problems · Spring 2008ProblemsView
- Problems with Answers · Spring 2008Problems · with solutionView
- Problems Set · Fall 2006ProblemsView
- Midterm · Spring 2019ExamView
- Useful File Previouses · Fall 2018FileView
- Notes COURSE SUMMARY ECON 211 FOR FINAL · Fall 2017Final examView
- Useful File Test Banks Version 1 · Spring 2016FileView
Show the text of this problems
Exercise 1:
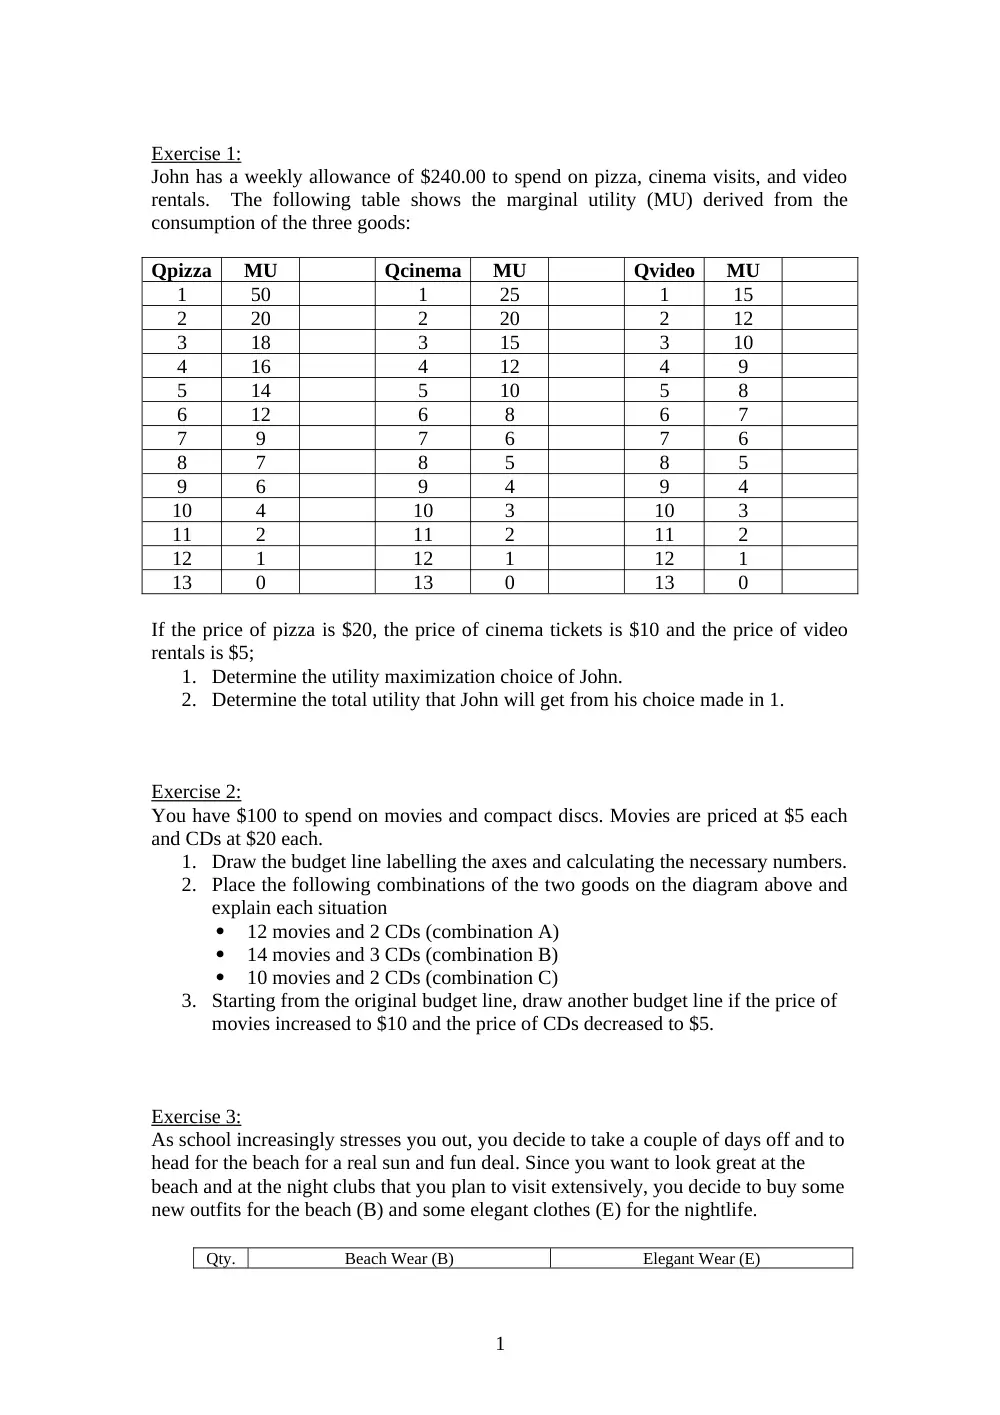
John has a weekly allowance of $240.00 to spend on pizza, cinema visits, and video
rentals. The following table shows the marginal utility (MU) derived from the
consumption of the three goods:
Qpizza
MU
Qcinema
MU
Qvideo
MU
1
50
1
25
1
15
2
20
2
20
2
12
3
18
3
15
3
10
4
16
4
12
4
9
5
14
5
10
5
8
6
12
6
8
6
7
7
9
7
6
7
6
8
7
8
5
8
5
9
6
9
4
9
4
10
4
10
3
10
3
11
2
11
2
11
2
12
1
12
1
12
1
13
0
13
0
13
0
If the price of pizza is $20, the price of cinema tickets is $10 and the price of video
rentals is $5;
1. Determine the utility maximization choice of John.
2. Determine the total utility that John will get from his choice made in 1.
Exercise 2:
You have $100 to spend on movies and compact discs. Movies are priced at $5 each
and CDs at $20 each.
1. Draw the budget line labelling the axes and calculating the necessary numbers.
2. Place the following combinations of the two goods on the diagram above and
explain each situation
12 movies and 2 CDs (combination A)
14 movies and 3 CDs (combination B)
10 movies and 2 CDs (combination C)
3. Starting from the original budget line, draw another budget line if the price of
movies increased to $10 and the price of CDs decreased to $5.
Exercise 3:
As school increasingly stresses you out, you decide to take a couple of days off and to
head for the beach for a real sun and fun deal. Since you want to look great at the
beach and at the night clubs that you plan to visit extensively, you decide to buy some
new outfits for the beach (B) and some elegant clothes (E) for the nightlife.
Qty.
Beach Wear (B)
Elegant Wear (E)
1
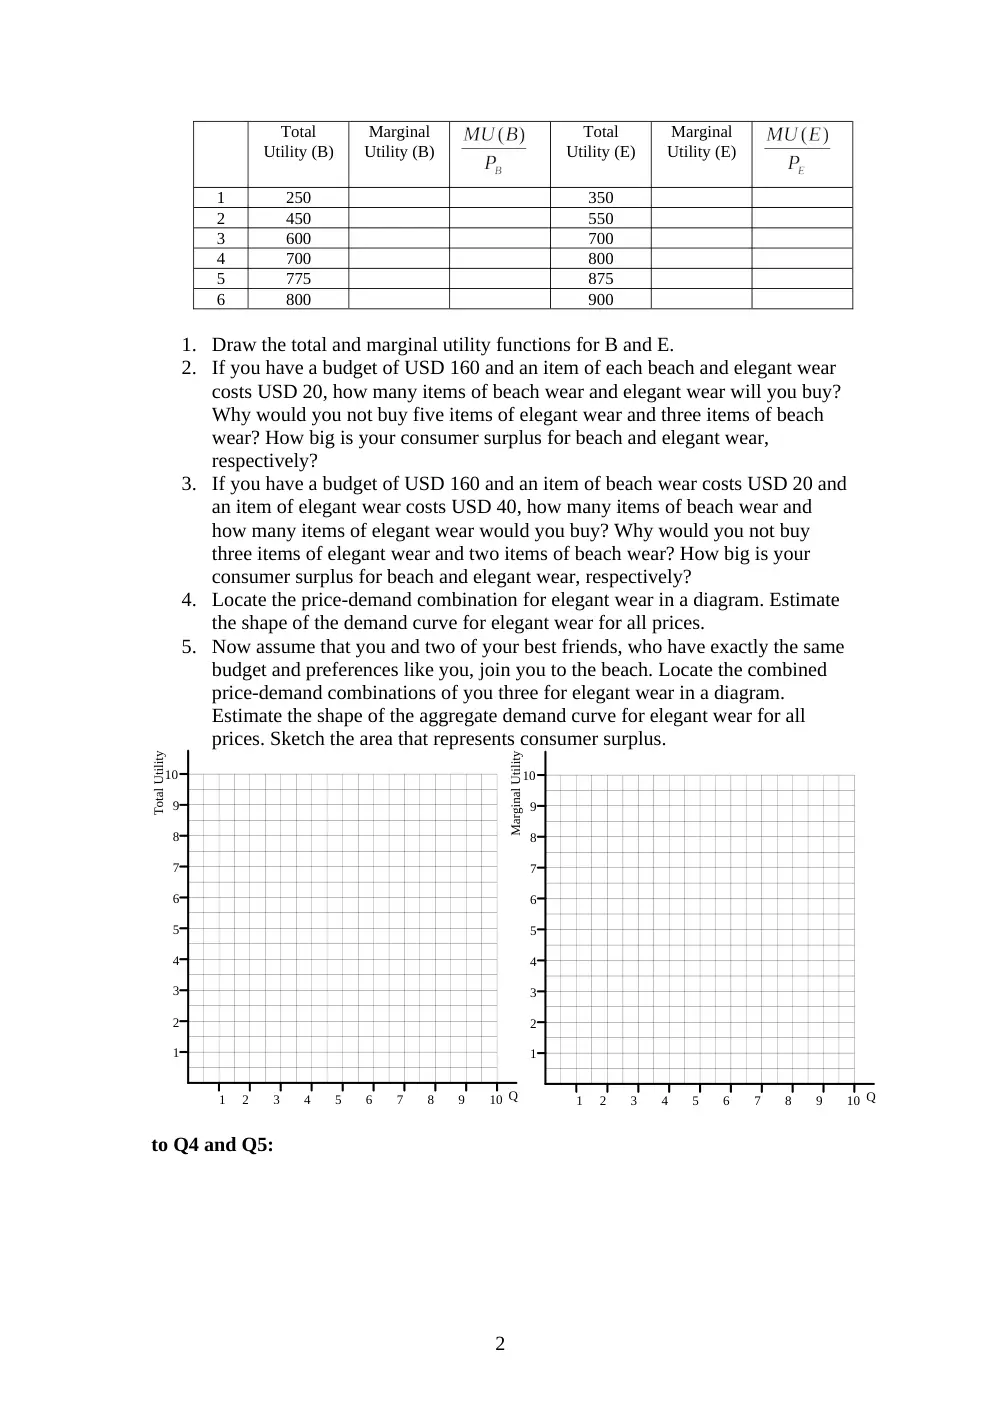
1. Draw the total and marginal utility functions for B and E.
2. If you have a budget of USD 160 and an item of each beach and elegant wear
costs USD 20, how many items of beach wear and elegant wear will you buy?
Why would you not buy five items of elegant wear and three items of beach
wear? How big is your consumer surplus for beach and elegant wear,
respectively?
3. If you have a budget of USD 160 and an item of beach wear costs USD 20 and
an item of elegant wear costs USD 40, how many items of beach wear and
how many items of elegant wear would you buy? Why would you not buy
three items of elegant wear and two items of beach wear? How big is your
consumer surplus for beach and elegant wear, respectively?
4. Locate the price-demand combination for elegant wear in a diagram. Estimate
the shape of the demand curve for elegant wear for all prices.
5. Now assume that you and two of your best friends, who have exactly the same
budget and preferences like you, join you to the beach. Locate the combined
price-demand combinations of you three for elegant wear in a diagram.
Estimate the shape of the aggregate demand curve for elegant wear for all
prices. Sketch the area that represents consumer surplus.
1
2
3
4
5
6
7
8
9
10
1
2
3
4
5
6
7
8
9
10
Total Utility
Q
1
2
3
4
5
6
7
8
9
10
1
2
3
4
5
6
7
8
9
10
Marginal Utility
Q
to Q4 and Q5:
Total
Utility (B)
Marginal
Utility (B)
Total
Utility (E)
Marginal
Utility (E)
1
250
350
2
450
550
3
600
700
4
700
800
5
775
875
6
800
900
2
1
2
3
4
1
2
3
4
5
6
Q
1
2
3
4
3
6
9
12
15
18 Q
Individual
Aggregate
The numbers on the y-Axis are in 100s
Exercise 4:
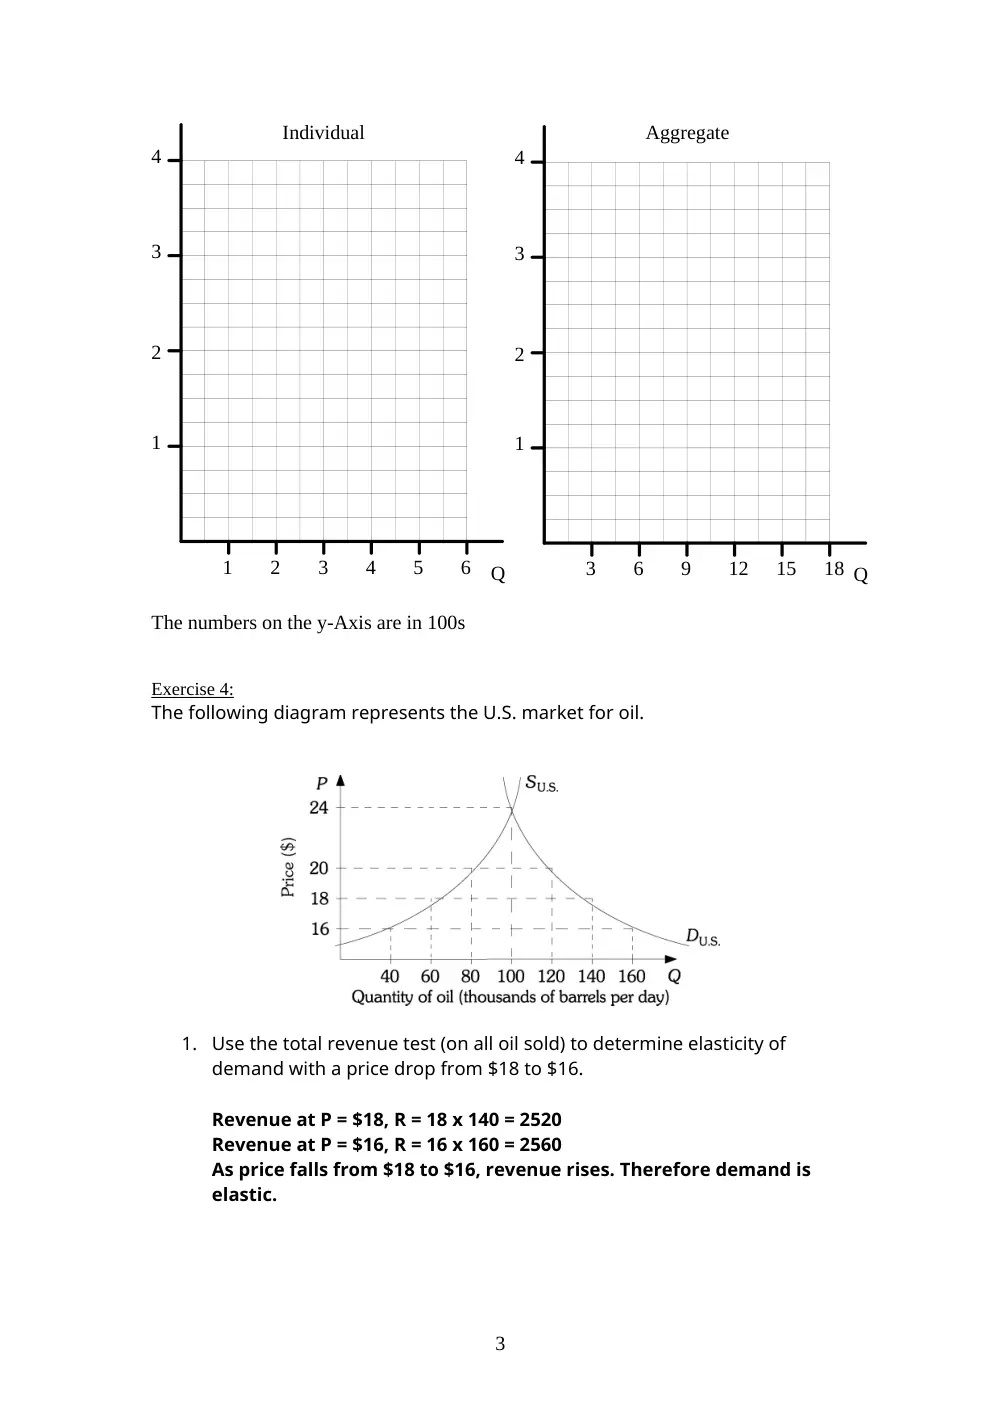
The following diagram represents the U.S. market for oil.
1. Use the total revenue test (on all oil sold) to determine elasticity of
demand with a price drop from $18 to $16.
Revenue at P = $18, R = 18 x 140 = 2520
Revenue at P = $16, R = 16 x 160 = 2560
As price falls from $18 to $16, revenue rises. Therefore demand is
elastic.
3
2. Use the midpoint formula to calculate the price elasticity of demand
between $18 and $16.
By using the midpoint formula, we calculate an elastic demand.
(20/150
-2/17) = (1/15
1/17) = 1.133.
Exercise 5:
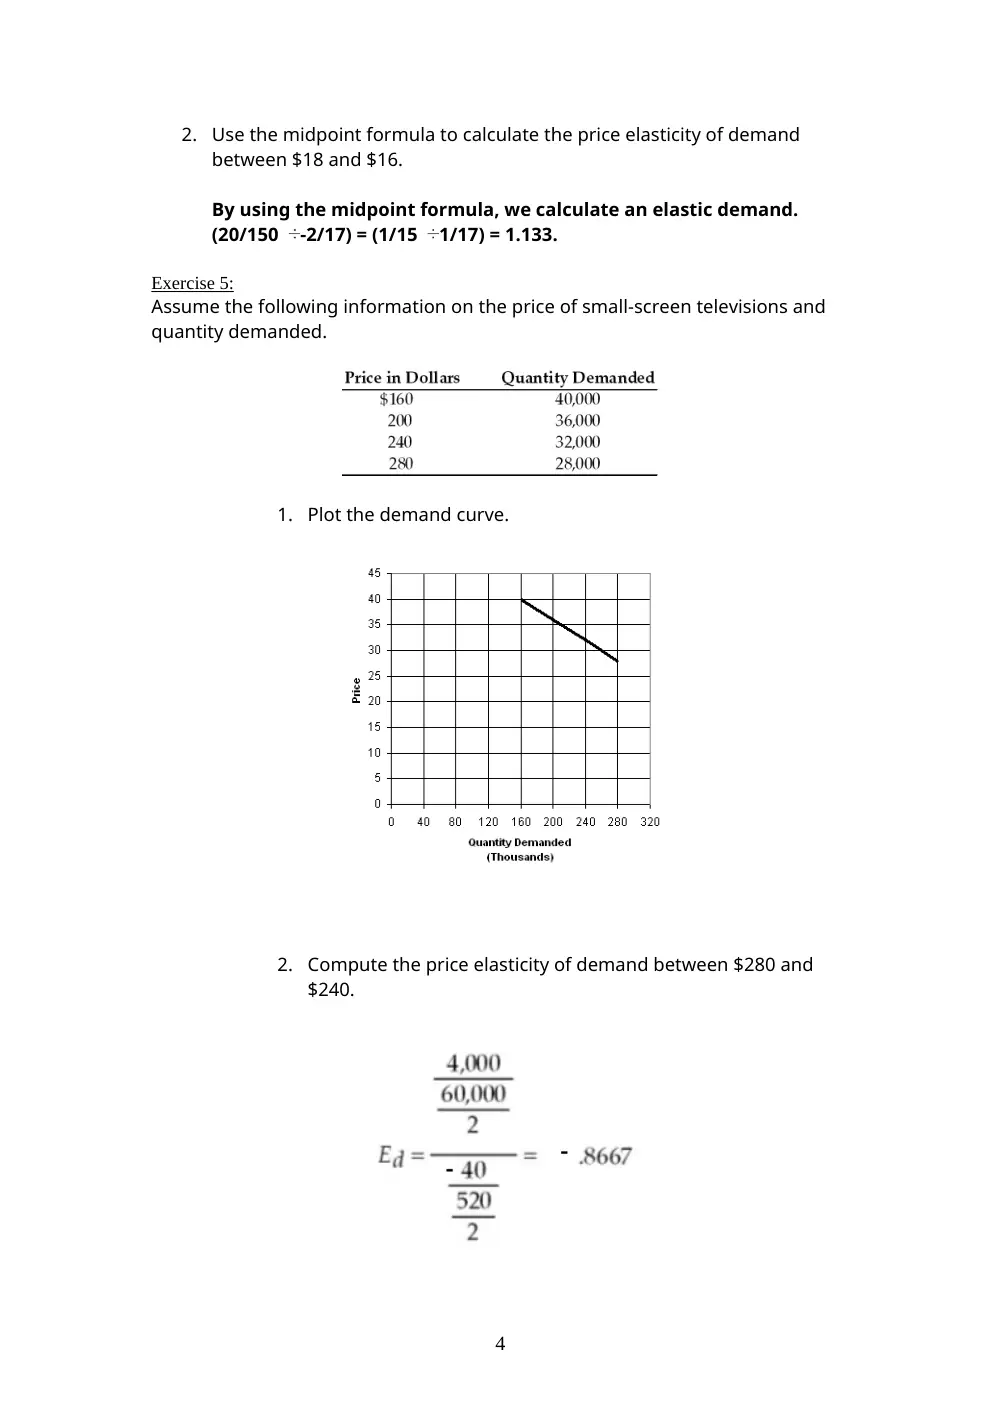
Assume the following information on the price of small-screen televisions and
quantity demanded.
1. Plot the demand curve.
2. Compute the price elasticity of demand between $280 and
$240.
4
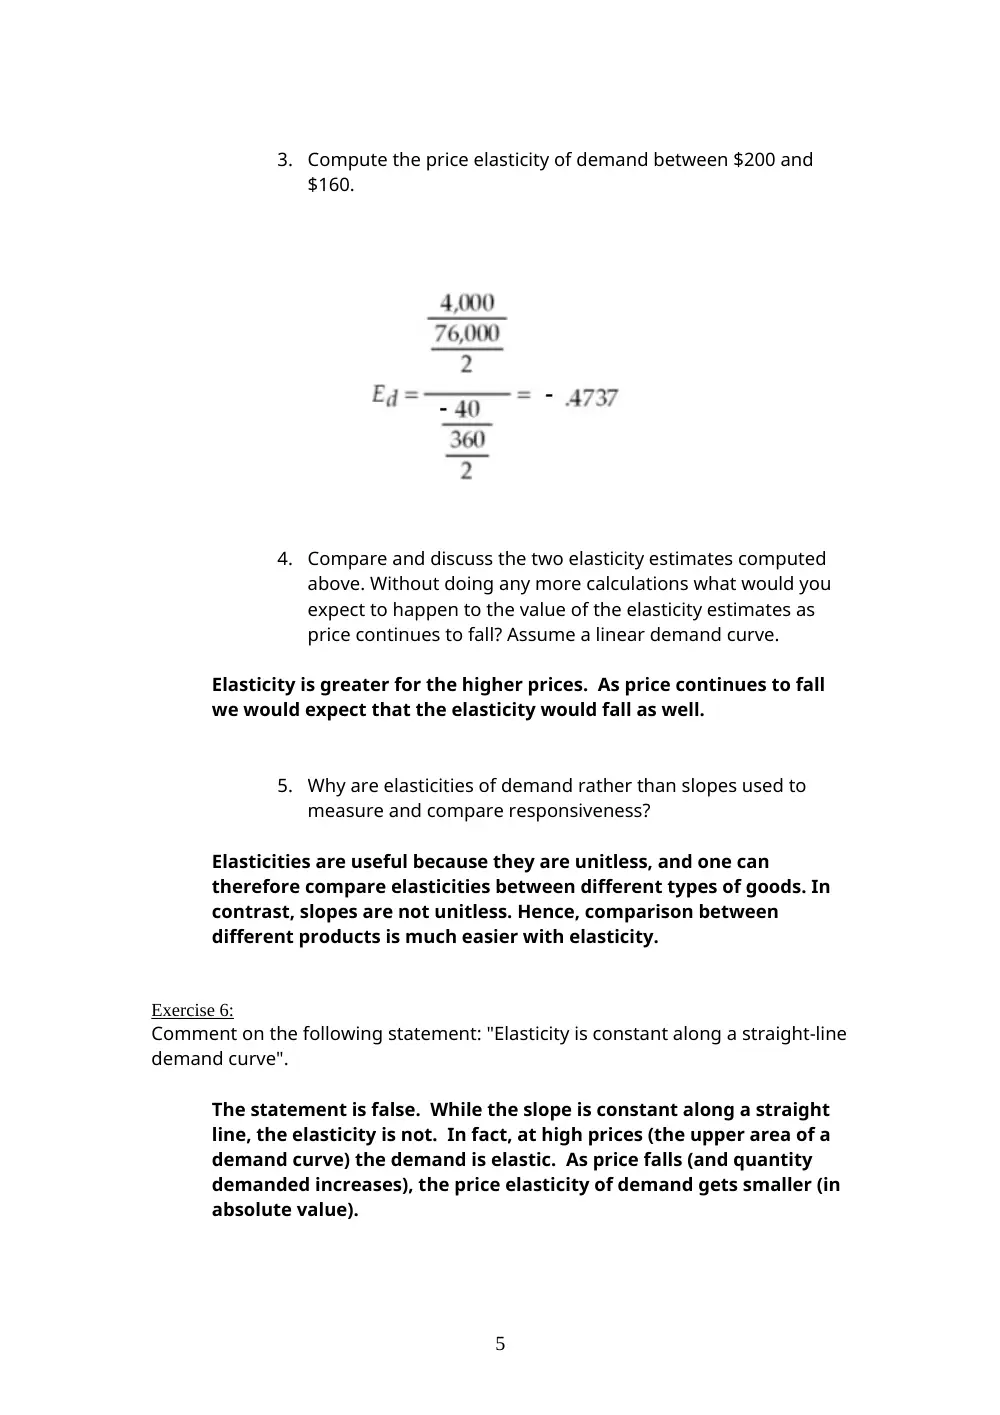
3. Compute the price elasticity of demand between $200 and
$160.
4. Compare and discuss the two elasticity estimates computed
above. Without doing any more calculations what would you
expect to happen to the value of the elasticity estimates as
price continues to fall? Assume a linear demand curve.
Elasticity is greater for the higher prices. As price continues to fall
we would expect that the elasticity would fall as well.
5. Why are elasticities of demand rather than slopes used to
measure and compare responsiveness?
Elasticities are useful because they are unitless, and one can
therefore compare elasticities between different types of goods. In
contrast, slopes are not unitless. Hence, comparison between
different products is much easier with elasticity.
Exercise 6:
Comment on the following statement: "Elasticity is constant along a straight-line
demand curve".
The statement is false. While the slope is constant along a straight
line, the elasticity is not. In fact, at high prices (the upper area of a
demand curve) the demand is elastic. As price falls (and quantity
demanded increases), the price elasticity of demand gets smaller (in
absolute value).
5
Exercise 7:
The demand for tobacco is price inelastic. Suppose there is a drought that
destroys a large portion of the tobacco crop. What will happen in the market for
tobacco? Will the equilibrium price and quantity change? If so, how? What will
happen to the total revenue earned by tobacco farmers?
The drought will lower the supply of tobacco. The supply of tobacco
will shift to the left, increasing price but lowering the equilibrium
quantity sold. However, since the demand for tobacco is price
inelastic, the percentage increase in price will be larger than the
percentage decrease in quantity demanded. Therefore, the total
revenue earned by tobacco farmers will rise.
Exercise 8:
When the price of a bagel rises from $0.45 to $0.65, the quantity of cream
cheese demanded falls from 12,000 to 10,000 ounces per year. Use the
midpoint formula to calculate the cross-price elasticity between bagels and
cream cheese. What does the sign imply about the relationship between these
two goods?
percentage change in quantity of cream cheese demanded = (10,000-
12,000)/11,000 = -2,000/11,000 = -18.2.
percentage change in the price of a bagel = ($0.65 - $0.45)/$0.55 =
0.20/0.55 =
36.4. Therefore, the cross price elasticity = -18.2/36.4 = -0.5.
Because the cross-price elasticity is negative, this implies that the
two goods are complements.
Exercise 9:
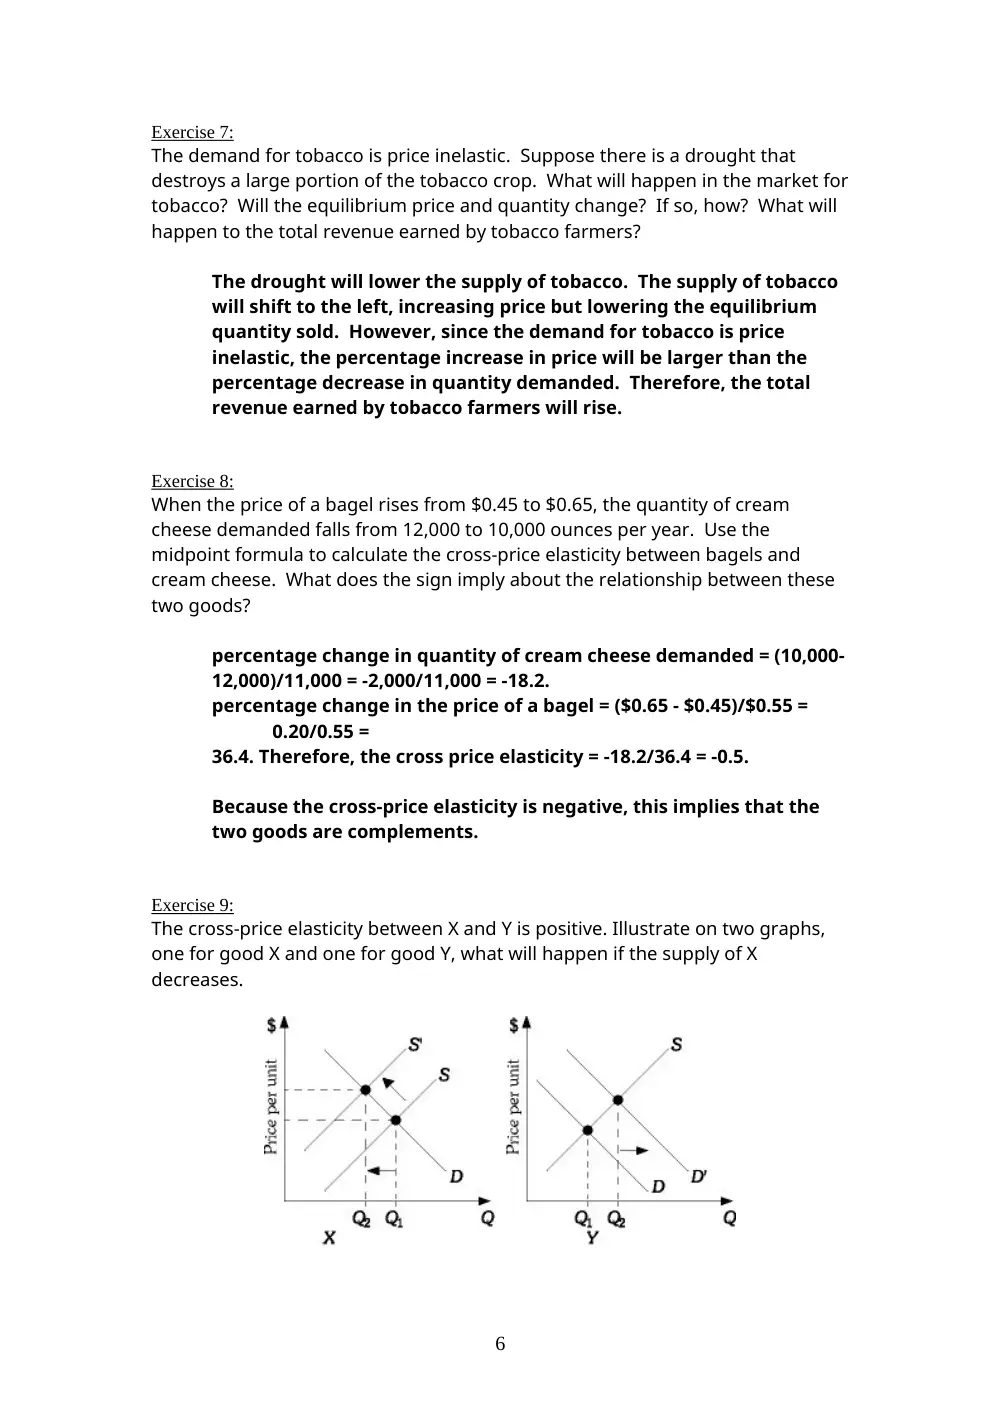
The cross-price elasticity between X and Y is positive. Illustrate on two graphs,
one for good X and one for good Y, what will happen if the supply of X
decreases.
6
If the supply of X decreases, the price of X will increase, the demand
curve for good Y will shift to the right, and the amount of Y purchased
will increase.
Exercise 10:
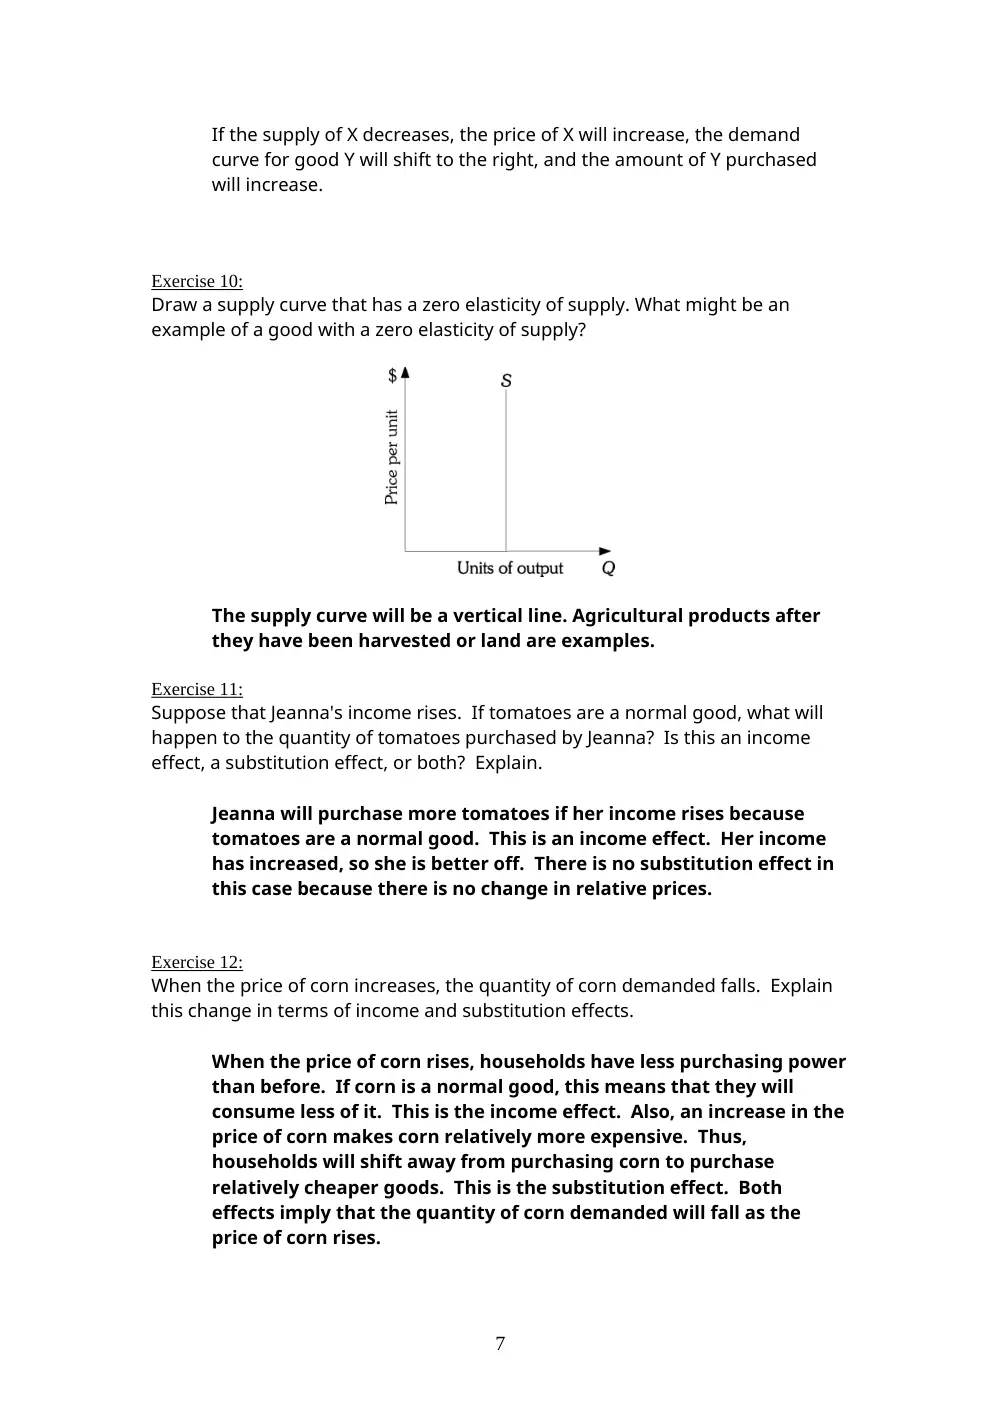
Draw a supply curve that has a zero elasticity of supply. What might be an
example of a good with a zero elasticity of supply?
The supply curve will be a vertical line. Agricultural products after
they have been harvested or land are examples.
Exercise 11:
Suppose that Jeanna's income rises. If tomatoes are a normal good, what will
happen to the quantity of tomatoes purchased by Jeanna? Is this an income
effect, a substitution effect, or both? Explain.
Jeanna will purchase more tomatoes if her income rises because
tomatoes are a normal good. This is an income effect. Her income
has increased, so she is better off. There is no substitution effect in
this case because there is no change in relative prices.
Exercise 12:
When the price of corn increases, the quantity of corn demanded falls. Explain
this change in terms of income and substitution effects.
When the price of corn rises, households have less purchasing power
than before. If corn is a normal good, this means that they will
consume less of it. This is the income effect. Also, an increase in the
price of corn makes corn relatively more expensive. Thus,
households will shift away from purchasing corn to purchase
relatively cheaper goods. This is the substitution effect. Both
effects imply that the quantity of corn demanded will fall as the
price of corn rises.
7
Exercise 13:
Suppose that macaroni and cheese is an inferior good and the price of macaroni
and cheese rises. Explain the income and substitution effects of this price
change.
When the price of macaroni and cheese rises, we have less
purchasing power than before. If macaroni and cheese is an inferior
good, this means that we will consume more of it. This is the income
effect. Also, an increase in the price of macaroni and cheese makes
it relatively more expensive. Thus, households will shift away from
purchasing macaroni and cheese to purchase relatively cheaper
goods. This is the substitution effect. Because these two effects
work in opposite directions, the outcome (in terms of the quantity of
macaroni and cheese demanded) will depend on which effect is
larger. While it is theoretically possible, it is unlikely for this income
effect to be larger than the substitution effect.
Exercise 14:
Explain how income and substitution effects alter the saving behavior of
households.
When the interest rate rises, the opportunity cost of spending
income rises and therefore, individuals will be more likely to save.
This is the substitution effect. However, because the interest rate
increase makes households better off, they want to purchase more
normal goods and save less. This is the income effect.
Exercise 15:
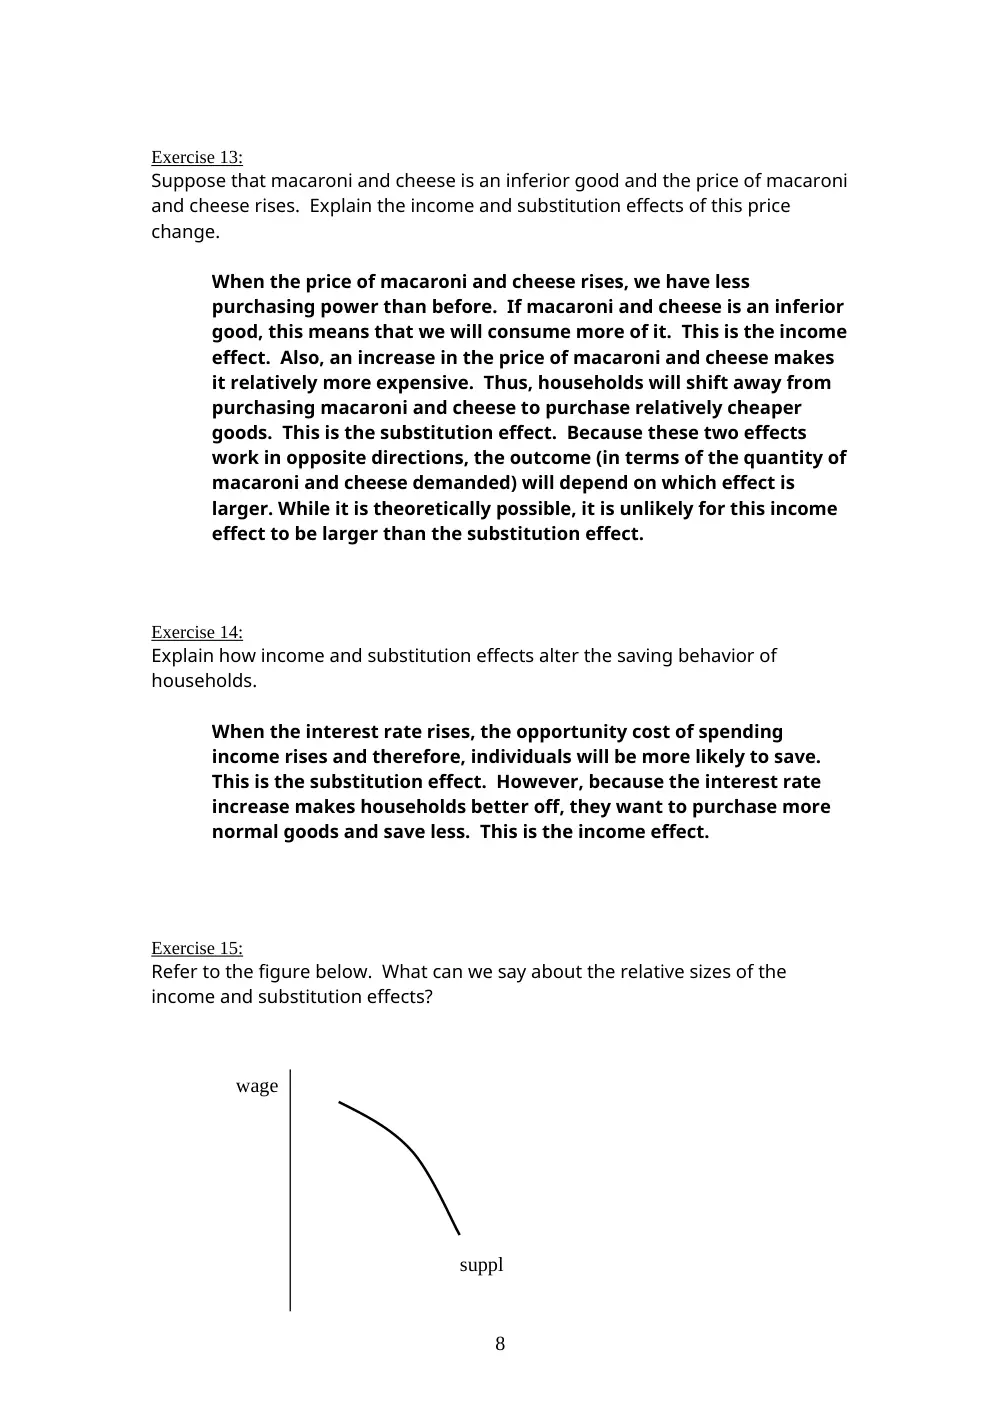
Refer to the figure below. What can we say about the relative sizes of the
income and substitution effects?
8
suppl
y
wage
Because an increase in the wage leads to a decrease in the quantity
of labor supplied, we can tell that the income effect is larger than
the substitution effect.
Exercise 16:
Empirical evidence suggests that saving tends to rise when there is an increase
in interest rates. What does this imply about the relative sizes of the income
and substitution effects? Explain.
The substitution effect must be larger. The substitution effect of an
interest rate increase suggests that households will save more
because the opportunity cost of spending has increased. The income
effect suggests that an increase in the interest rate makes
households better off and therefore they will want to spend more.
Because saving rises when the interest rate increases, the
substitution effect must be larger.
9
Quantity of labor