
EECE 310L Notes All Experiments, Fall 2013
American University of Beirut · Electric Circuits Laboratory · 67 pages


Showing the first 10 of 67 pages. Download the PDF to see all of it.
More EECE 310L files
Show the text of this notes
Experiment 1
Introduction to the Circuits and Electronics Lab
Never plug the power connector in the socket before the instrument:
doing so may cause electrocution!
The Code of Resistors:
How do I read the resistor value?
First find the tolerance band, it will typically be gold (5% tolerance) or silver
(10% tolerance). Starting from the other end, identify the first band - write
down the number associated with that color. Read the next color and write
down the number associated with the second color. Now read the third or
'multiplier' band and write down that number of zeros.
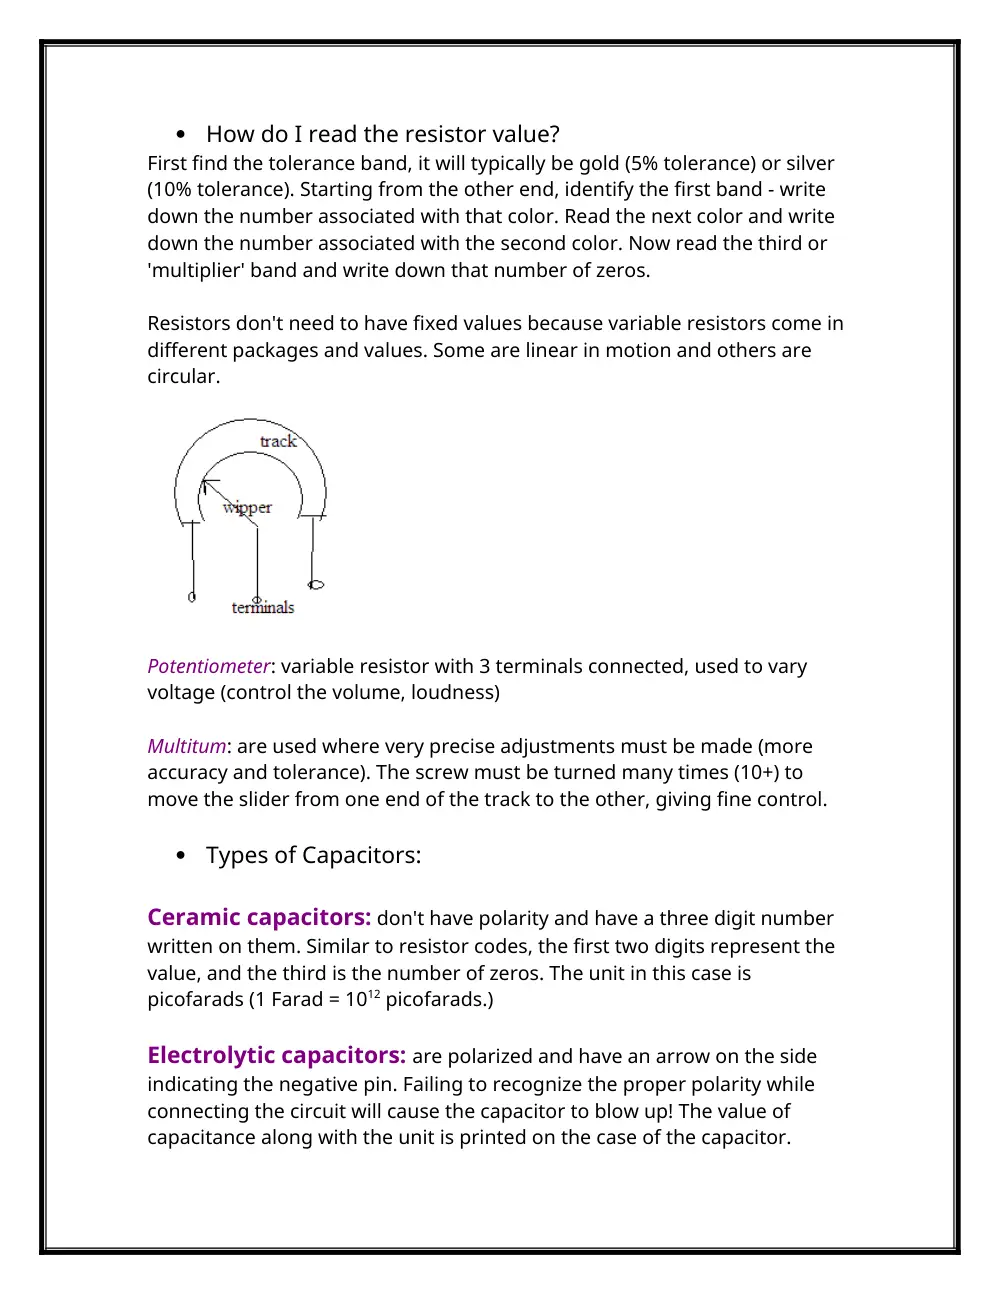
Resistors don't need to have fixed values because variable resistors come in
different packages and values. Some are linear in motion and others are
circular.
Potentiometer: variable resistor with 3 terminals connected, used to vary
voltage (control the volume, loudness)
Multitum: are used where very precise adjustments must be made (more
accuracy and tolerance). The screw must be turned many times (10+) to
move the slider from one end of the track to the other, giving fine control.
Types of Capacitors:
Ceramic capacitors: don't have polarity and have a three digit number
written on them. Similar to resistor codes, the first two digits represent the
value, and the third is the number of zeros. The unit in this case is
picofarads (1 Farad = 1012 picofarads.)
Electrolytic capacitors: are polarized and have an arrow on the side
indicating the negative pin. Failing to recognize the proper polarity while
connecting the circuit will cause the capacitor to blow up! The value of
capacitance along with the unit is printed on the case of the capacitor.
Inductors:
Inductors are supplied in packages similar to those the same color code of
the resistors except for inductors is microhenry (1 Henry = 106 microhenrys.)
made out of a coil (a piece of rolled up wire.)
Diodes:
There are three main types of diodes which we will use in this lab: The
rectifier diode, the zener diode, and the light-emitting diode. Diodes are two
terminal devices with a positive terminal and a negative terminal. Current
flows from positive to negative. The negative terminal is indicated by a band
printed on the case of the diode.
Bipolar Transistors and MOSFETS:
Bipolar transistors and MOSFETS are important components that are used in
building analog and digital circuits.
Switches and Push Buttons:
A switch or a push button is a device that makes a circuit connection or
disconnects one depending on its type. They are characterized by whether
they are normally closed (NC) or normally open (NO), and by the number of
throws and number of poles.
Integrated Circuits:
An integrated circuit (IC), sometimes called a chip or microchip, is a
semiconductor wafer on which tens to hundreds of millions of tiny resistors,
capacitors, and transistors are fabricated. An IC can function as an amplifier,
oscillator, timer, counter, computer memory, or microprocessor. A particular
IC is categorized as either linear (analog) or digital, depending on its
intended application. These chips can be packaged in cases with different
number of pins depending on the application.
Relays:
A mechanical relay is a switch that is activated by an electromagnet. Once
current flows in the coil, the resulting magnetic field will attract a metallic
plate, causing the switch to change state.
There are two types of relays:
Mechanical Relays:
The main disadvantage of mechanical relays is that they can't operate at
high switching frequencies due to mechanical limitations.
Solid-state Relays:
Electronic devices that are easy to connect as a mechanical relay, and can
operate at relatively high frequencies. Their drawback is that they don't have
as many poles as other types of relays.
Experiment 2
Equipment and Instruments in the Lab
Breadboard:
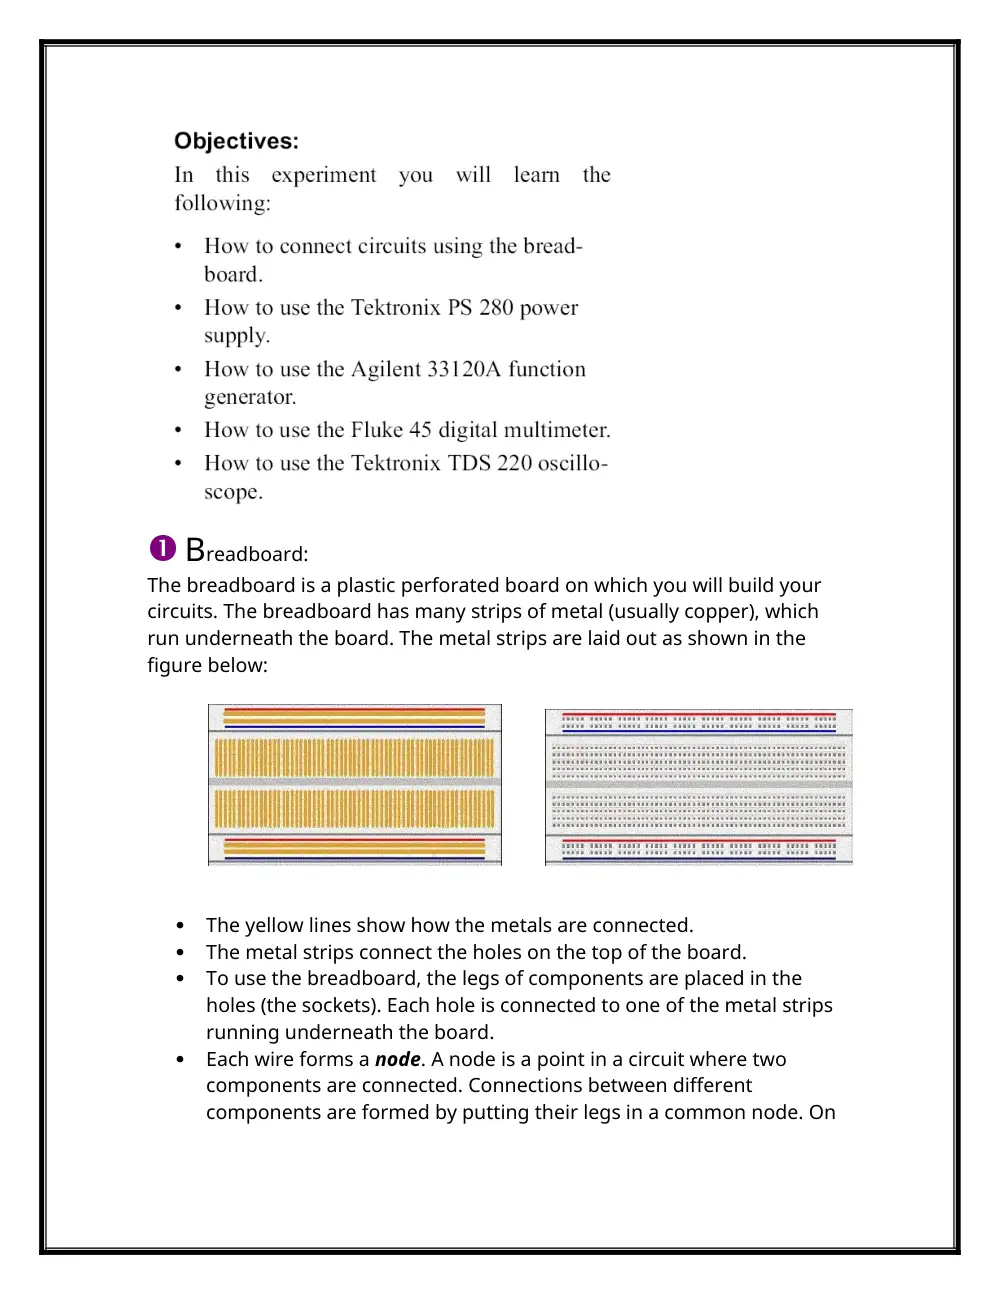
The breadboard is a plastic perforated board on which you will build your
circuits. The breadboard has many strips of metal (usually copper), which
run underneath the board. The metal strips are laid out as shown in the
figure below:
The yellow lines show how the metals are connected.
The metal strips connect the holes on the top of the board.
To use the breadboard, the legs of components are placed in the
holes (the sockets). Each hole is connected to one of the metal strips
running underneath the board.
Each wire forms a node. A node is a point in a circuit where two
components are connected. Connections between different
components are formed by putting their legs in a common node. On
the breadboard, a node is the row of holes that are connected by the
strip of metal underneath.
Note: The long top and bottom row of holes are usually used for power
supply connections.
Power Supply:
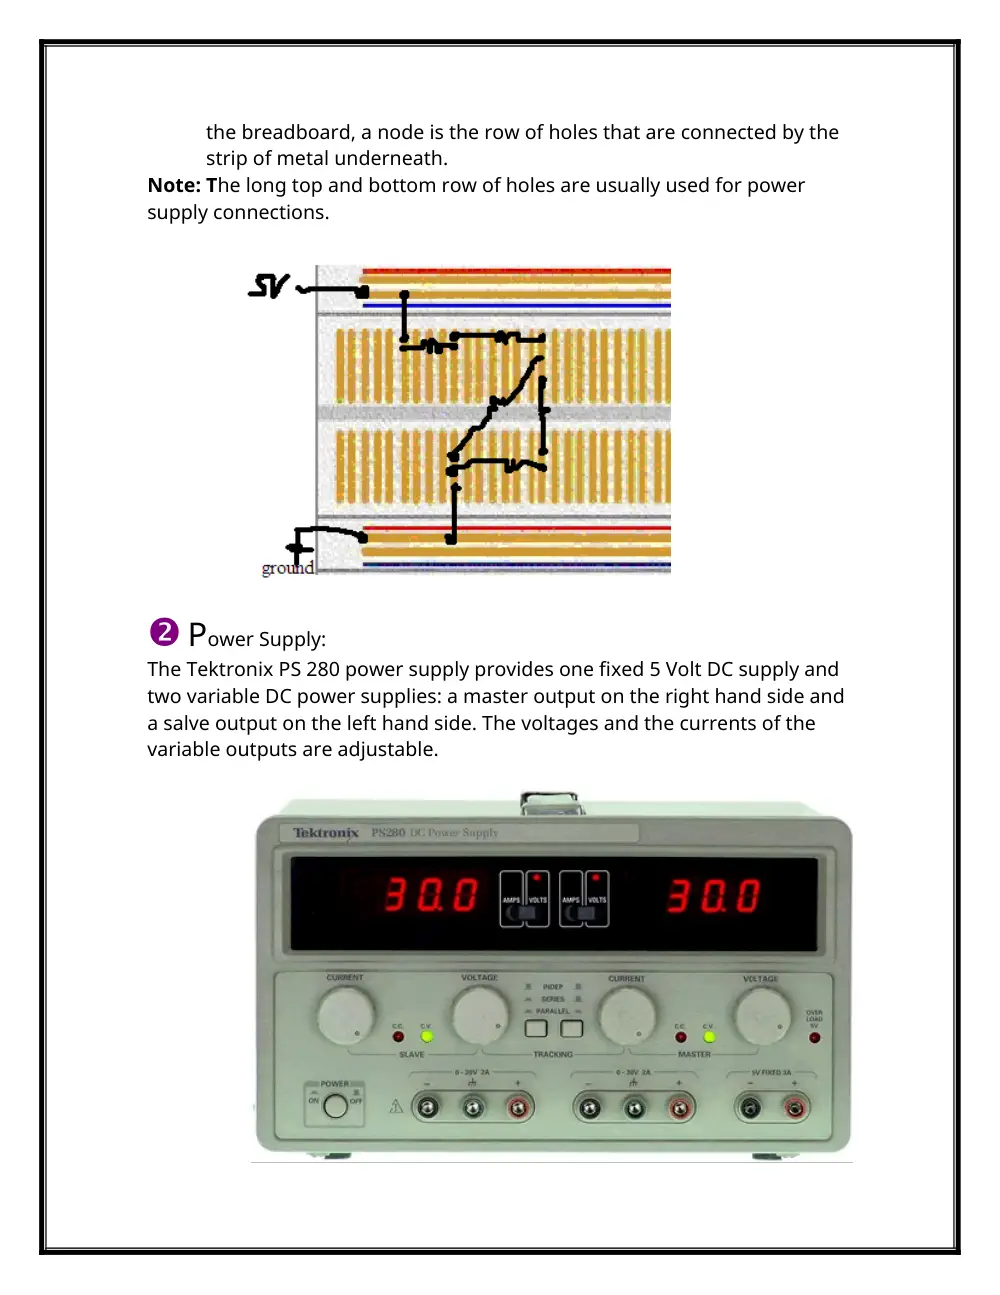
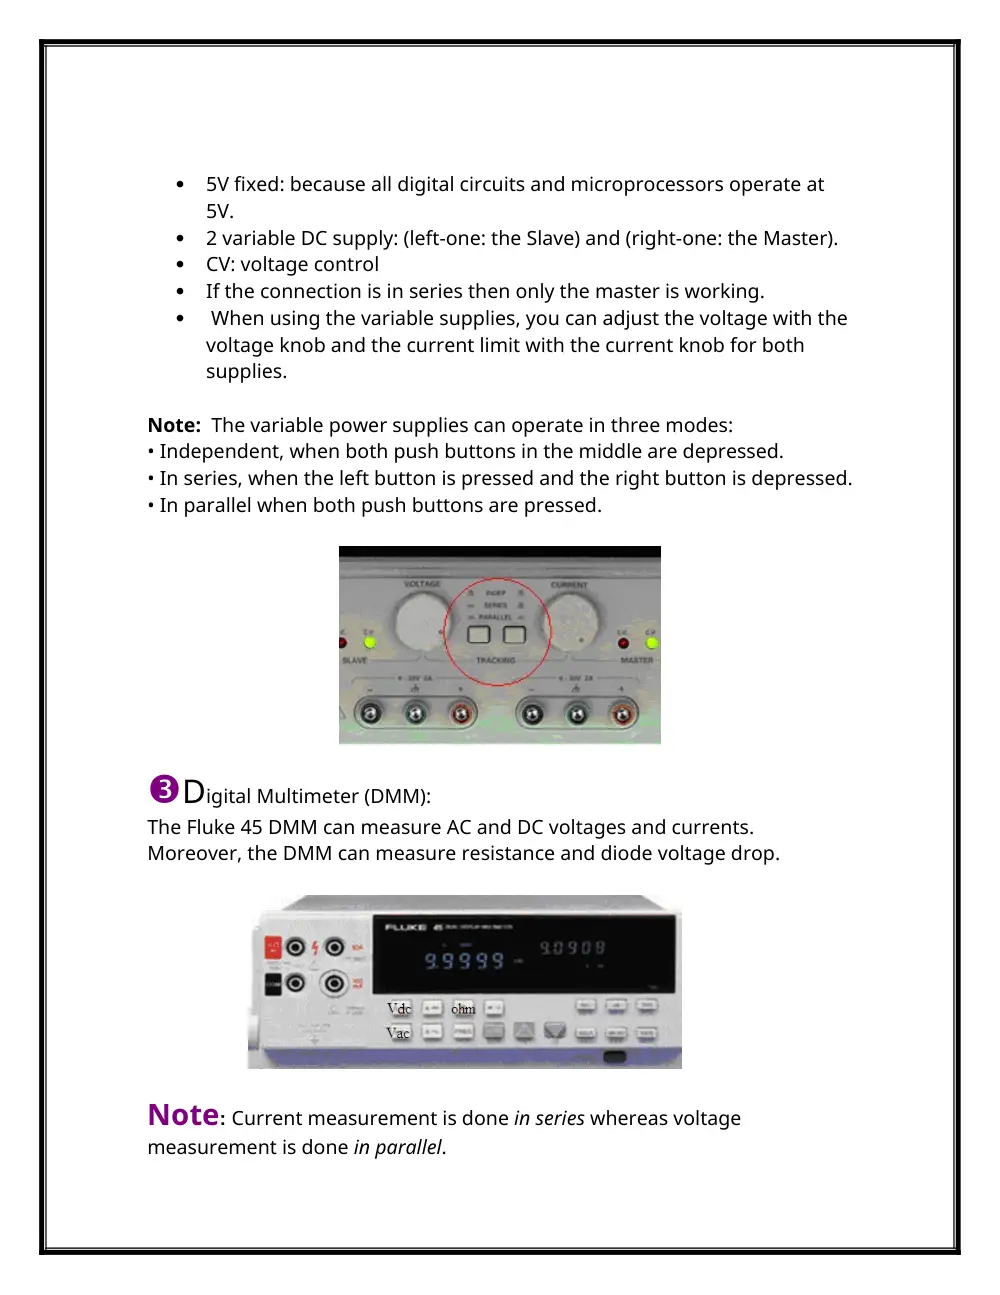
The Tektronix PS 280 power supply provides one fixed 5 Volt DC supply and
two variable DC power supplies: a master output on the right hand side and
a salve output on the left hand side. The voltages and the currents of the
variable outputs are adjustable.
5V fixed: because all digital circuits and microprocessors operate at
5V.
2 variable DC supply: (left-one: the Slave) and (right-one: the Master).
CV: voltage control
If the connection is in series then only the master is working.
When using the variable supplies, you can adjust the voltage with the
voltage knob and the current limit with the current knob for both
supplies.
Note: The variable power supplies can operate in three modes:
• Independent, when both push buttons in the middle are depressed.
• In series, when the left button is pressed and the right button is depressed.
• In parallel when both push buttons are pressed.
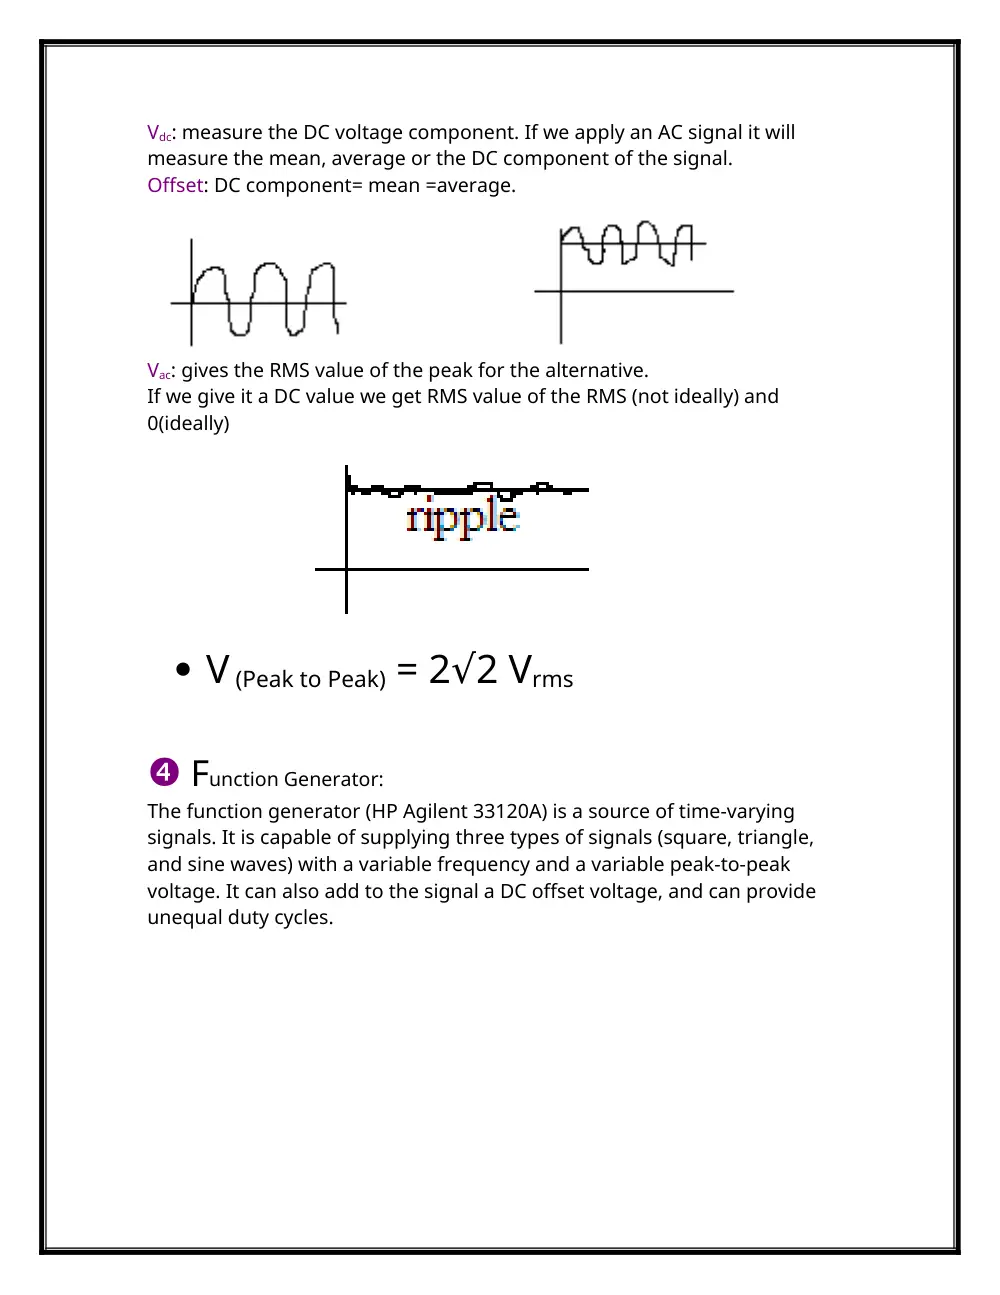
Digital Multimeter (DMM):
The Fluke 45 DMM can measure AC and DC voltages and currents.
Moreover, the DMM can measure resistance and diode voltage drop.
Note: Current measurement is done in series whereas voltage
measurement is done in parallel.
Vdc: measure the DC voltage component. If we apply an AC signal it will
measure the mean, average or the DC component of the signal.
Offset: DC component= mean =average.
Vac: gives the RMS value of the peak for the alternative.
If we give it a DC value we get RMS value of the RMS (not ideally) and
0(ideally)
V (Peak to Peak) = 2 2 V
√
rms
Function Generator:
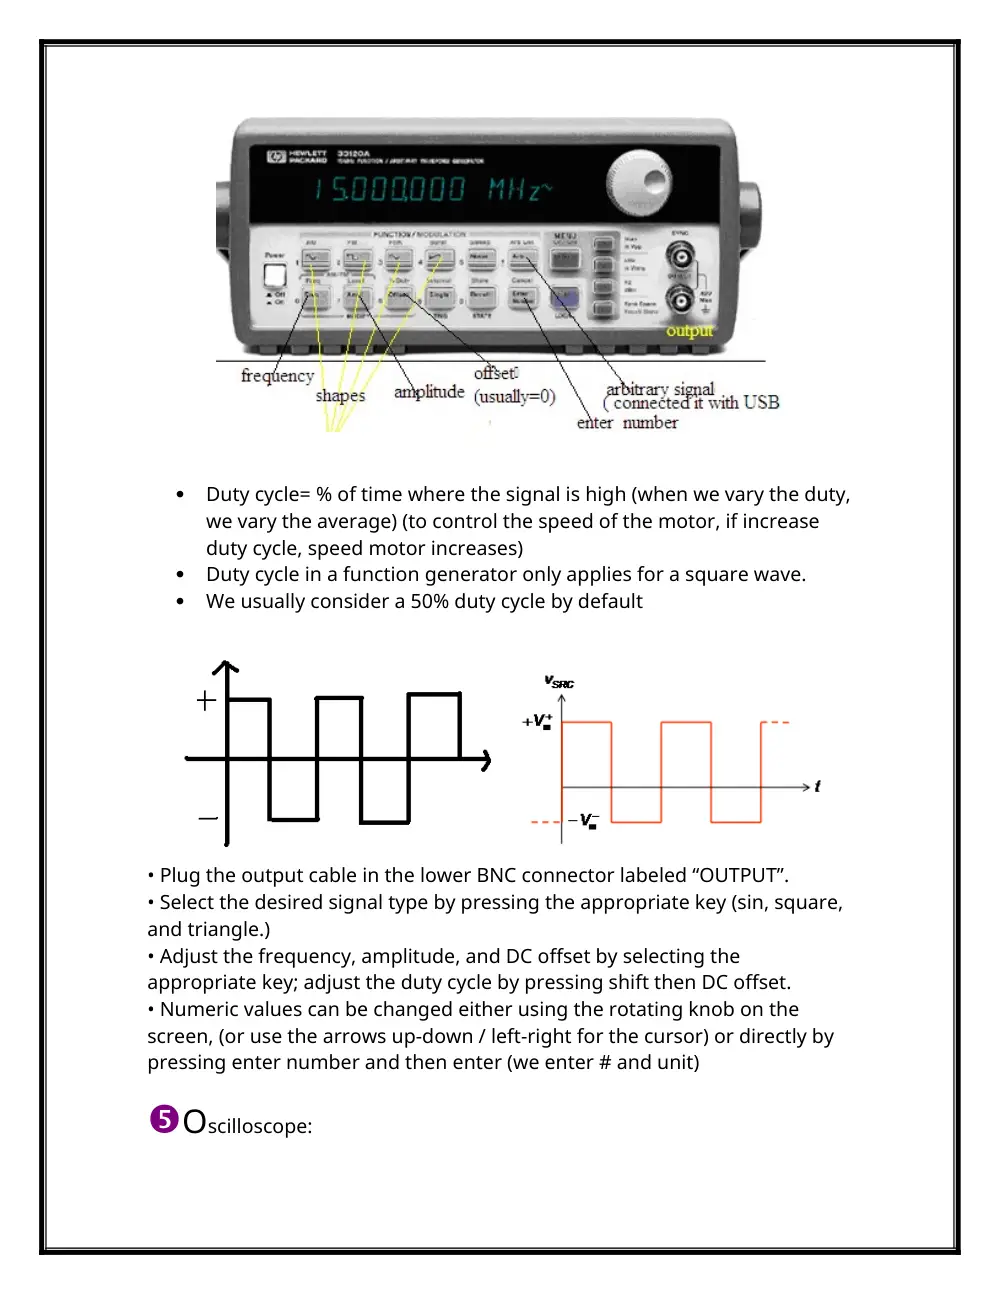
The function generator (HP Agilent 33120A) is a source of time-varying
signals. It is capable of supplying three types of signals (square, triangle,
and sine waves) with a variable frequency and a variable peak-to-peak
voltage. It can also add to the signal a DC offset voltage, and can provide
unequal duty cycles.
Duty cycle= % of time where the signal is high (when we vary the duty,
we vary the average) (to control the speed of the motor, if increase
duty cycle, speed motor increases)
Duty cycle in a function generator only applies for a square wave.
We usually consider a 50% duty cycle by default
• Plug the output cable in the lower BNC connector labeled “OUTPUT”.
• Select the desired signal type by pressing the appropriate key (sin, square,
and triangle.)
• Adjust the frequency, amplitude, and DC offset by selecting the
appropriate key; adjust the duty cycle by pressing shift then DC offset.
• Numeric values can be changed either using the rotating knob on the
screen, (or use the arrows up-down / left-right for the cursor) or directly by
pressing enter number and then enter (we enter # and unit)
Oscilloscope:
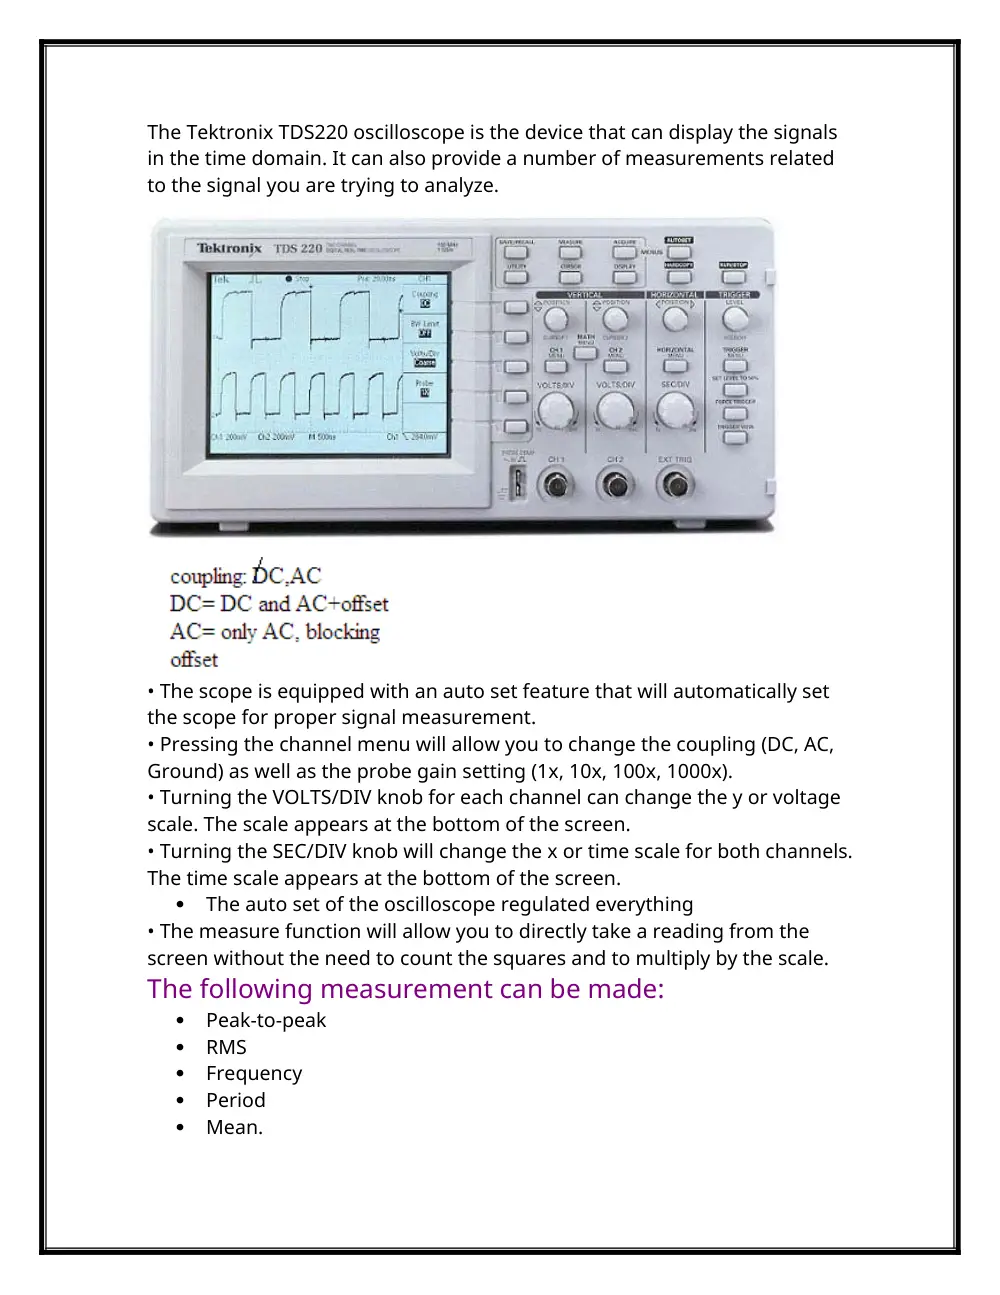
The Tektronix TDS220 oscilloscope is the device that can display the signals
in the time domain. It can also provide a number of measurements related
to the signal you are trying to analyze.
• The scope is equipped with an auto set feature that will automatically set
the scope for proper signal measurement.
• Pressing the channel menu will allow you to change the coupling (DC, AC,
Ground) as well as the probe gain setting (1x, 10x, 100x, 1000x).
• Turning the VOLTS/DIV knob for each channel can change the y or voltage
scale. The scale appears at the bottom of the screen.
• Turning the SEC/DIV knob will change the x or time scale for both channels.
The time scale appears at the bottom of the screen.
The auto set of the oscilloscope regulated everything
• The measure function will allow you to directly take a reading from the
screen without the need to count the squares and to multiply by the scale.
The following measurement can be made:
Peak-to-peak
RMS
Frequency
Period
Mean.
• The scope is equipped with an auto set feature that will automatically set
the scope for proper signal measurement.
Experiment 3
Voltage Dividers and Thévenin’s Theorem
How do we find the bleeder current I1?
We first connect the circuit of Fig A.1 maintaining a constant voltage of 10V
at the input. With zero load current, (i.e. rheostat open), we measure the
bleeder current I1 (in mA). We also measure and record the voltages VB to
ground, and VA to ground.
We measure the bleeder current I1 with the use of the digital
multimeter.
All currents in the circuit must pass through the ammeter. We connect
them (components- especially the bleeder current I1 and the
ammeter)) in series not in parallel because if we connect them in
parallel the current would be divided.
An ammeter must have a low resistance.
To measure the current, the circuit must be broken to allow the
ammeter to be connected in series.
The connection of the ammeter
How do we find the load resistance R for different load conditions?
Definitions:
A rheostat is an adjustable resistor used in applications that require
adjustments of current or the varying resistance in electric circuits.
The voltmeter= potentiometer is what measures unknown voltages
by balancing it.
We connect the rheostat in the circuit and adjust it to draw 2 mA by the
digital multimeter of load current while maintaining V=10V, measured. We
measure and record the bleeder current and the voltages VB and VA. We
open the load resistor RL, with out varying the setting of the arm. We
measure and record the resistance to which it was set to draw 2 mA of load
current. We reconnect RL after this measurement (by the digital multimeter).
In the circuit of figure A.1, how can we find a bleeder current of a certain
value without changing the given resistances or using any new ones?
Connect a rheostat across the bleeder resistors. Connect the ammeter
across nodes B and C (in series with I1) and vary the arm of the rheostat until
we get the required current (2mA for example) on the ammeter as a bleeder
current.
Remove the rheostat from the circuit and measure its resistance value by
plugging the probes in the
socket in the digital multimeter and
press the ohm bottom.
How do we get the required value of a certain resistor?
If we didn’t have the required design-value resistor, we adjust a
potentiometer connected as a rheostat to the desired value, or make up the
resistor from a combination (series, parallel) of the other resistors. Or simply
measure the value using a digital multimeter (according to the current
value).
How does the load current vary with the load resistance R? Explain
why.
The load current decreases as the load resistance increases. This is a logical
observation since current and resistance are inversely proportional with
respect to voltage (By Ohm's law).
What is the effect on bleeder current I1 as the load current increases?
Explain why.
As the load current increases, the bleeder current I1 decreases. Even though
the source current is not constant, we can see that the general sense of
linear relationship between the three currents conserved: IS = I1 + IL.
What is the effect on the voltages VA and VB at the divider taps as the
load current increases? Explain why.
Both VA and VB decrease as the load current increases. This is valid since
these voltages are constant multiples of the bleeder current and the bleeder
current decreases with the increase in load current.
What are the methods for finding Vth and Rth?
Method 1:
Measure open circuit voltage (Vth) and put a short circuit in the place of the
supply to measure Rth (across A and B) with a digital multimeter. So open
circuit Vth and keep RL in place and measure Rth using multimeter across A
and B.
Method 2:
Apply two different resistors on RL and measure the voltage across it. In the
circuit below:
We find
and
Solve two equations with two unknowns and find Vth and Rth.
Method 3- The Matched Impedance Method:
We use a potentiometer as a variable resistance between the AB terminals
of the circuit of the above figure. We vary the resistance until load voltage
drops to half of the measured VTH (open-circuit voltage.) Then we
disconnect the load resistance and measure its resistance with the
multimeter.
RL=Rth → VL=Vth/2 and thus Vth= Voc and RL=Rth
Simplified Procedure:
open circuit V and measure Vth
vary the arm of the rheostat until VL= ½ Vth and this RL= Rth since Vth =
VOC (from circuit C.4 and by voltage division)
Experiment 4
RC and RLC Circuits
What are the different ways for measuring the phase shift?
Method 1:
Using the function generator, apply a sinusoidal voltage (Vaf = 6 V
peak-to peak) of frequency 5 KHz to the input of the circuit shown in
Fig. 1
By the use of the oscilloscope connect channels 1 and 2 across VBA and
VDA
Superpose the two traces of VBA and VDA to have the same horizontal
axis and adjust the VOLT/DIV and SEC/DIV settings to get stable traces.
Place the two vertical cursors on each peak
press the measure bottom and read ∆T and T(the period)
Find
Note: The phase difference can be measured from the time instants at which the
waveforms cross the time axis. Consider Vaf to be of the form 3sinώ V and VBA to
be of the form V.
Method 2:
We use the formula:
Method 3- Lissajous method:
Leaving the connections the same as in Part A.1., set the sweep rate to X-Y
mode. VBA and VDA will be connected to the X and Y channels of the
oscilloscope. An ellipse (called the Lissajous figure) will be observed on the
oscilloscope screen resulting from the superposition of two perpendicular
sinusoidal signals VBA and VDA. Adjust the VOLTS/DIV controls of X and Y and
use the vertical and horizontal POSITION knobs to center the ellipse
symmetrically as shown in Fig. 2.
Find 2B and 2A by placing the horizontal cursor with the same
horizontal axis and adjust the VOLT/DIV and SEC/DIV settings to get
stable traces and measure the divisions or simply count the divisions
Apply the formula:
General Remarks on Lissajous:
Our objective is to find whether VOUT is lagging or leading VIN
A well known and readily applied method of measurement of phase
difference 8 between two sinusoidal signals with a single-trace oscilloscope
is based on the elliptic display on the screen obtained by feeding the two
signals as inputs to X and k' terminals of the CRO [I]. Here sin181 is deduced
as the ratio of the intercept of the ellipse on the x- or y-axis to the distance
between the projections of the extreme points of the ellipse on the same
axis.
One method for measuring phase shift is to use XY mode. This involves
inputting one signal into the vertical system as usual and then another
signal into the horizontal system. (This method only works if both signals are
sine waves.) This set up is called an XY measurement because both the X and
Y axis are tracing voltages. The waveform resulting from this arrangement is
called a Lissajous pattern (named for French physicist Jules Antoine Lissajous
and pronounced LEE-sa-zhoo). From the shape of the Lissajous pattern, you
can tell the phase difference between the two signals. You can also tell their
frequency ratio. Figure 6 shows Lissajous patterns for various frequency
ratios and phase shifts.
How do we know if the voltage leads or lags from the oscilloscope?
For either the lag or the lead networks we apply the output voltage to
channel one of the oscilloscope and that of the input voltage to
channel two.
Superpose the two curves on the same horizontal axis and adjust the
VOLT/DIV and SEC/DIV settings to get stable traces
Decrease the V/div to zoom the figure
Observe the leading and lagging waveforms
Remark: We can never measure the current using the oscilloscope. If
we need the current waveform we measure the voltage and divide it by the
resistance R.
Note: The maximum frequency is the frequency at resonance.
Lag networks: (Low-Pass Filter)
Lead networks: (High-Pass Filter)
RLC (Band pass filter):
Explain the shape of the output waveforms of the lag and lead
networks to square wave inputs of various frequencies, with
particular reference to the fundamental property of a capacitor
not changing its voltage instantaneously.
The lag and the lead networks differ in the output voltage.
In the lag network, as the frequency increases, the shape of Vout tends to
deviate more from the square shape. In the lead network, as the frequency
decreases, the shape of Vout tends to deviate more from the square shape.
Since the fundamental property of a capacitor states that the voltage can’t
change instantaneously, it changes exponentially Vc = V0 * e (-t/RC) with a time
constant parameter ô = RC.
The relationship between the RC time constant and the frequency of the
square wave so that:
If 1/F >>RC (RC is small):
The lag network does not appreciably distort the square wave.
The lead network is a differentiator.
If 1/F <<RC(RC is large):
The lead network does not appreciably distort the square wave.
The lag network is an integrator.
What should be the relationship between the RC time constant and the
frequency of the sinusoidal input so that:
The lag network does not introduce appreciable attenuation: RC and F
should be both small
The lead network does not introduce appreciable attenuation: RC and
F should be both large
These relationships are the same for the sinusoidal and square wave input
functions.
Fourier theorem states that any periodic function can be expressed as the
sum of a series of sine and cosine terms, each of which has specific
amplitude and phase coefficients.
Note: The cutoff frequency is defined as the frequency at which the output
amplitude is 1/√2 times its maximum value.
A low-pass filter is a filter that passes low frequency signals but attenuates
signals with frequencies higher than the cutoff frequency.
Cutoff frequency= 1/ (2╥ x R x C)
A high-pass filter is a filter that passes high frequencies well, but attenuates
frequencies lower than the cutoff frequency. Cutoff frequency= 1/ (2╥ x R x
C)
The cut-off frequency for the series RC circuit has the value 1/ (2╥ x R x C)
whether the circuit is configured as a low-pass filter or a high pass filter.
Considering one of the RC elements to be source impedance, and the
other to be load impedance, explain the integrating and differentiating
action of these networks on the basis of the relationship between source
and load impedances in the s domain.
The integrating and differentiating action could be explained using the S-
domain.
In Integrator we consider only high frequencies, so that the capacitor has
insufficient time to charge up, so the input voltage approximately equals the
voltage across the resistor.
The formula of the integrating low pass lag filter where R is the source
impedance and C is the load impedance is H(s)=wc/(wc+s)=(1/RC)/[s+(1/RC)]
In Differentiator, we consider only low frequencies, so that the capacitor has
time to charge up until its voltage almost equals that of the source.
The formula of the differentiating high pass lead filter where C is the source
impedance and R is the load impedance is: H(s)=s/(wc+s)=s/[s+(1/RC)]
The sum of the average voltages across the capacitor and that across
the resistor will be equal to the average value of the input voltage:
VDC= VCDC + VRDC
How do we calculate the cutoff frequency F in lead or lag networks?
Measure the output voltage and get the peak value (or maximum
value)
Find Vmax/ √2
Vary the frequency up and down until we get the same output voltage
We will get two values of the cutoff frequency (up and down
movements).
Note: Bandwidth is defined as f2 - f1, where f2 and f1 (f2 > f1) are the frequencies
where the magnitude of the transfer function is times its maximum value.
How do we calculate the bandwidth in the RLC circuit?
Measure the output voltage and get the peak value (or maximum
value)
Find Vmax/ √2
Vary the frequency up and down until we get the same output voltage
We will get two values of the cutoff frequency (up and down
movements).
SIMILAR TO THE ABOVE (SO FAR)
With the two calculated values of the cutoff frequencies f1 and f2, find
f2- f1 and find the bandwidth.
Experiment 5
Diode Rectifier Circuits
Define a rectifier.
A rectifier circuit converts an alternating input to a
unidirectional output. This may be accomplished
by using unidirectional devices, which allow the
passage of current in one direction through the
device but not in the opposite direction.
Figure 1.4.1
vD
iD
Forward
bias
Reverse
bias
Breakdown
region
vBD
The most common types of unidirectional devices are semiconductor
diodes.
Ideally, a diode behaves as a perfect switch. In the forward direction it has a
zero resistance and zero offset voltage. In the reverse direction, it behaves
as an open circuit.
The half-wave rectifier blocks the negative variations of the input; the output
is approximately equal to the input when the input is positive, and is zero
otherwise. In the full-wave rectifier, on the other hand, the output is
approximately equal to the absolute value of the input.
What are the important characteristics of the rectifier?
The most important characteristics which must be specified for a rectifier
circuit are:
1. DC output voltage.
The DC output voltage VDC is: (from the highest to the
lowest) center-tapped full- wave rectifier, bridge full-
wave rectifier (the output is always approximately
equal to the absolute value of the input), and then
half-wave rectifier (DC output is zero half of the time).
The full wave-rectifiers have a greater DC output
voltage than the half-wave rectifier.
2. ripple-factor, defined as a ratio of the peak-to-peak ripple (voltage
variation in the output) to the average voltage across the load.
The three circuits have approximately the same ripple
peak-to-peak voltage. However, the bridge rectifier has a
ripple peak-to-peak voltage Vpp slightly less due to the
two diodes that are conducting at any time.
3. Average and peak currents in each diode.
The average and peak currents in the rectifiers are the
greatest in the half-wave rectifier, and they are
approximately equal in both full-wave rectifiers since
power used is relatively the same amount at the
output resistance which is approximately = P= V2rms
2 / R.
4. Peak inverse voltage (PIV) for each diode.
The descending order is by the value of the PIV is:
center-tapped full- wave rectifier, half-wave rectifier
where the PIV equals the peak input voltage; bridge
rectifier (equals half that of the center-tap full- wave).
5. Percent regulation, defined as (VL – Vo / Vo) x 100, where V0 is the no-load
voltage and VL is the full-load voltage.
The percent regulation could be represented in the
following descending order: the bridge full-wave
rectifier, the half-wave rectifier and the center-tapped
full-wave rectifier.
6. Transformer requirements, such as the secondary winding voltage and
current ratings.
According to the current ratings, we have seen that
the half-wave rectifier requires the greatest secondary
current while the other two require only half of that
value. Therefore, the magnetic polarization is
strongest in the half-wave rectifier and the center-tap
rectifier.
Notes:
It should be carefully noted that these characteristics, depend, in general,
upon the type of load connected to the rectifier output, i.e., whether it is
resistive, capacitive or inductive.
A transformer is used for stepping-down the input AC voltage. It is a device
that transmits AC power from one circuit to another through magnetic
coupling, often with no conductive connection. The transformation process
obeys the relationships: and, where subscripts 1 and 2 refer to the primary
and secondary sides, respectively.
A capacitor can be connected in parallel at the output of the rectifier to
smooth the voltage variations. An approximate analysis for a full-wave
rectifier with a capacitor filter gives the following:
Where V2max is the peak AC input voltage (at the secondary of the
transformer), RL is the load resistance, C is the filter capacitance, and f is the
frequency of the AC voltage.
Definition: rectifier circuit converts an alternating, or bidirectional,
current or voltage to a unidirectional one.
Half- Wave Rectifier:
iL
vL
RL
Vmsint
VD0
rD
(a)
_
+
_
+
vL
Vm
t
Figure 1.3.1
(b)
-
VD0
Vmsint
2
Full- wave Rectifier:
Bridge Rectifier:
Under what conditions would each of the circuits be most
advantageous?
Full- wave rectifiers are most advantageous for applications that need
power for small amounts of time.
vL
v1
v2
D1
D2
RL
c
a
b
d
iL
(b)
AC supply
_
+
_
+
_
+
VDC
Vm
vL
t
Figure 1.3.2
(c)
Vmsint
D4
D1
D2
D3
vL
RL
(a)
AC supply
Vmsint
_
+
+
_
iL
Bridge- full- wave rectifiers are cheaper and easier to build than center-
tapped ones.
Half- wave rectifier is advantageous for:
Applications such as charging a battery because this operation takes
more time (twice the time of a full-wave rectifier.
Simplicity and cheap cost.
Note:
For each of the circuits in Figs 1, 2, and 3 we adjust the load resistor to get
IDC = 50 mA and we observe the output across the load on the oscilloscope.
How do we find the different quantities mentioned in the Theory
section?
VDC: DC output voltage measured by the mean value on the
oscilloscope screen
V ripple: peak to peak value on the oscilloscope screen
IDC= 50 mA (given) determined by the digital multimeter
I peak= V peak/R (R found by adjusting the rheostat)
PIV: peak inverse voltage. It could be calculated by the oscilloscope
across the diode
By the oscilloscope place the horizontal cursor adjust the VOLT/DIV
and SEC/DIV settings to get stable traces
Note: Vr<<VDC so we need to amplify the ripple
Does V DC increase appreciably with C for all values of C?
Does Vr decrease appreciably with C for the values of C used in the
experiment?
VDC increases exponentially as C increases.
Vr decreases exponentially but not appreciably.
How does the presence of the capacitor affect the regulation of the
circuit?
The presence of a capacitor in parallel with the load stabilizes and
maintains the output voltage. Moreover, the presence of a capacitor
decreases Vr and thus decreases the ripple voltage.
How do we measure the DC open circuit voltage?
Remove the resistor
Measure the mean value across the output by the oscilloscope
JOUJOU
For certain required ripple voltage and DC voltage/current at the load:
What should be the RMS voltage rating of the secondary of the
transformer?
Using the formulas from the Theory section we have that:
What should be the value of the capacitor?
Experiment 6
LEDs and Zener Diodes
Id= Ise(Vd/nVT)
VDD=VD+IDR
If we replace the diode by its incremental resistance we would have by KVL:
ID (R+ = VD- VDD
If we know any thing we can solve for R.
What happens when we reverse the diode?
The power dissipated in the reverse direction doesn’t have any useful
purpose. It can be eliminated by putting the diode or LED in the forward
direction, so this will rectify the input voltage to only positive cycle and
would eliminate the reverse direction power dissipation. We can also
eliminate by superimposing the DC component of the voltage source to the
AC source.
Connect the circuit of Fig. 1 using the red light emitting diode (LED).
Starting from a value of 0.5V, we increase V in steps of 0.5 V and we measure
the LED voltage and current for each VS. We do not exceed 30 mA of current
in the diode.
We connect VS power supply starting from the value equal to 0.5 we increase
it by 0.1 respectively. Measure VLED and ILED by the digital multimeter.
Diodes operating in the breakdown region can be used in the design of
voltage regulators are circuits that provide constant DC output voltage in
the changes in this load current and the system power- supply voltage. The
Zener diode regulates the load voltage for the range of load resistance
where the Zener voltage is constant.
By definition the line regulation is the ratio of the change in VZ to the
change in VS, provided that the diode is in the Zener region.
Its AC component is
By definition the load regulation is the ratio of the change in VZ to the
change in ILoad, provided that the diode is in the Zener region.
The maximum current in a Zener diode is determined by taking the
maximum value of the input voltage at no load. So the maximum
current in a Zener diode is determined using:
The minimum current in the Zener diode is determined by taking the
minimum value of the input voltage with a very small resistance
connected to the load. Therefore, the current in the load is at its maximum
value thus the minimum Zener current in the diode can be calculated by the
equation:
Iz min = I total – I loadmax
Thus, operating in the region close to the knee region allows us to
determine the minimum value of the Zener current.
Show that for a Zener voltage regulator, the value of the resistor R
should be chosen using the equation:
For the Zener diode to conduct VZK, IZK, and VS must be at a certain minimum
value. Thus, the load current is at its maximum value. From the Zener
voltage regulator circuit we get:
VS = RIS + VL
VS = R (IZK + IL) + (VZK + rZ IZK)
Due to the above discussed minimum current limit for the Zener diode we
replace VS by its minimum value and IL by its maximum value and solving for
R we obtain the equation:
We connect the circuit and measure VZ when VS is 15 V by a digital
multimeter.
Reduce the value of VS in steps of 0.5 V, and measure V Z and I Z
VZ is measured by