
EECE 310L Report, Fall 2012
American University of Beirut · Electric Circuits Laboratory · 51 pages · Dr. Sara Khaddaj
Showing the first 10 of 51 pages. Download the PDF to see all of it.
More EECE 310L files
Show the text of this file
EECE 310 Lab Report
for Experiment 4
Prepared by Yathreb El-Yaman
201204613 Yae11@aub.edu.lb
Group 1, section 5
October 29 2012
RC and
RLC
Circuits
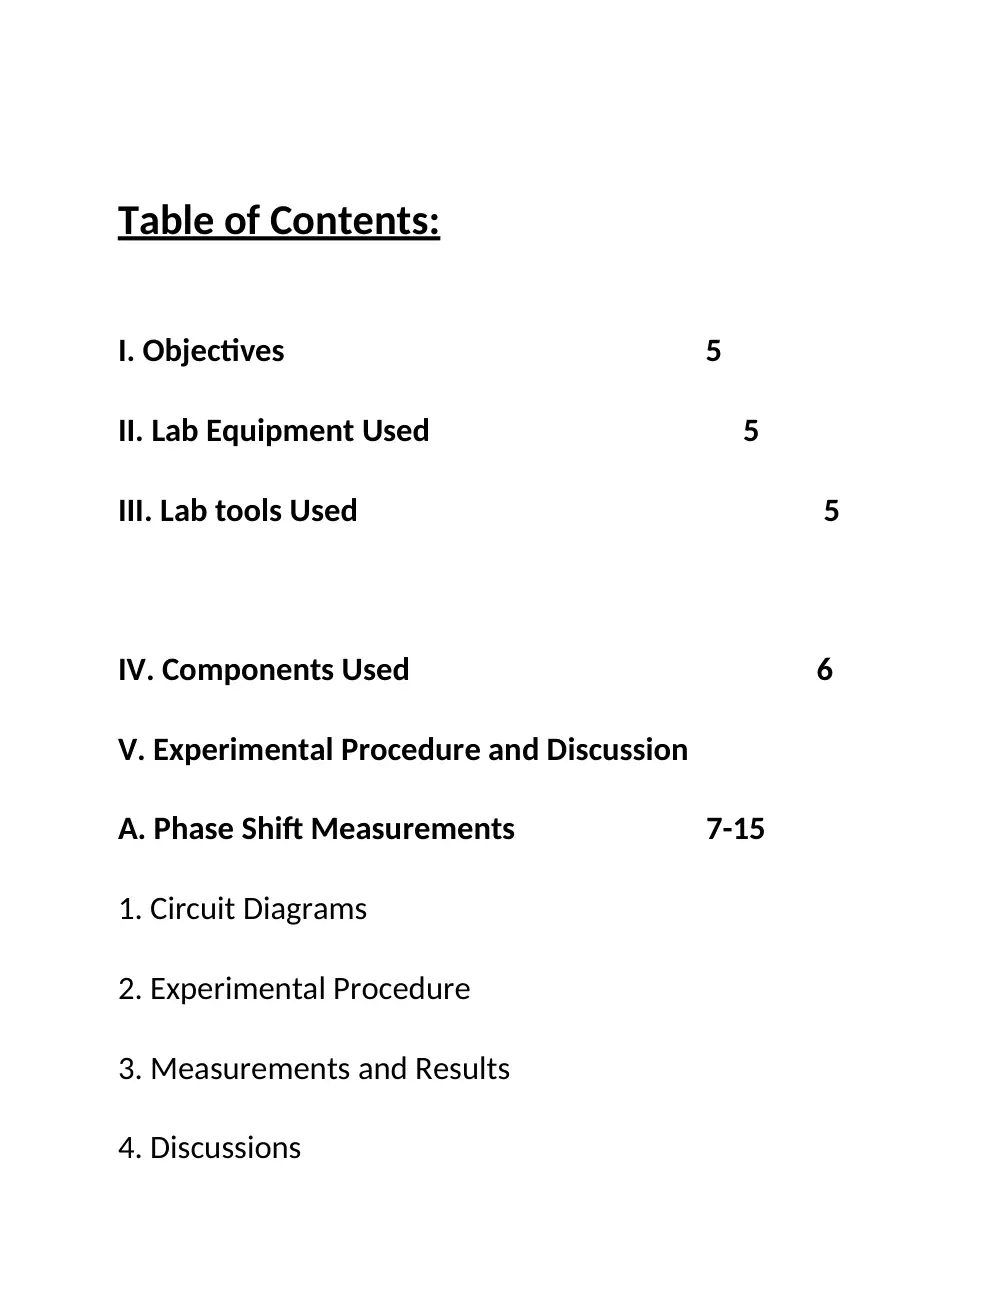
Table of Contents:
I. Objectives 5
II. Lab Equipment Used
5
III. Lab tools Used
5
IV. Components Used
6
V. Experimental Procedure and Discussion
A. Phase Shift Measurements
7-15
1. Circuit Diagrams
2. Experimental Procedure
3. Measurements and Results
4. Discussions
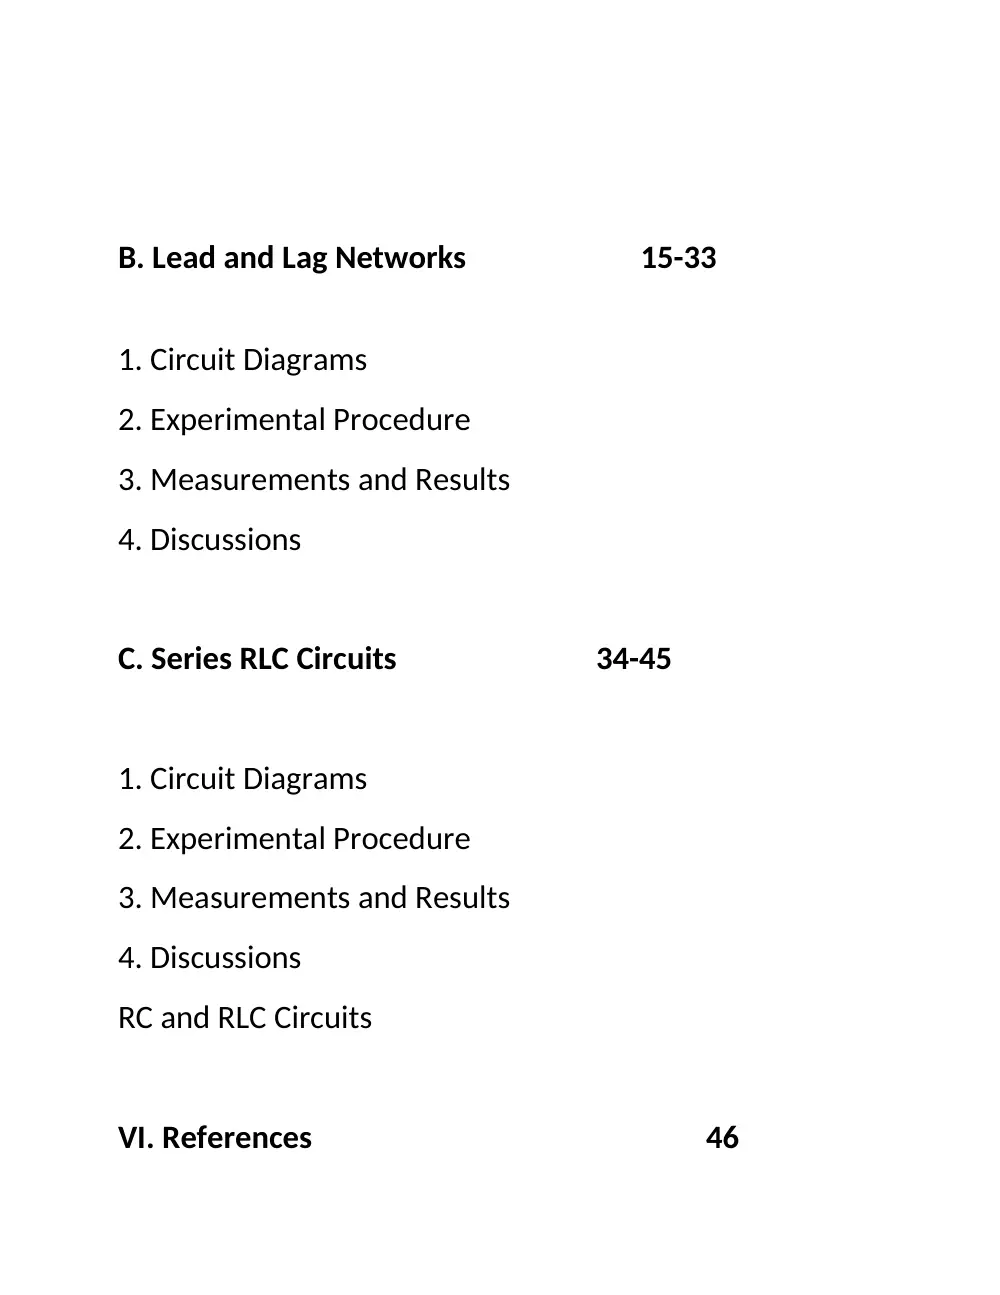
B. Lead and Lag Networks
15-33
1. Circuit Diagrams
2. Experimental Procedure
3. Measurements and Results
4. Discussions
C. Series RLC Circuits
34-45
1. Circuit Diagrams
2. Experimental Procedure
3. Measurements and Results
4. Discussions
RC and RLC Circuits
VI. References
46
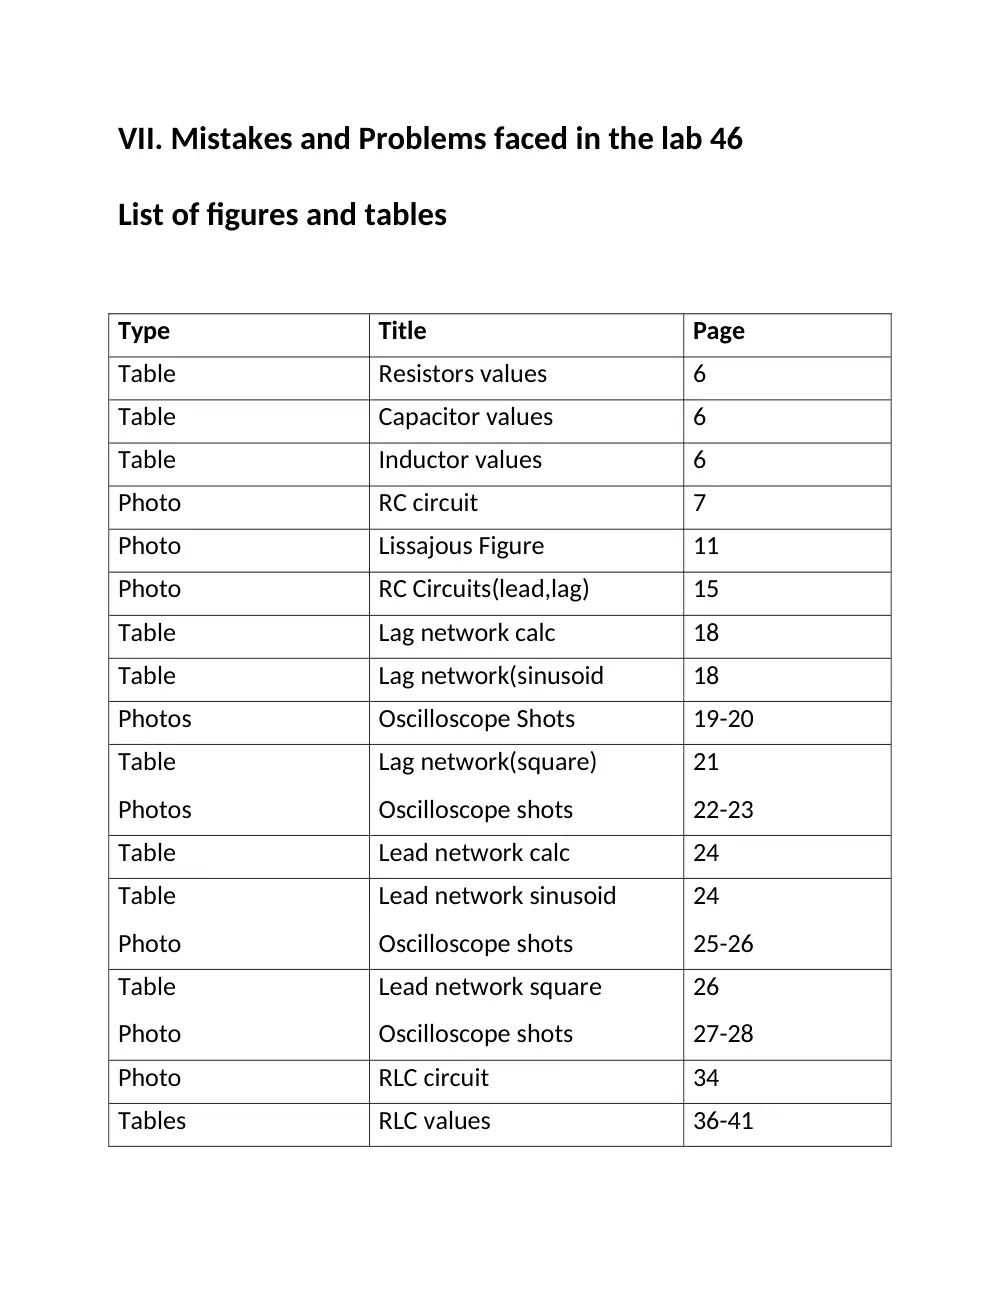
VII. Mistakes and Problems faced in the lab 46
List of figures and tables
Type
Title
Page
Table
Resistors values
6
Table
Capacitor values
6
Table
Inductor values
6
Photo
RC circuit
7
Photo
Lissajous Figure
11
Photo
RC Circuits(lead,lag)
15
Table
Lag network calc
18
Table
Lag network(sinusoid
18
Photos
Oscilloscope Shots
19-20
Table
Photos
Lag network(square)
Oscilloscope shots
21
22-23
Table
Lead network calc
24
Table
Photo
Lead network sinusoid
Oscilloscope shots
24
25-26
Table
Photo
Lead network square
Oscilloscope shots
26
27-28
Photo
RLC circuit
34
Tables
RLC values
36-41
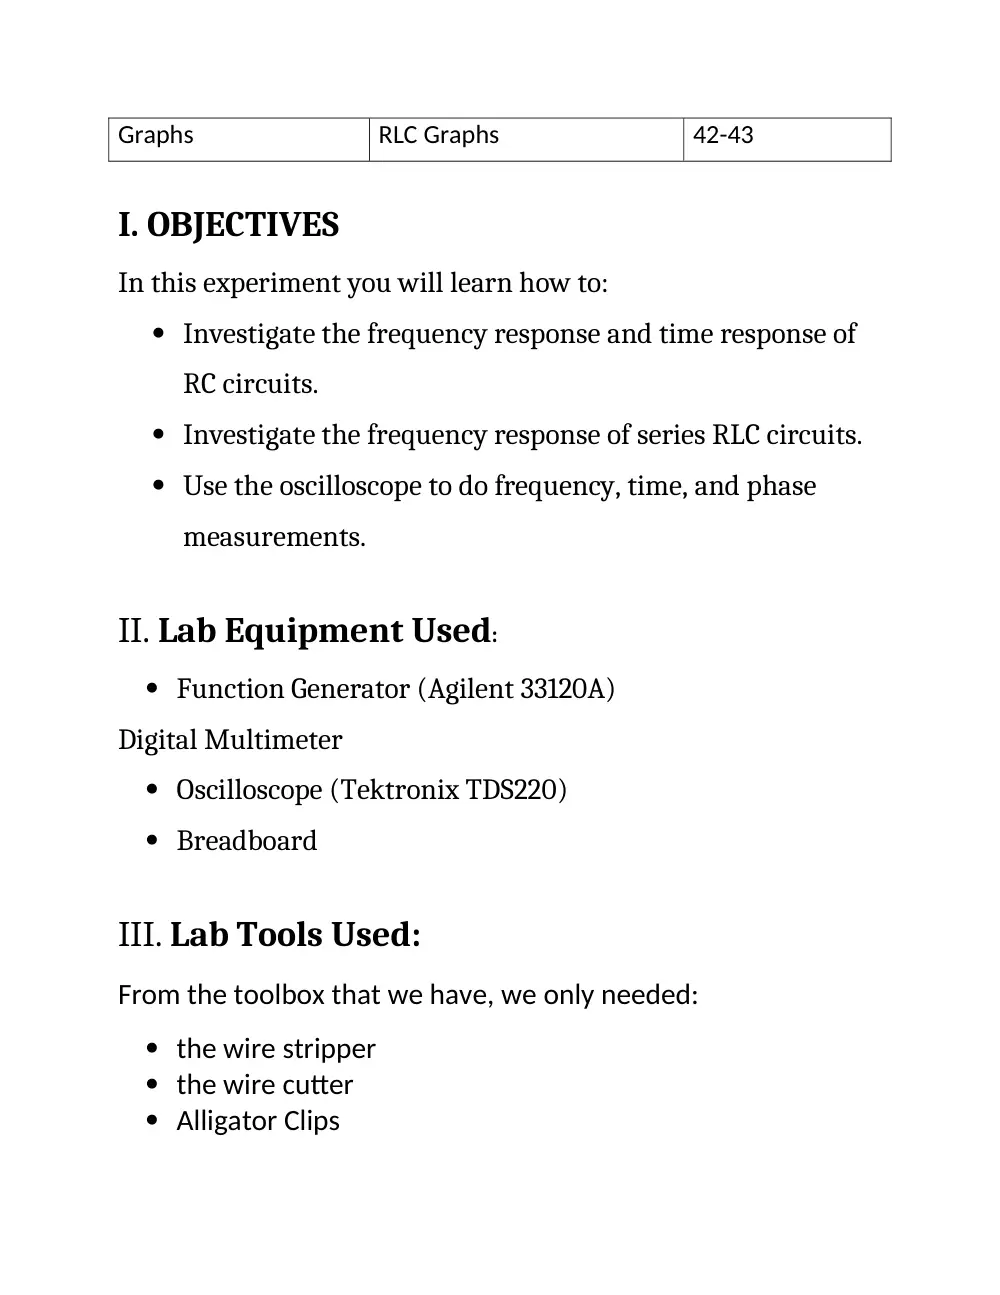
Graphs
RLC Graphs
42-43
I. OBJECTIVES
In this experiment you will learn how to:
Investigate the frequency response and time response of
RC circuits.
Investigate the frequency response of series RLC circuits.
Use the oscilloscope to do frequency, time, and phase
measurements.
II. Lab Equipment Used:
Function Generator (Agilent 33120A)
Digital Multimeter
Oscilloscope (Tektronix TDS220)
Breadboard
III. Lab Tools Used:
From the toolbox that we have, we only needed:
the wire stripper
the wire cutter
Alligator Clips
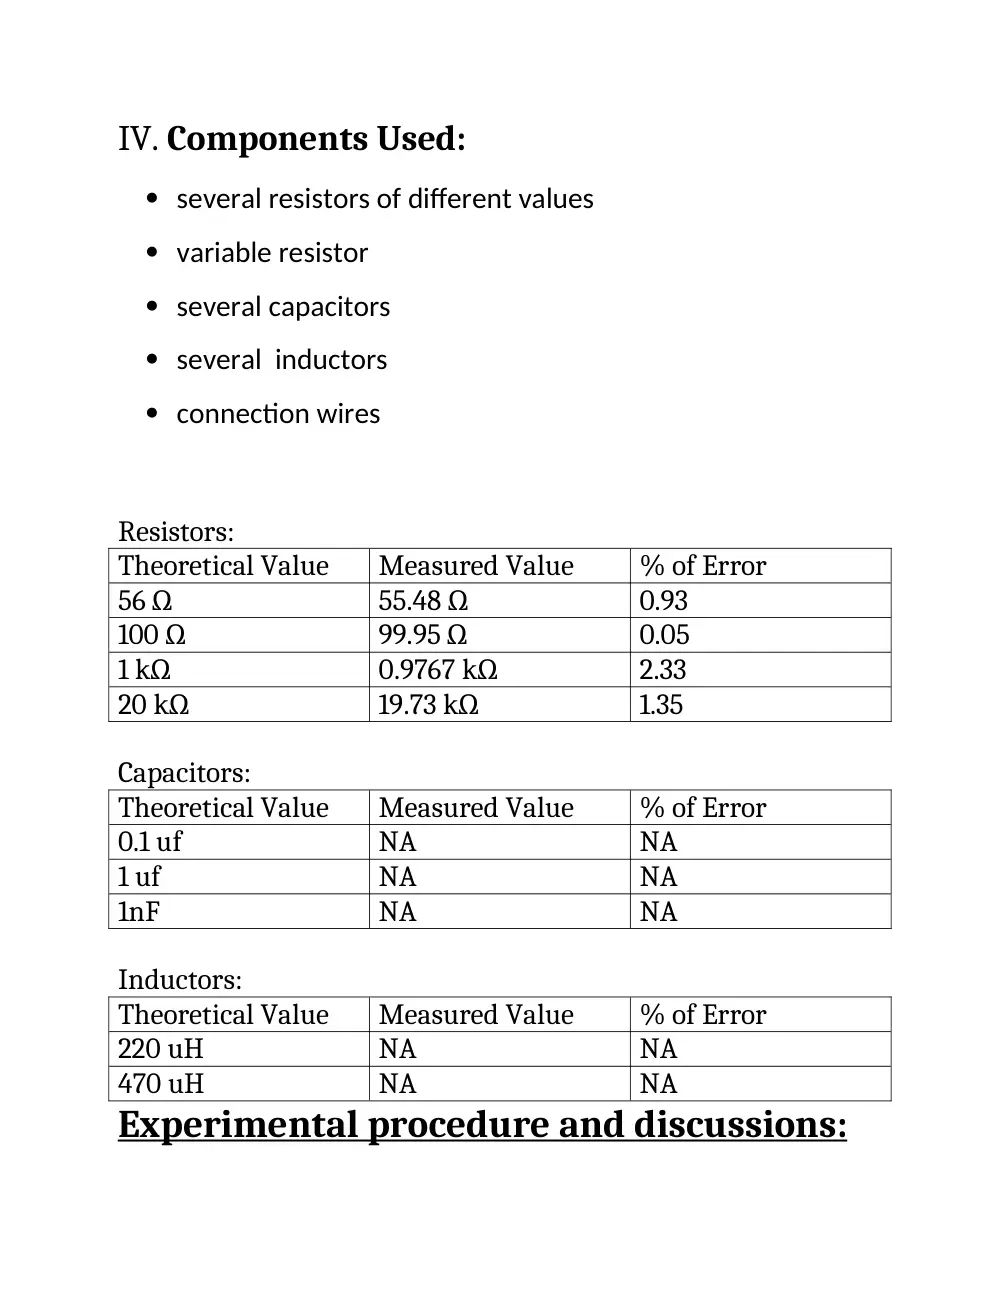
IV. Components Used:
several resistors of different values
variable resistor
several capacitors
several inductors
connection wires
Resistors:
Theoretical Value
Measured Value
% of Error
56 Ω
55.48 Ω
0.93
100 Ω
99.95 Ω
0.05
1 kΩ
0.9767 kΩ
2.33
20 kΩ
19.73 kΩ
1.35
Capacitors:
Theoretical Value
Measured Value
% of Error
0.1 uf
NA
NA
1 uf
NA
NA
1nF
NA
NA
Inductors:
Theoretical Value
Measured Value
% of Error
220 uH
NA
NA
470 uH
NA
NA
Experimental procedure and discussions:
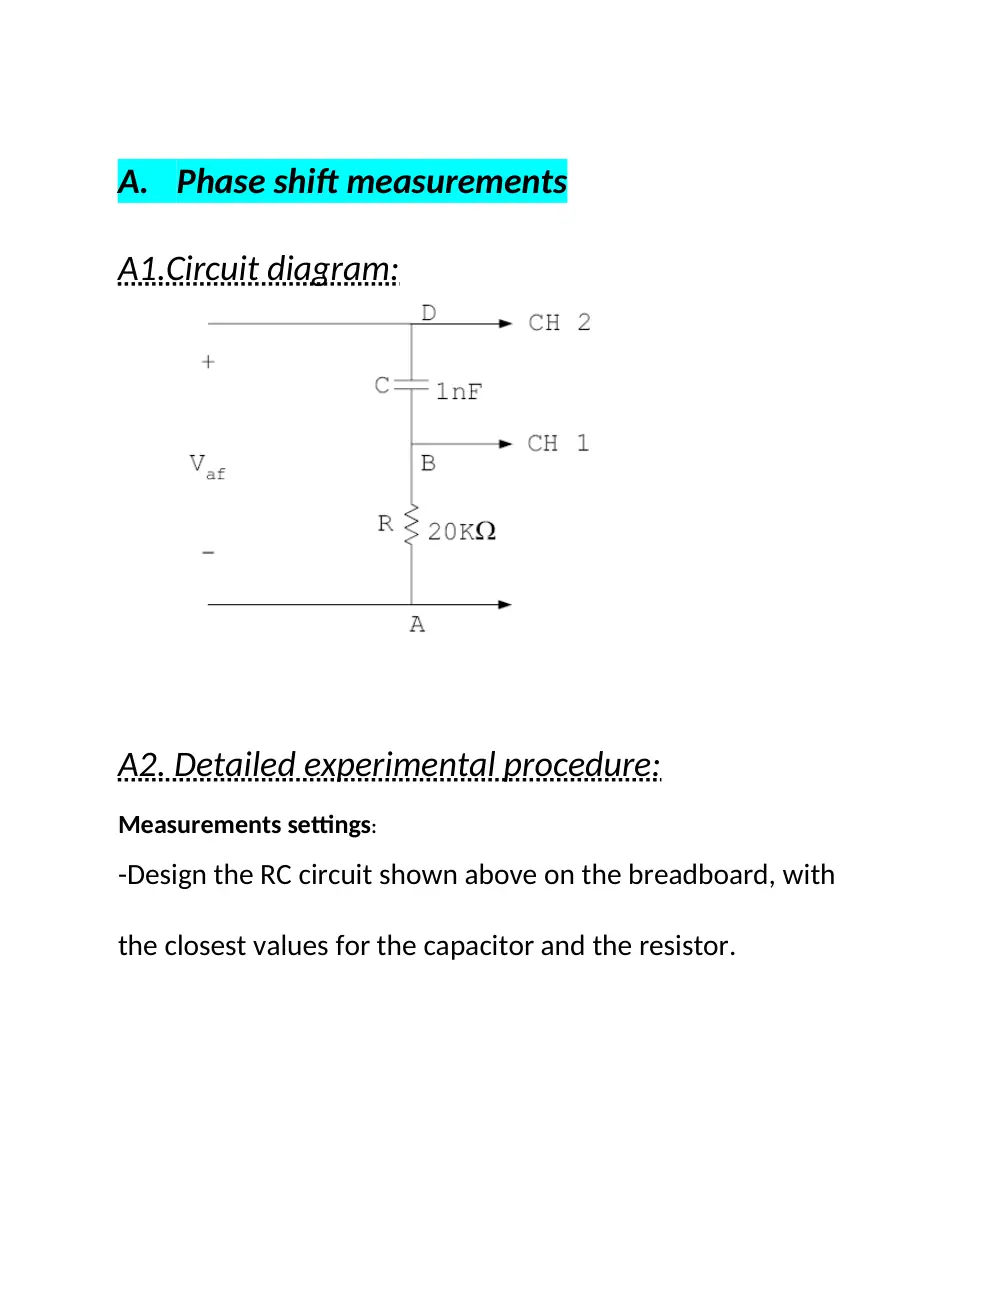
A. Phase shift measurements
A1.Circuit diagram:
A2. Detailed experimental procedure:
Measurements settings:
-Design the RC circuit shown above on the breadboard, with
the closest values for the capacitor and the resistor.
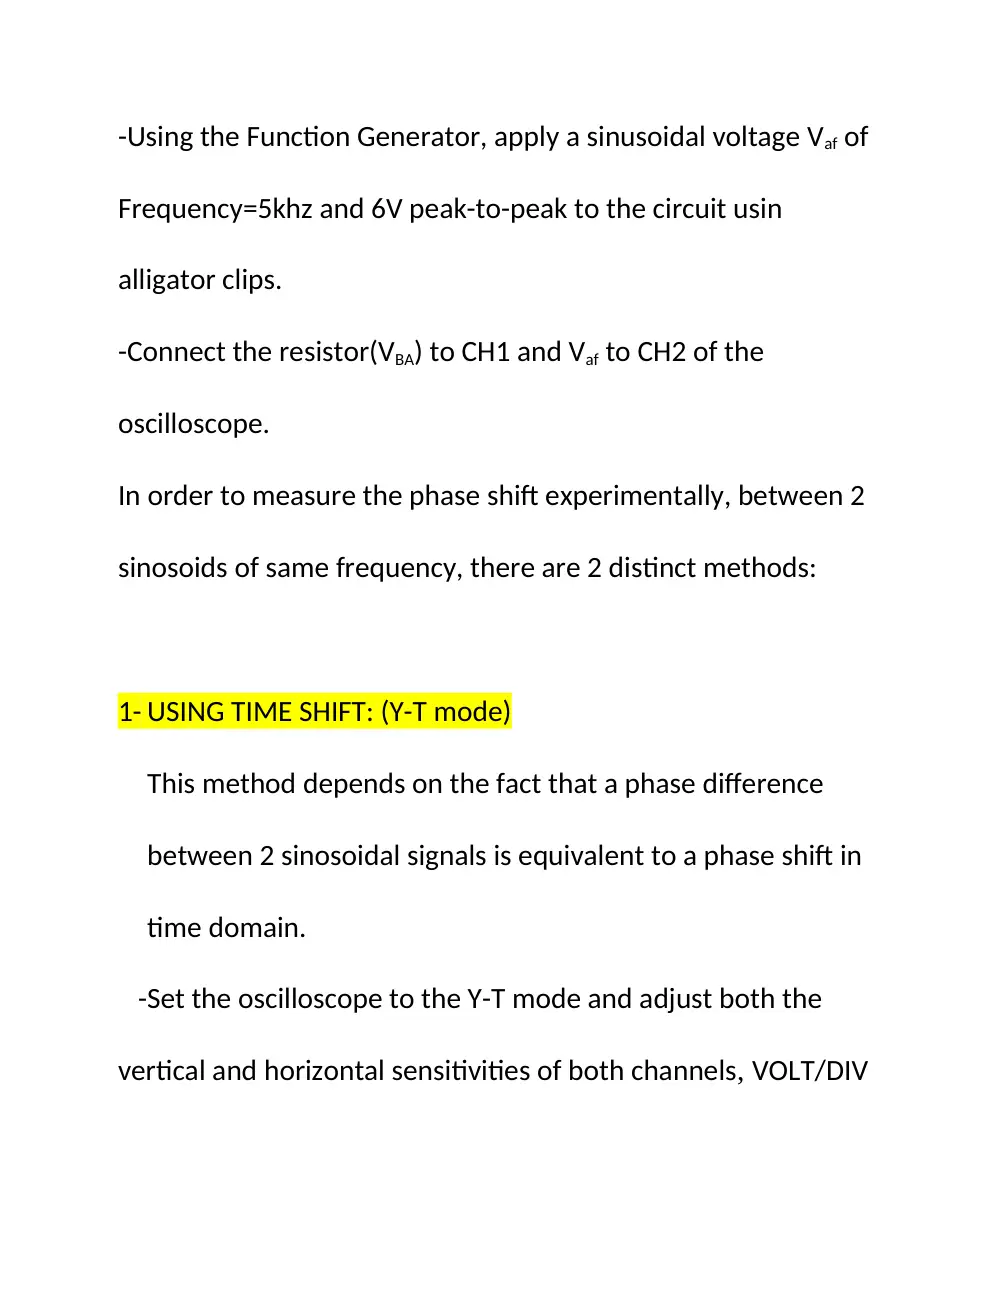
-Using the Function Generator, apply a sinusoidal voltage Vaf of
Frequency=5khz and 6V peak-to-peak to the circuit usin
alligator clips.
-Connect the resistor(VBA) to CH1 and Vaf to CH2 of the
oscilloscope.
In order to measure the phase shift experimentally, between 2
sinosoids of same frequency, there are 2 distinct methods:
1- USING TIME SHIFT: (Y-T mode)
This method depends on the fact that a phase difference
between 2 sinosoidal signals is equivalent to a phase shift in
time domain.
-Set the oscilloscope to the Y-T mode and adjust both the
vertical and horizontal sensitivities of both channels, VOLT/DIV
and SEC/DIV settings, to have them aligned and superposed on
same horizontal axis.
-Using the cursors measure the time difference ΔT between
Vaf and VBA , set cursor 1 to the point where the signal 1
crosses the x-axis (or to an arbitrary point) and cursor 2 to the
equivalent point on the second signal). ( choose the two closest
peaks or two closest points where they cut x-axis).
-Every one period in time domain is equivalent to 360o or 2π in
angle domain, then:
The phase angle φ= (ΔT/T)*360 in degrees, or φ= (ΔT/T)*2π in
radians. Where T is the period of any of the signals(same
frequency, same period) and ΔT is the time difference. Note
that we can obtain T if we already know the frequency by
simply using the formula: T= 1/F
2-USING LISSAJOUS FIGURE: (X-Y mode)
-Set the oscilloscope to the X-Y mode and keep connections as
in time shift method.
-Lissajous method consists of measuring 2 parameters A and B
from the ellipse shown on the.
-VBA and VDA will be connected to the X and Y channels of the
oscilloscope.
-An ellipse (called the Lissajous figure) will be observed on the
oscilloscope screen due to the superposition of two
perpendicular sinusoids.
-Center it using the vertical and horizontal POSITION knobs
symmetrically w.r.t the origin.
The centered ellipse will have the following shape:
In this method the phase angle φ= sin-1(B/A)
Assumptions:
In this experiment the resistor used has 1.35% of error. In
addition to the fact that wires have internal resistances. This
fact is not taken into consideration during the theoretical
calculations.
A3. Measurements and results:
Theoretical calculations:
We can measure the phase angle using the following formula:
Tan φ= Xc/R with Xc=1/(ωC) =1/ (2πfC)
Given f= 5 kHz, R= 20 kΩ and C= 1nF
Xc= 1/(2π*5*103*1*10-9)= 31847.134
Tan φ= 31847.134/20000=1.59
=> φ= tan-11.59= 57.8o
Experimental results:
o Method 1: Y-T format Δ
ΔT (s)
T (s)=1/F
Φ (degrees)
0.000032
0.0002
57.6
o Method 2: Lissajous figure
2B
2A
Φ (degrees)
5.2
6
60
Comparison and %error:
The theoretical value for this experiment is: 57.8o
The experimental value obtained using the first method is:
57.6o
The experimental value obtained using the second method is:
60o
We can clearly see that, using the first method (time shift
method) we obtained the closest value to the theoretical. But
both errors are acceptable; that in addition to the errors of 5%
range in the resistor and capacitor.
In method 1, the percentage of error is: [(57.8-57.6)/57.8] *100
= .34%
In method 2, the percentage of error is: [(57.8-60)/57.8] *100=
3.806%
A4. Discussions:
The shape of the ellipse depends on the frequency of the
input.
At low frequencies, the capacitor acts as an open circuit,
so VR=0 and so we observe either a vertical or horizontal
straight line.
At very high frequencies, the ellipse looks like an oblique
straight line which means that the capacitor acts as a
short circuit and so Vout= Vin. phase shift=0 , VR directly
proportional to current. This linearity is represented by a
straight line in Lissajous Figure.
For the ellipse to be a Full circle, implies that we have A=B
and so the phase angle = sin-1(1) = 90o. This occurs at very
low frequencies.
B.
Lead and lag networks
B1. Circuit diagram:
B2. Detailed experimental procedure:
Measurements settings:
-Design the circuits above on the breadboard with the specified
values of resistor and capacitor. The figure on the left is a lag
network where Vout is on the capacitor, and the right figure
represents a lead network where Vout is on the resistor.
-Start with the lag network. And then with Lead network.
-Connect Vin and Vout to the channels of oscilloscope.
-Apply a sinusoidal signal, using function generator, of 1 V peak-
to peak and of frequency initially 100Hz. We will vary it to
1000Hz(medium freq) and then to 10KHz(High freq) to observe
the changes.
-After finishing this experiment we will apply a square signal of
same amplitude and same varied frequencies.
o The magnitude of the transfer function of the lag network is:
(VR is Vout and VSRC is Vin )
This means that Vout (peak to peak)= Vin *( 1 / √1+ω2C2R2)
o
The magnitude of the transfer function of lead network is:
(VC is Vout and VSRC is Vin )
This means that Vout (peak to peak)= Vin *( ωCR / √1+ω2C2R2)
Assumptions:
In this experiment the resistor used has 2.33% of error. In
addition to the fact that wires have internal resistances. This
fact is not taken into consideration during the theoretical
calculations.
For LAG, having this transfer function, at high frequencies the
output signal will be attenuated whereas at high frequencies
the output signal is expected to be an exact replica of input.
For LEAD, having that transfer function, at low frequencies the
signal is attenuated while at high frequencies the output signal
is an exact replica of the input one.
B3. Measurements and results:
FOR LAG:
Sinusoidal wave:
Theoretical calculations:
Lag Network ( Calculated)
Frequency
Input Voltage
Output Voltage VPk-Pk
100 Hz
1 VPk-Pk
mVPk-Pk
1 KHz
1 VPk-Pk
mVPk-Pk
10 KHz
1 VPk-Pk
mVPk-Pk
Experimental results:
Lag Network ( Measured)
Frequency
Input Voltage
Output Voltage VPk-Pk
100 Hz
1 VPk-Pk
Vpp=
mV pk-pk
1 KHz
1 VPk-Pk
Vpp=
mV pk-pk
998
846.73
157.17
1060
880
10 KHz
1 VPk-Pk
Vpp=
mV pk-pk
The peak to peak values in the shots may be different to the
stated measured values because they were varying and that
could be due to noise in signal from the connection of wires..
For f = 100Hz, we obtained 2 overlapping graphs of Vout andVin
158
For f = 1 kHz. We can notice that Vout lags Vin.
For f = 10KHz.We can notice that Vout clearly lags Vin in this
case.
Square wave:
For the square wave input, we have the same calculated values
as the sinusoidal wave. This is because we have the same
transfer function independently of the signal nature.
Experimental Results:
Lag Network (Measured)
Frequency
Input Voltage
Output Voltage VPk-Pk
100 Hz
1 VPk-Pk
Vpp=
mVPk-Pk
1 KHz
1 VPk-Pk
Vpp=
mVPk-Pk
10 KHz
1 VPk-Pk
Vpp=
mVPk-Pk
For f = 100 Hz, 2 overlapping graphs of Vout andVin as shown in
the figure
1080
1060
276
For f=1KHz. We observe distortion.
For f=10KHz. Also more distortion closer to a sine wave.
For LEAD:
Sinosoidal Wave:
Theoretical:
Lead Network ( Calculated)
Frequency
Input Voltage
Output Voltage VPk-Pk
100 Hz
1 VPk-Pk
mVPk-Pk
1 KHz
1 VPk-Pk
mVPk-Pk
10 KHz
1 VPk-Pk
mVPk-Pk
Experimental:
Lead Network ( measured)
Frequency
Input Voltage
Output Voltage VPk-Pk
100 Hz
1 VPk-Pk
mVPk-Pk
1 KHz
1 VPk-Pk
mVPk-Pk
10 KHz
1 VPk-Pk
mVPk-Pk
Lead 10KHz sine wave
62.7
530
1000
66
560
1020
Lead 1KHz sine wave
Lead 100Hz sine wave
SQUARE WAVE:
Same theoretical as sinusoidal.
Experimental:
Lead Network ( Measured)
Frequenc
y
Input Voltage
Output Voltage VPk-
Pk
100 Hz
1 VPk-Pk
Vpp=
V
1 KHz
1 VPk-Pk
Vpp=
V
10 KHz
1 VPk-Pk
Vpp=
V
Lead square 10KHz. 2 overlapping graphs of Vout andVin
Lead square 1KHz. Distortion.
1.78
1.96
1.32
Lead square 100Hz.low. the output appeared as steps and
impulses…
Comparison and error:
Network
Lag
Lead
Frequency(
Hz)
100
1000
10000
100
1000
10000
Error %
(sinosoids)
6.21
3.92
0.528
5.26
5.66
2
Error %
(Square)
8.21
25.18
75.6
2738
269
32
B4. Discussions:
LAG NETWORK:
o
At low Frequencies(100Hz), Vin=Vout.. The 2 graphs are
overlapping. ( in phase)
It is known that at low frequencies, the capacitor has enough
time to charge up to a voltage = Vsource=Vin.
o
As we increase the frequency (period decreases), the
capacitor does not have sufficient time to charge and
discharge completely(capacitor doesn’t change its voltage
instantaneously), and so it takes the shape seen in the figures
of 1khz nad 10khz.
-More attenuation
-More phase shift
-Amplitude decreases.
IN square waves input, at high frequencies we will have
distortion and not only attenuation.
The sharp edges are built from highest frequencies.Those
highest frequencies won’t pass due to the fact that the lag
network is a low-pass filter distortion.
o
So to avoid attenuation of sinusoids, The frequency should
be very low(f<<fc=1/RC) since a low pass filter(Lag network)
attenuates the signal after its cut off frequency
o
Considering the fact that a square wave signal is a sum of
sine waves at different frequencies, according to Fourier
series expansion, whatever happens for sinosoids also
applies to square waves
o
For lowest distortion, the fundamental frequency must be
much less than the cut of frequency.(in both square and sign)
o
The lag network acts as an integrator at very high
frequencies since H(s)=1/(1+sRC) approximately 1/sRC and
that Laplace transform to time domain is equivalent to
integration. Vc is the 1/C integral of I.
,
This explains the shape of the graph of f=10Khz.
Integral of square= triangular
2. LEAD NETWORK:
For Square, The peak to peak value of output is greater than
that of input due to the charging and discharging of the
capacitor.
since Vout=Vc+Vin . Vc charges till max
Vout=Vin+Vin=2Vin so peak of output could reach the value
where its double that of input.
o
VR=RI=CdVc/dt
At ω<<1/RC(very low frequencies Capacitor has time to
charge completely)
Capacitor open circuit.
Vc=Vin
VR= CdVc/dt=RC dVin/dt DIFFERENTIATOR.
Or one can say, In lead network, H(s)=sRC/1+sRC = sRC and
multiplying by s In Laplace is an equivalent differentiation in
time domain.
o
So to avoid distortion of the square wave, the frequency
should be very high(f>>fc=1/RC) so that more harmonics
of the fourier series will be kept and thus the signal will be
preserved. The Lead network is as a High pass filter that
prevents the passage of low frequencies, frequencies less
than the cut off freq.
•f<<1/RC lead-network acts as a differentiator
•f>> 1/RC lag network acts as an integrator
C.Series RLC Circuit
C1. Circuit Diagram:
C2. Detailed experimental procedure:
Measurements settings:
Setup the circuit shown above and connect VR and Vin to both
channel of the oscilloscope. Sweep the frequency and measure
the frequency with highest peak; this frequency is the resonant
frequency, were the circuit is purely resistive. Also, measure
the time shift between both signals. We provide a signal of 1 V
peak to peak.
Assumptions:
Wires have internal resistances. This fact is not taken into
consideration during the theoretical computations.
C3. Measurements and results:
Theoretical calculations:
The Resonant frequency of an RLC circuit is:
ωo= 1/ (2π√LC) (in Hz) or
0 = (in radians/ sec)
The bandwidth of an RLC circuit is:
BW= R/(2πL) (in Hz) or
BW=R/L (in radians/ sec)
Resistanc
e
Inducto
r
Capacito
r
Resonant
Frequency
Bandwidt
h
100 Ω
220 µH 1 µf
KHz
KHz
10.73
72.379
56 Ω
220 µH 1 µf
KHz
KHz
100 Ω
470 µH 0.1 µf
KHz
KHz
Experimental results:
SET 1:
SET 2:
10.73
40.532
7.341
33.879
SET 3:
C4. Discussions:
1. For an RLC circuit, where the output is taken across R, the
transfer function is:
2. for set 1:
Frequen
cy (Hz)
|
Vout/
Vin|
Theoreti
cal
1000
0.4375
0.5353
1400
0.6
0.6668
2000
0.695
0.793
2800
0.759
0.883
4000
0.815
0.946
5400
0.968
0.976
7500
0.936
0.994
10000
0.89
0.999
14000
0.907
0.9968
20000
0.9027
0.98
28000
0.8356
0.9496
40000
0.81
0.8898
54000
0.779
0.8127
75000
0.69
0.7016
100000
0.574
0.59
For set 2:
Frequen
cy (Hz)
|
Vout/
Vin|
Theoreti
cal
1000
0.448
0.539
1400
0.5778
0.674
2000
0.67
0.805
2800
0.7125
0.8995
4000
0.786
0.963
5400
0.813
0.99
7500
0.849
0.999
10000
0.808
0.99
14000
0.8
0.9579
20000
0.757
0.89
28000
0.71
0.792
40000
0.641
0.659
54000
0.536
0.538
75000
0.4299
0.4148
100000
0.345
0.322
For set 3:
Frequen
cy (Hz)
|
Vout/
Vin|
Theoreti
cal
1000
0.3
0.3345
1400
0.34
0.448
2000
0.45
0.589
2800
0.6
0.726
4000
0.69
0.853
5400
0.72
0.93
7500
0.79
0.9817
10000
0.8
0.999
14000
0.8
0.9899
20000
0.778
0.943
28000
0.72
0.8614
40000
0.672
0.737
54000
0.57
0.615
75000
0.468
0.428
100000
0.376
0.379
3. SET1:
1000
10000
100000
0
0.2
0.4
0.6
0.8
1
1.2
measured
theoretical
SET2:
1000
10000
100000
-1.11022302462516E-16
0.2
0.4
0.6
0.8
1
1.2
measured
theoretical
SET 3:
1000
10000
100000
0
0.2
0.4
0.6
0.8
1
1.2
measured
theoretical
4.For each of graph we draw the line when the magnitude of
transfer function is =1/. This line intersects the curves in two
points f1 and f2 in which f2-f1 is the bandwidth. The resonant
frequency is the frequency when the curves peak.
- For set 1: BW=67.5Khz and F=1000Hz
- For set 2: BW=25.2Khz and F=7500Hz
- For set 3: BW=35Khz and F=1000Hz
5.Theoretical values:
Resistanc Inducto Capacito Resonant
Bandwidt
e
r
r
Frequency
h
100 Ω
220 µH 1 µf
KHz
KHz
56 Ω
220 µH 1 µf
KHz
KHz
100 Ω
470 µH 0.1 µf
KHz
KHz
There is a very notable difference between the two and
this is due to the resistances present in the
wires,components and misreading of the values from the
graphs.
6. Since BW=R/2πL, the bandwidth and R are proportional.
When R increases, BW increases, when R decreases BW
decreases and vice versa. This is validated in the table where
the 100ohm resistor gives a bandwidth greater that that of
R=56ohms
10.73
72.379
10.73
40.532
7.341
33.879
7.Similarly, BW is inversely proportional to L, so as L increases
or decreases BW decreases or increases respectively.(check
sets 1 and 2)
The bandwidth is independent of C. Thus the bandwidth isn’t
affected by the change of C.
8. as seen in the table of question 5:
Set 1 and set 3 have same resonant frequency (10.73) because
they have same C and L.
Set 2 has the lowest resonant frequency since the ratio of
1/radical LC is less thaan that of sets 1 and 3.
Comparing sets 1 and 3,that have same R, The bandwidth of set
1 is the largest since it has lowest L whereas the bandwidth of
set 2 is the narrowest (has biggest value of L).
REFERENES:
http://en.wikipedia.org/wiki/RC_circuit#Integrator
Mistakes faced in Labs:
No major conflicts were faced in the lab, other than some
values in our measurements that weren’t stable due to
connection errors.
------------------------------------------------------------------------------------------------------------------------------
“I HAVE NEITHER GIVEN NOR RECEIVED AID ON THIS REPORT NOR HAVE
I CONCEALED ANY VIOLATION OF THE AUB STUDENT CODE OF
CONDUCT.”
Yathreb El_Yaman
Yathreb El Yaman