
EECE 471 Final, Fall 2007
American University of Beirut · Fundamentals of Power Systems Analysis · 4 pages

More EECE 471 files
- Final · Summer 2010Final examView
- Final Solution · Summer 2010Final exam · with solutionView
- Final · Fall 2008Final examView
- Final Solution · Fall 2008Final exam · with solutionView
- Final Solution · Fall 2007Final exam · with solutionView
- Final · Fall 2005Final examView
- Final Solution · Fall 2005Final exam · with solutionView
- Final Solution · Fall 2003Final exam · with solutionView
Show the text of this final exam
S. KARAKI
AMERICAN UNIVERSITY OF BEIRUT
FALL 2007/ 2008
FACULTY OF ENGINEERING AND ARCHITECTURE
FINAL EXAM
FUNDAMENTALS OF POWER SYSTEMS ANALYSIS (EECE 471E)
CLOSED BOOK (2.5 HOURS)
January 26, 2008
PROGRAMMABLE CALCULATORS ARE NOT ALLOWED.
THIS QUESTION SHEET MUST BE RETURNED WITH THE ANSWER BOOKLET.
BRIEFLY EXPLAIN CALCULATIONS BY SHOWING FORMULAE USED.
NAME: _________________________
ID#: _________________________
1.
The transmission system shown in Fig. 1 is to be designed to provide the load with
an adequate level of supply at 50 Hz. The transmission system consists of one OHL
tower having two circuits. The practice in the utility has been to allow for a
maximum current density of 2.5 A/mm2 for thermal rating of a line, and the tower
dimensions are such that we have a typical conductor spacing of 0.04 m/kV. The
utility uses several standard voltages, namely 400, 220, and 150 kV, which have
surge impedances of 250, 275 and 300Ω, respectively. Transformers have usually
leakage reactance of 12% on rating. Furthermore, the following data is known
about the system:
Generator G1: 250 MVA, PF= 0.85, 13 kV, XS= 120%.
Generator G2: 120 MVA, PF= 0.85, 11 kV, XS= 110%.
Transmission line: 450 km.
Load: 300+j120 MVA
∆-Y
Transmission
Line
G
Y-∆
1
T1
T2
2
3
4
G
G1
G2
Fig. 1: Transmission system under analysis.
a)Determine the most appropriate voltage that should be used for transmission and
the surge impedance loading of the line. For stability reasons the angle
deviation from node 1 to node 4 should be less than about 45°.
b)From Table 1 given below select the most appropriate conductor size at the
selected voltage. The current density is not to exceed 2.5 A/mm2 at the
EECE 471E
FINAL EXAM - FALL 2007/ 2008
2/ 10
prevailing ambient conditions and the line losses for the selected conductor are
not to exceed 7%. Consider using bundled conductors in your design with up to
4 conductors per bundle. Use a bundle distance of 1ft. Note that 1 kcmil=
0.507mm2 and 1 ft= 0.305 m.
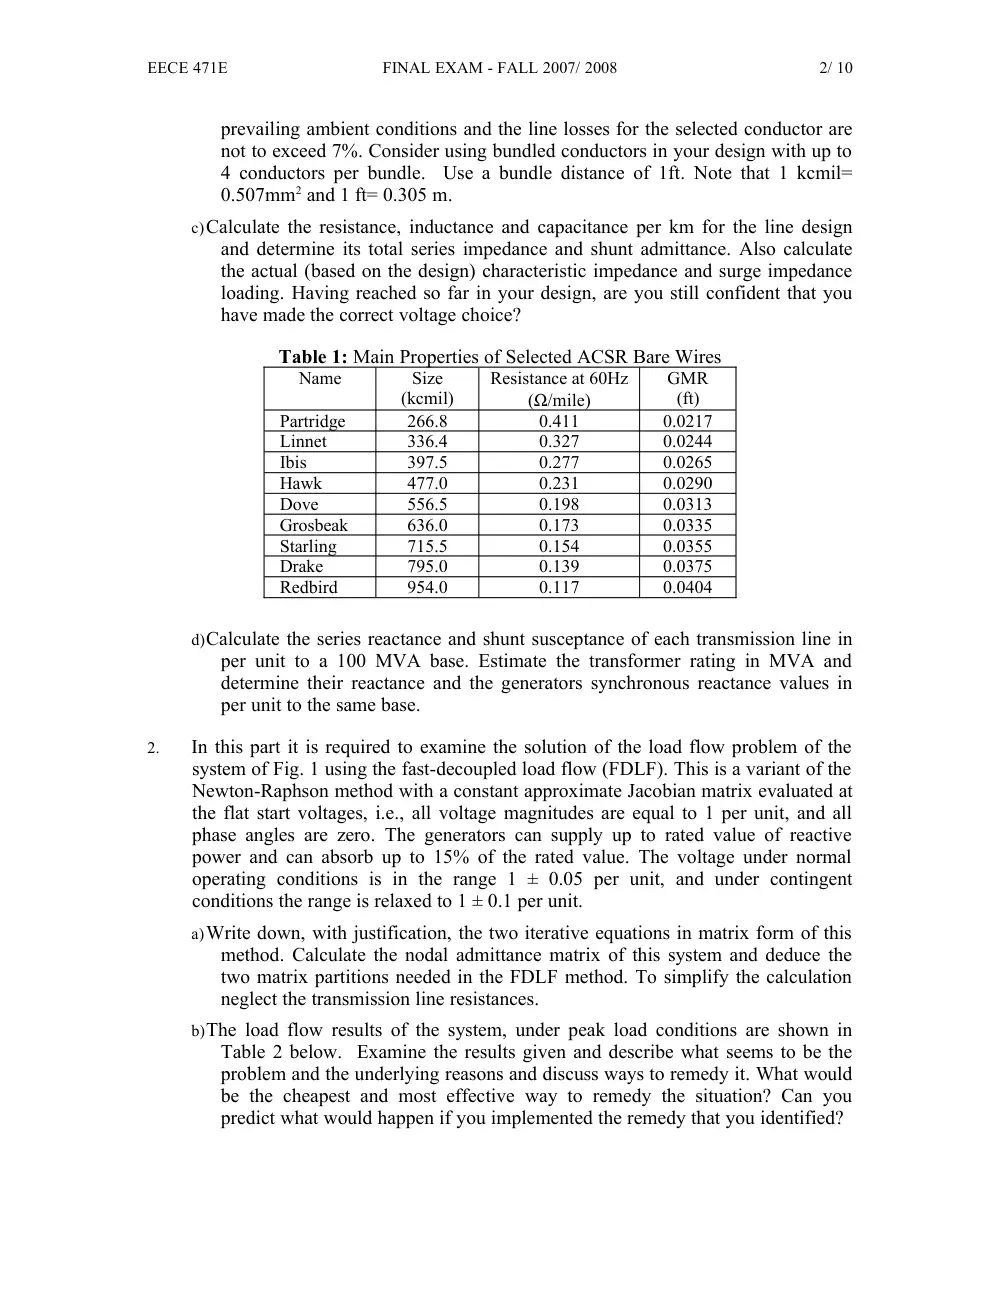
c)Calculate the resistance, inductance and capacitance per km for the line design
and determine its total series impedance and shunt admittance. Also calculate
the actual (based on the design) characteristic impedance and surge impedance
loading. Having reached so far in your design, are you still confident that you
have made the correct voltage choice?
Table 1: Main Properties of Selected ACSR Bare Wires
Name
Size
(kcmil)
Resistance at 60Hz
(Ω/mile)
GMR
(ft)
Partridge
266.8
0.411
0.0217
Linnet
336.4
0.327
0.0244
Ibis
397.5
0.277
0.0265
Hawk
477.0
0.231
0.0290
Dove
556.5
0.198
0.0313
Grosbeak
636.0
0.173
0.0335
Starling
715.5
0.154
0.0355
Drake
795.0
0.139
0.0375
Redbird
954.0
0.117
0.0404
d)Calculate the series reactance and shunt susceptance of each transmission line in
per unit to a 100 MVA base. Estimate the transformer rating in MVA and
determine their reactance and the generators synchronous reactance values in
per unit to the same base.
2.
In this part it is required to examine the solution of the load flow problem of the
system of Fig. 1 using the fast-decoupled load flow (FDLF). This is a variant of the
Newton-Raphson method with a constant approximate Jacobian matrix evaluated at
the flat start voltages, i.e., all voltage magnitudes are equal to 1 per unit, and all
phase angles are zero. The generators can supply up to rated value of reactive
power and can absorb up to 15% of the rated value. The voltage under normal
operating conditions is in the range 1 ± 0.05 per unit, and under contingent
conditions the range is relaxed to 1 ± 0.1 per unit.
a)Write down, with justification, the two iterative equations in matrix form of this
method. Calculate the nodal admittance matrix of this system and deduce the
two matrix partitions needed in the FDLF method. To simplify the calculation
neglect the transmission line resistances.
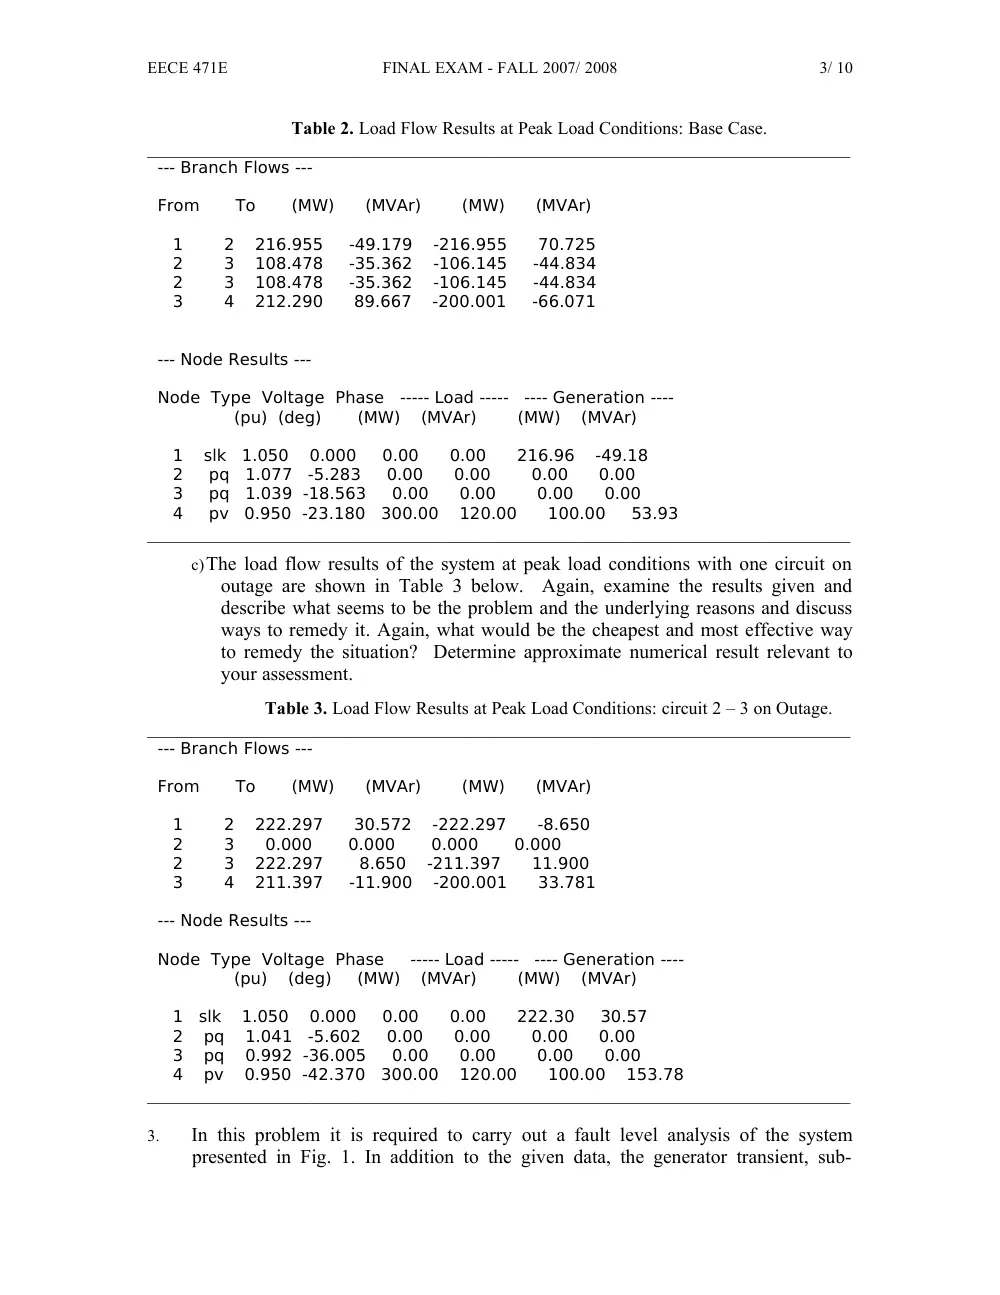
b)The load flow results of the system, under peak load conditions are shown in
Table 2 below. Examine the results given and describe what seems to be the
problem and the underlying reasons and discuss ways to remedy it. What would
be the cheapest and most effective way to remedy the situation? Can you
predict what would happen if you implemented the remedy that you identified?
EECE 471E
FINAL EXAM - FALL 2007/ 2008
3/ 10
Table 2. Load Flow Results at Peak Load Conditions: Base Case.
______________________________________________________________________________
--- Branch Flows ---
From To (MW) (MVAr) (MW) (MVAr)
1 2 216.955 -49.179 -216.955 70.725
2 3 108.478 -35.362 -106.145 -44.834
2 3 108.478 -35.362 -106.145 -44.834
3 4 212.290 89.667 -200.001 -66.071
--- Node Results ---
Node Type Voltage Phase ----- Load ----- ---- Generation ----
(pu) (deg) (MW) (MVAr) (MW) (MVAr)
1 slk 1.050 0.000 0.00 0.00 216.96 -49.18
2 pq 1.077 -5.283 0.00 0.00 0.00 0.00
3 pq 1.039 -18.563 0.00 0.00 0.00 0.00
4 pv 0.950 -23.180 300.00 120.00 100.00 53.93
______________________________________________________________________________
c)The load flow results of the system at peak load conditions with one circuit on
outage are shown in Table 3 below. Again, examine the results given and
describe what seems to be the problem and the underlying reasons and discuss
ways to remedy it. Again, what would be the cheapest and most effective way
to remedy the situation? Determine approximate numerical result relevant to
your assessment.
Table 3. Load Flow Results at Peak Load Conditions: circuit 2 – 3 on Outage.
______________________________________________________________________________
--- Branch Flows ---
From To (MW) (MVAr) (MW) (MVAr)
1 2 222.297 30.572 -222.297 -8.650
2 3 0.000 0.000 0.000 0.000
2 3 222.297 8.650 -211.397 11.900
3 4 211.397 -11.900 -200.001 33.781
--- Node Results ---
Node Type Voltage Phase ----- Load ----- ---- Generation ----
(pu) (deg) (MW) (MVAr) (MW) (MVAr)
1 slk 1.050 0.000 0.00 0.00 222.30 30.57
2 pq 1.041 -5.602 0.00 0.00 0.00 0.00
3 pq 0.992 -36.005 0.00 0.00 0.00 0.00
4 pv 0.950 -42.370 300.00 120.00 100.00 153.78
______________________________________________________________________________
3.
In this problem it is required to carry out a fault level analysis of the system
presented in Fig. 1. In addition to the given data, the generator transient, sub-
EECE 471E
FINAL EXAM - FALL 2007/ 2008
4/ 10
transient and leakage reactances are given as 30%, 20% and 6% on rating. The
generators are Y-connected with the neutral solidly grounded and the Y-sides of the
transformers are also solidly grounded. The zero sequence impedance of a
transmission line is approximately equal to 3 times its positive sequence one.
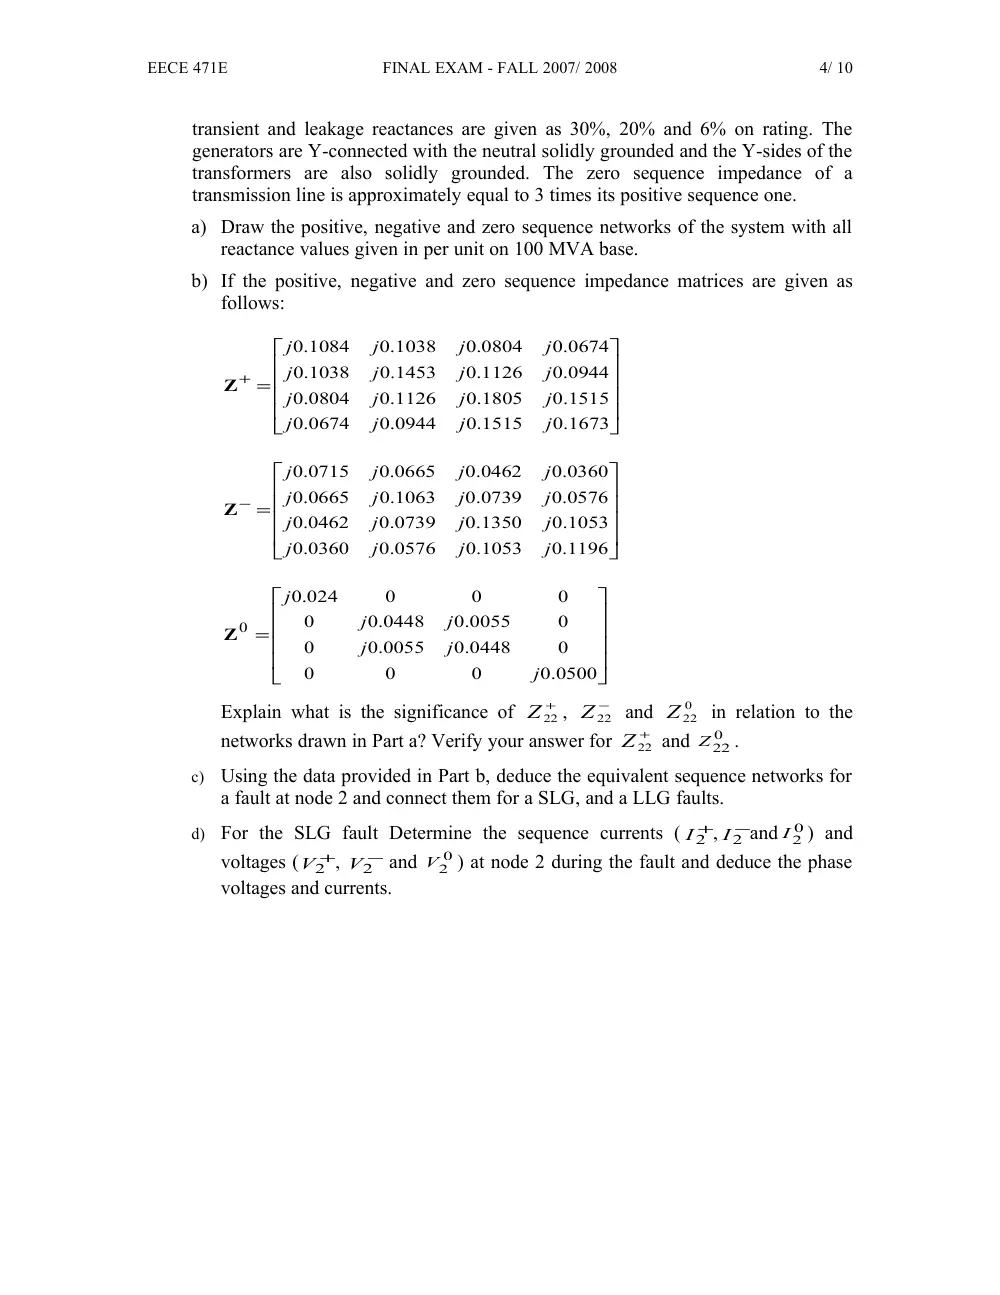
a) Draw the positive, negative and zero sequence networks of the system with all
reactance values given in per unit on 100 MVA base.
b) If the positive, negative and zero sequence impedance matrices are given as
follows:
=
+
0.1673
0.1515
0.0944
.0674
0
0.1515
0.1805
0.1126
.0804
0
0.0944
0.1126
0.1453
.1038
0
0.0674
0.0804
0.1038
.1084
0
j
j
j
j
j
j
j
j
j
j
j
j
j
j
j
j
Z
=
−
0.1196
0.1053
0.0576
.0360
0
0.1053
0.1350
0.0739
.0462
0
0.0576
0.0739
0.1063
.0665
0
0.0360
0.0462
0.0665
.0715
0
j
j
j
j
j
j
j
j
j
j
j
j
j
j
j
j
Z
=
0.0500
0
0
0
0
0.0448
0.0055
0
0
0.0055
0.0448
0
0
0
0
.024
0
0
j
j
j
j
j
j
Z
Explain what is the significance of
+
Z22
,
−
Z22
and
0
Z22
in relation to the
networks drawn in Part a? Verify your answer for
+
Z22
and
0
Z22
.
c)
Using the data provided in Part b, deduce the equivalent sequence networks for
a fault at node 2 and connect them for a SLG, and a LLG faults.
d)
For the SLG fault Determine the sequence currents (
+
I2
,
−
I2
and
0
I2
) and
voltages (
+
V2
,
−
V2
and
0
V2
) at node 2 during the fault and deduce the phase
voltages and currents.