
EECE 471 Midterm, Fall 2006
American University of Beirut · Fundamentals of Power Systems Analysis · 5 pages
More EECE 471 files
Show the text of this exam
S. KARAKI
AMERICAN UNIVERSITY OF BEIRUT
FALL 2006/2007
FACULTY OF ENGINEERING AND ARCHITECTURE
MIDTERM EXAM
FUNDAMENTALS OF POWER SYSTEMS ANALYSIS
(EECE 471)
CLOSED BOOK (1.5 HOURS)
NOVEMBER 28, 2006
NAME: _________________________
ID#: _________________________
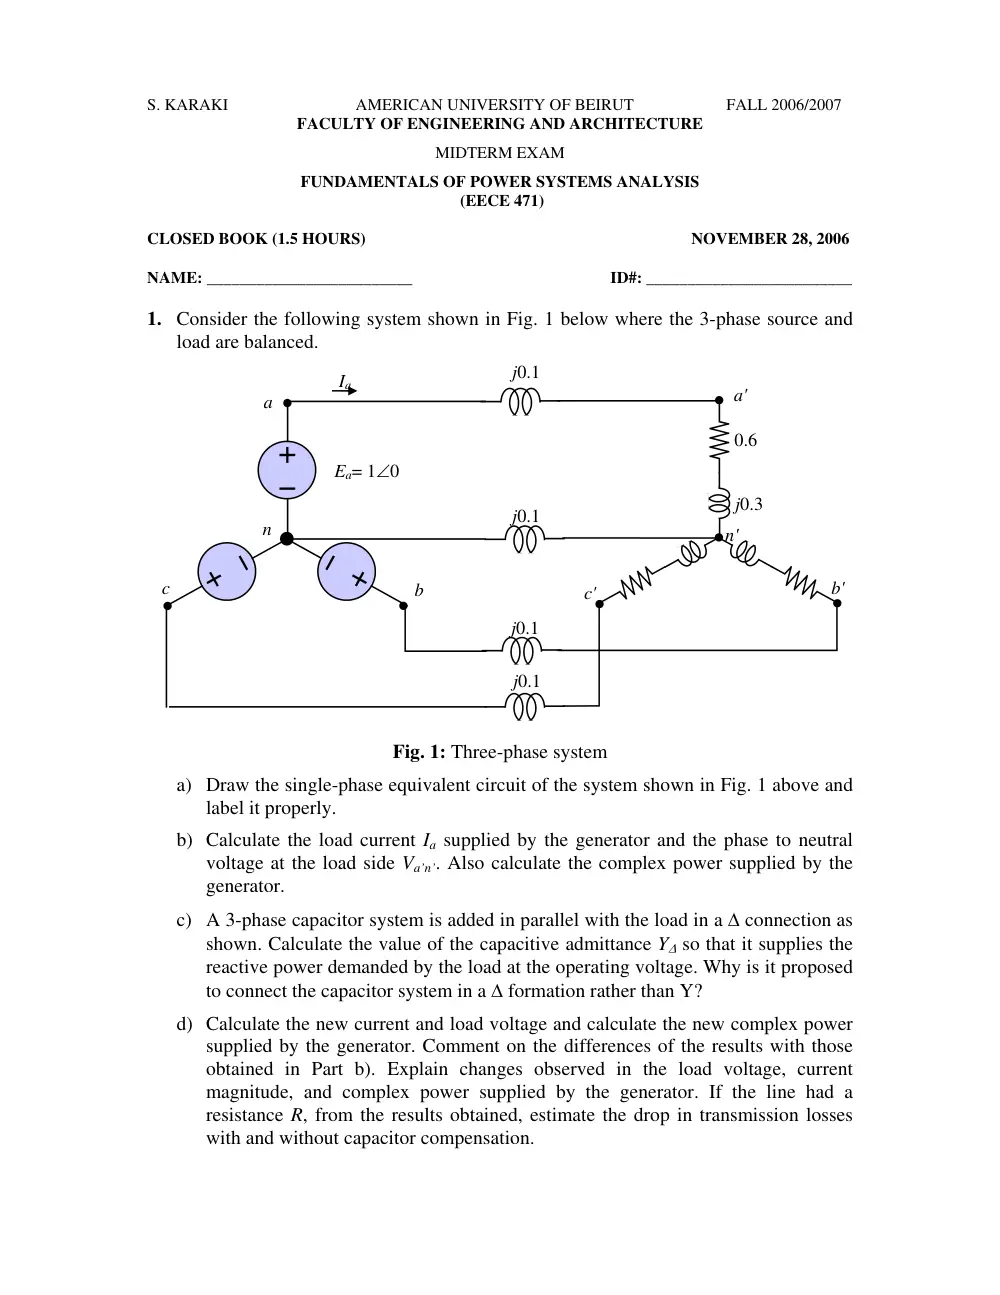
1. Consider the following system shown in Fig. 1 below where the 3-phase source and
load are balanced.
j0.1
j0.1
j0.1
j0.1
a
b
c
Ia
n
a'
c'
j0.3
0.6
n'
Ea= 1∠0
b'
Fig. 1: Three-phase system
a) Draw the single-phase equivalent circuit of the system shown in Fig. 1 above and
label it properly.
b) Calculate the load current Ia supplied by the generator and the phase to neutral
voltage at the load side Va’n’. Also calculate the complex power supplied by the
generator.
c) A 3-phase capacitor system is added in parallel with the load in a ∆ connection as
shown. Calculate the value of the capacitive admittance Y∆ so that it supplies the
reactive power demanded by the load at the operating voltage. Why is it proposed
to connect the capacitor system in a ∆ formation rather than Y?
d) Calculate the new current and load voltage and calculate the new complex power
supplied by the generator. Comment on the differences of the results with those
obtained in Part b). Explain changes observed in the load voltage, current
magnitude, and complex power supplied by the generator. If the line had a
resistance R, from the results obtained, estimate the drop in transmission losses
with and without capacitor compensation.
EECE 471E
MIDTERM - FALL 2006/ 07
Page 2/ 5
2. It is required to design a transmission line of 300 mile length to supply a demand of
250 MW at 0.9 PF lagging considering one of three voltages 132, 275 and 400 kV at
a frequency of 50Hz with typical phase-to-phase spacing of 6, 10 m and 12 m,
respectively. Note that 1 kcmil= 0.507mm2 and 1 ft= 0.305 m.
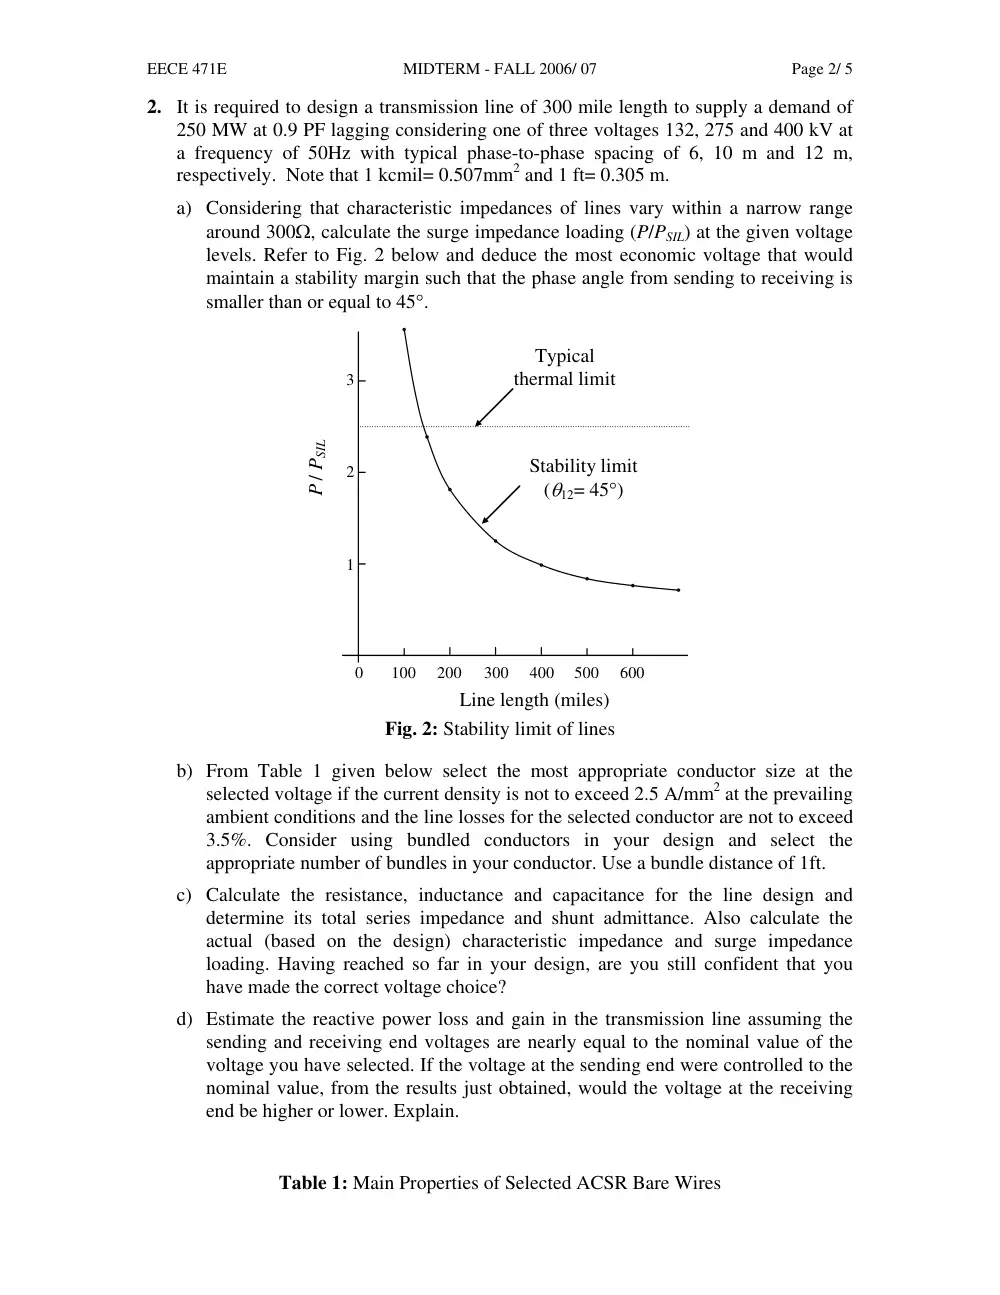
a) Considering that characteristic impedances of lines vary within a narrow range
around 300Ω, calculate the surge impedance loading (P/PSIL) at the given voltage
levels. Refer to Fig. 2 below and deduce the most economic voltage that would
maintain a stability margin such that the phase angle from sending to receiving is
smaller than or equal to 45°.
100
200
300
400
500
600
0
1
2
3
P / PSIL
Line length (miles)
Typical
thermal limit
Stability limit
(θ12= 45°)
Fig. 2: Stability limit of lines
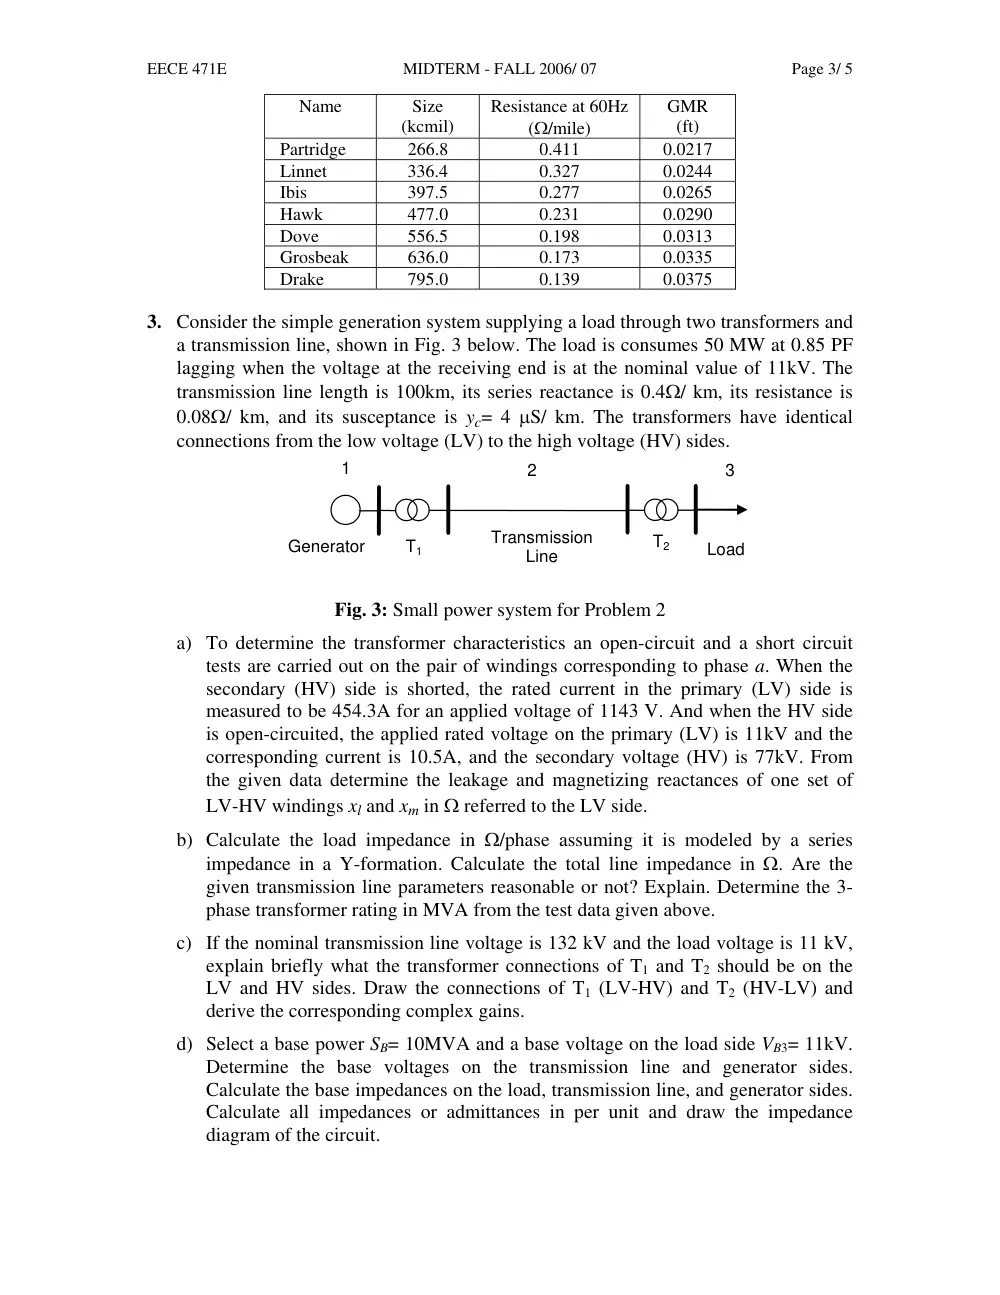
b) From Table 1 given below select the most appropriate conductor size at the
selected voltage if the current density is not to exceed 2.5 A/mm2 at the prevailing
ambient conditions and the line losses for the selected conductor are not to exceed
3.5%. Consider using bundled conductors in your design and select the
appropriate number of bundles in your conductor. Use a bundle distance of 1ft.
c) Calculate the resistance, inductance and capacitance for the line design and
determine its total series impedance and shunt admittance. Also calculate the
actual (based on the design) characteristic impedance and surge impedance
loading. Having reached so far in your design, are you still confident that you
have made the correct voltage choice?
d) Estimate the reactive power loss and gain in the transmission line assuming the
sending and receiving end voltages are nearly equal to the nominal value of the
voltage you have selected. If the voltage at the sending end were controlled to the
nominal value, from the results just obtained, would the voltage at the receiving
end be higher or lower. Explain.
Table 1: Main Properties of Selected ACSR Bare Wires
EECE 471E
MIDTERM - FALL 2006/ 07
Page 3/ 5
Name
Size
(kcmil)
Resistance at 60Hz
(Ω/mile)
GMR
(ft)
Partridge
266.8
0.411
0.0217
Linnet
336.4
0.327
0.0244
Ibis
397.5
0.277
0.0265
Hawk
477.0
0.231
0.0290
Dove
556.5
0.198
0.0313
Grosbeak
636.0
0.173
0.0335
Drake
795.0
0.139
0.0375
3. Consider the simple generation system supplying a load through two transformers and
a transmission line, shown in Fig. 3 below. The load is consumes 50 MW at 0.85 PF
lagging when the voltage at the receiving end is at the nominal value of 11kV. The
transmission line length is 100km, its series reactance is 0.4Ω/ km, its resistance is
0.08Ω/ km, and its susceptance is yc= 4 µS/ km. The transformers have identical
connections from the low voltage (LV) to the high voltage (HV) sides.
Generator
Load
Transmission
Line
1
2
3
T1
T2
Fig. 3: Small power system for Problem 2
a) To determine the transformer characteristics an open-circuit and a short circuit
tests are carried out on the pair of windings corresponding to phase a. When the
secondary (HV) side is shorted, the rated current in the primary (LV) side is
measured to be 454.3A for an applied voltage of 1143 V. And when the HV side
is open-circuited, the applied rated voltage on the primary (LV) is 11kV and the
corresponding current is 10.5A, and the secondary voltage (HV) is 77kV. From
the given data determine the leakage and magnetizing reactances of one set of
LV-HV windings xl and xm in Ω referred to the LV side.
b) Calculate the load impedance in Ω/phase assuming it is modeled by a series
impedance in a Y-formation. Calculate the total line impedance in Ω. Are the
given transmission line parameters reasonable or not? Explain. Determine the 3-
phase transformer rating in MVA from the test data given above.
c) If the nominal transmission line voltage is 132 kV and the load voltage is 11 kV,
explain briefly what the transformer connections of T1 and T2 should be on the
LV and HV sides. Draw the connections of T1 (LV-HV) and T2 (HV-LV) and
derive the corresponding complex gains.
d) Select a base power SB= 10MVA and a base voltage on the load side VB3= 11kV.
Determine the base voltages on the transmission line and generator sides.
Calculate the base impedances on the load, transmission line, and generator sides.
Calculate all impedances or admittances in per unit and draw the impedance
diagram of the circuit.
EECE 471E
MIDTERM - FALL 2006/ 07
Page 4/ 5
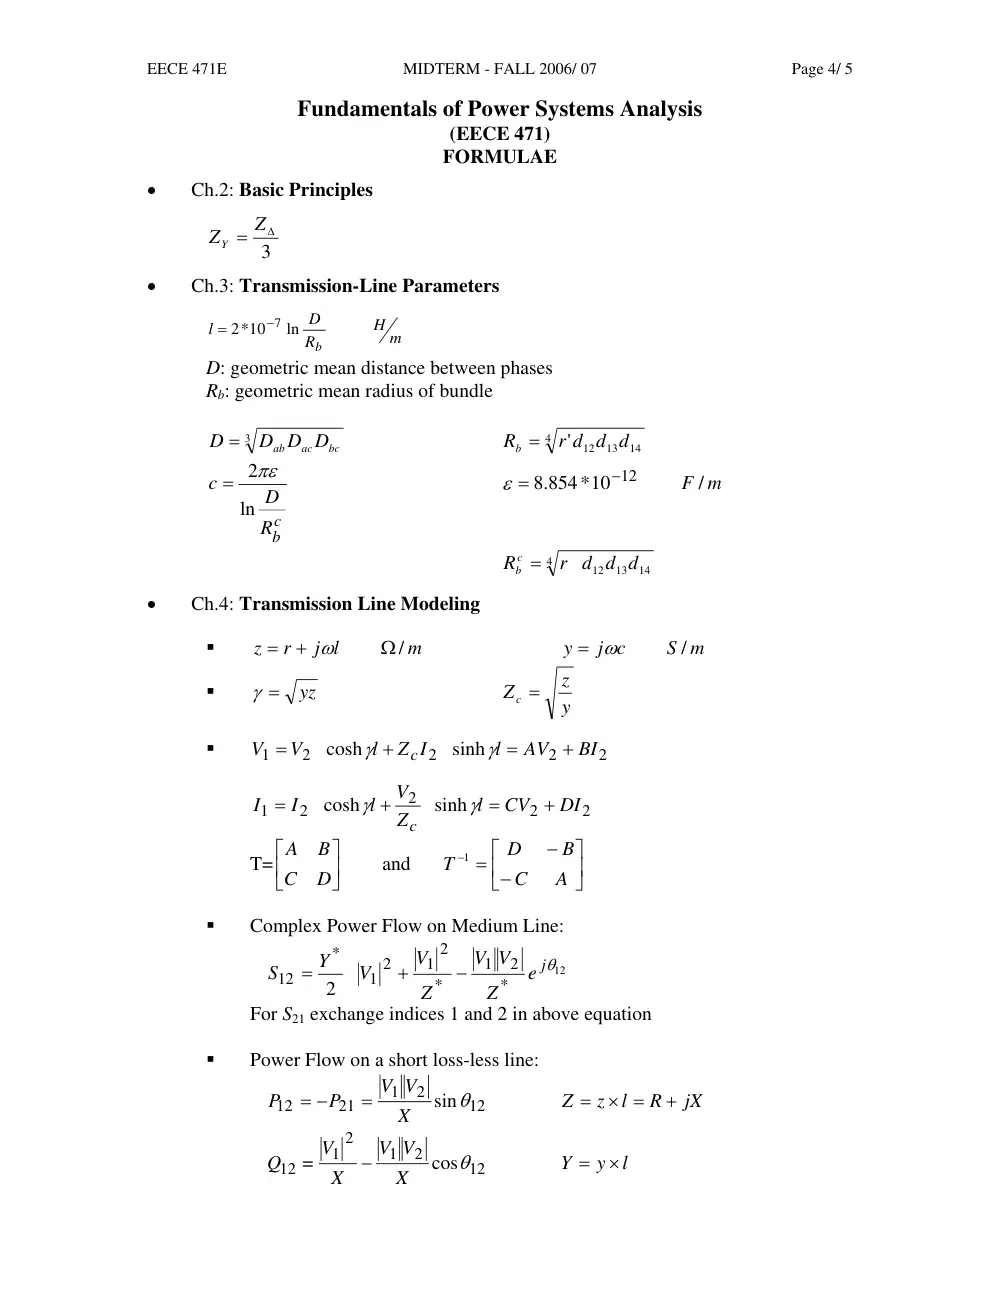
Fundamentals of Power Systems Analysis
(EECE 471)
FORMULAE
•
Ch.2: Basic Principles
3
ZY = Z∆
•
Ch.3: Transmission-Line Parameters
H m
R
D
l
b
ln
2*10
−7
=
D: geometric mean distance between phases
Rb: geometric mean radius of bundle
3
bc
ac
ab
D D D
D =
4
14
' 12 13
r d d d
Rb =
c
b
R
D
c
ln
= 2πε
F / m
.8 854*10
−12
ε =
4
14
12 13
r d d d
R c
b =
•
Ch.4: Transmission Line Modeling
�
m
j l
r
z
Ω /
+
=
ω
S m
j c
y
/
= ω
�
yz
γ =
y
z
Z c =
�
2
2
2
2
1
sinh
cosh
BI
AV
l
Z I
l
V
V
c
+
=
+
=
γ
γ
2
2
2
2
1
sinh
cosh
DI
CV
l
Z
V
l
I
I
c
+
=
+
=
γ
γ
T=
⎥⎦
⎤
⎢⎣
⎡
D
C
B
A
and
⎥⎦
⎤
⎢⎣
⎡
−
−
− =
A
C
B
D
T
1
�
Complex Power Flow on Medium Line:
12
*
2
1
*
2
1
2
1
*
12
2
jθ
e
Z
V
V
Z
V
V
Y
S
−
+
=
For S21 exchange indices 1 and 2 in above equation
�
Power Flow on a short loss-less line:
12
2
1
21
12
sinθ
X
V V
P
P
=
= −
jX
R
l
z
Z
+
× =
=
12
2
1
2
1
12
cos
=
θ
X
V
V
X
V
Q
−
l
y
Y
×
=
EECE 471E
MIDTERM - FALL 2006/ 07
Page 5/ 5
12
2
1
2
2
21
cos
=
Q
θ
X
V
V
X
V
−
l: length of line
�
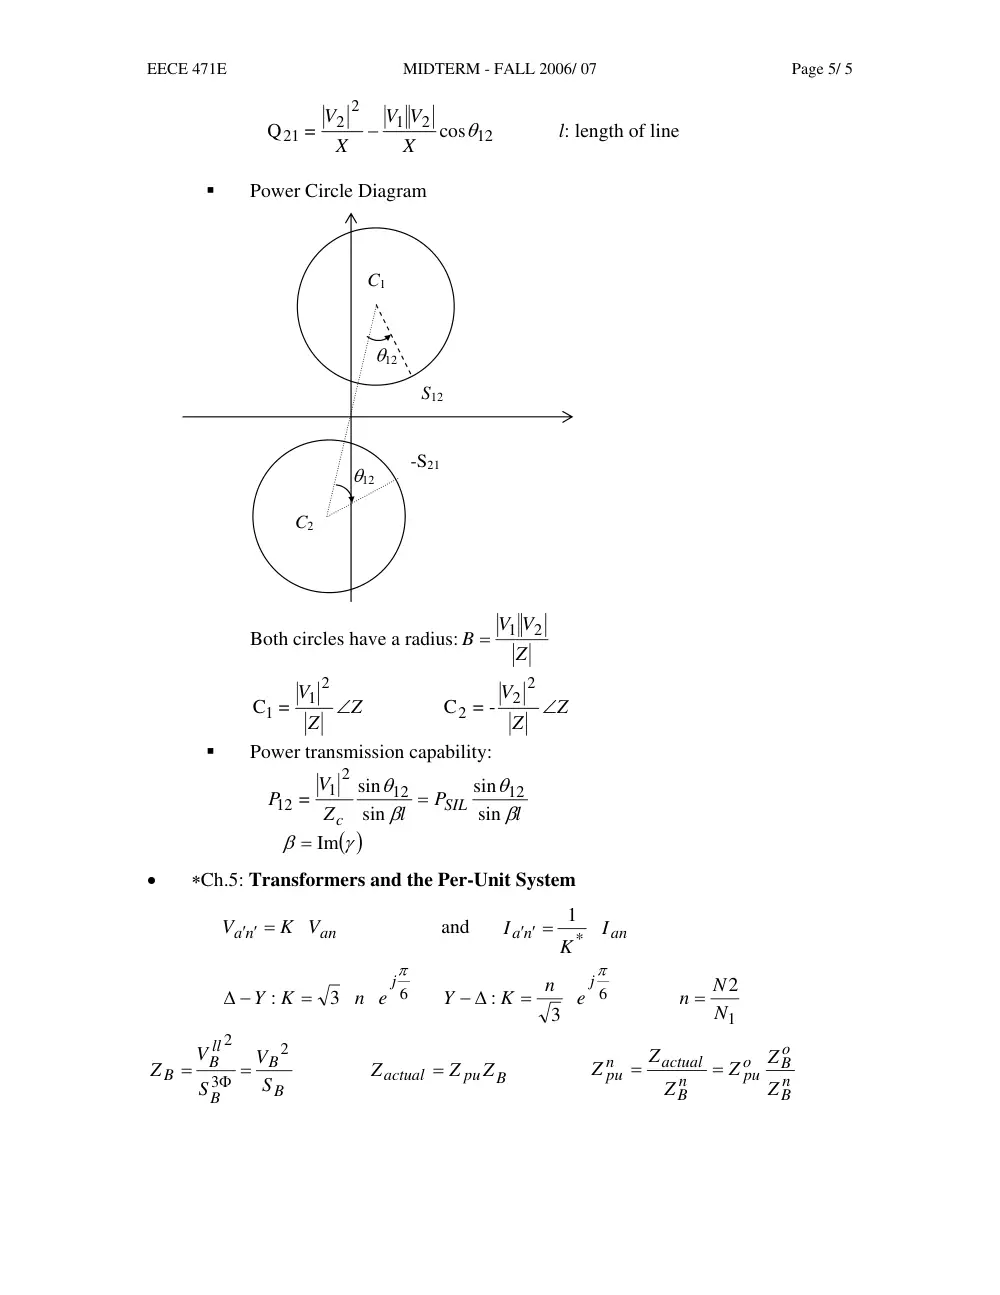
Power Circle Diagram
C1
C2
S12
-S21
θ12
θ12
Both circles have a radius:
Z
V V
B
2
1
=
Z
Z
V
∠
2
1
C1 =
Z
Z
V
∠
2
2
2
-
=
C
�
Power transmission capability:
l
P
l
Z
V
P
SIL
c
β
θ
β
θ
sin
sin
sin
sin
=
12
12
2
1
12
=
( )
γ
β
= Im
•
∗Ch.5: Transformers and the Per-Unit System
an
a n
K V
V
′ ′ =
and
an
a n
I
K
I
*
1
′ ′ =
6
3
:
jπ
n e
K
Y
=
∆ −
6
3
:
jπ
e
n
K
Y
=
− ∆
1
2
N
n = N
B
B
B
ll
B
B
S
V
S
V
Z
2
3
2
=
=
Φ
B
pu
actual
Z
Z
Z
=
n
B
o
B
o
pu
n
B
actual
n
pu
Z
Z
Z
Z
Z
Z
=
=