
STAT 201 Exam 2, Spring 2000
American University of Beirut · Elementary Statistics for the Social Sciences · 1 page
Stuck on a question? A tutor can walk you through it.
More STAT 201 files
Show the text of this exam
NG 1G 3@ tas “
Rasene Reading Room
Not To B@ Taken Ow
Reserve Raading Roem
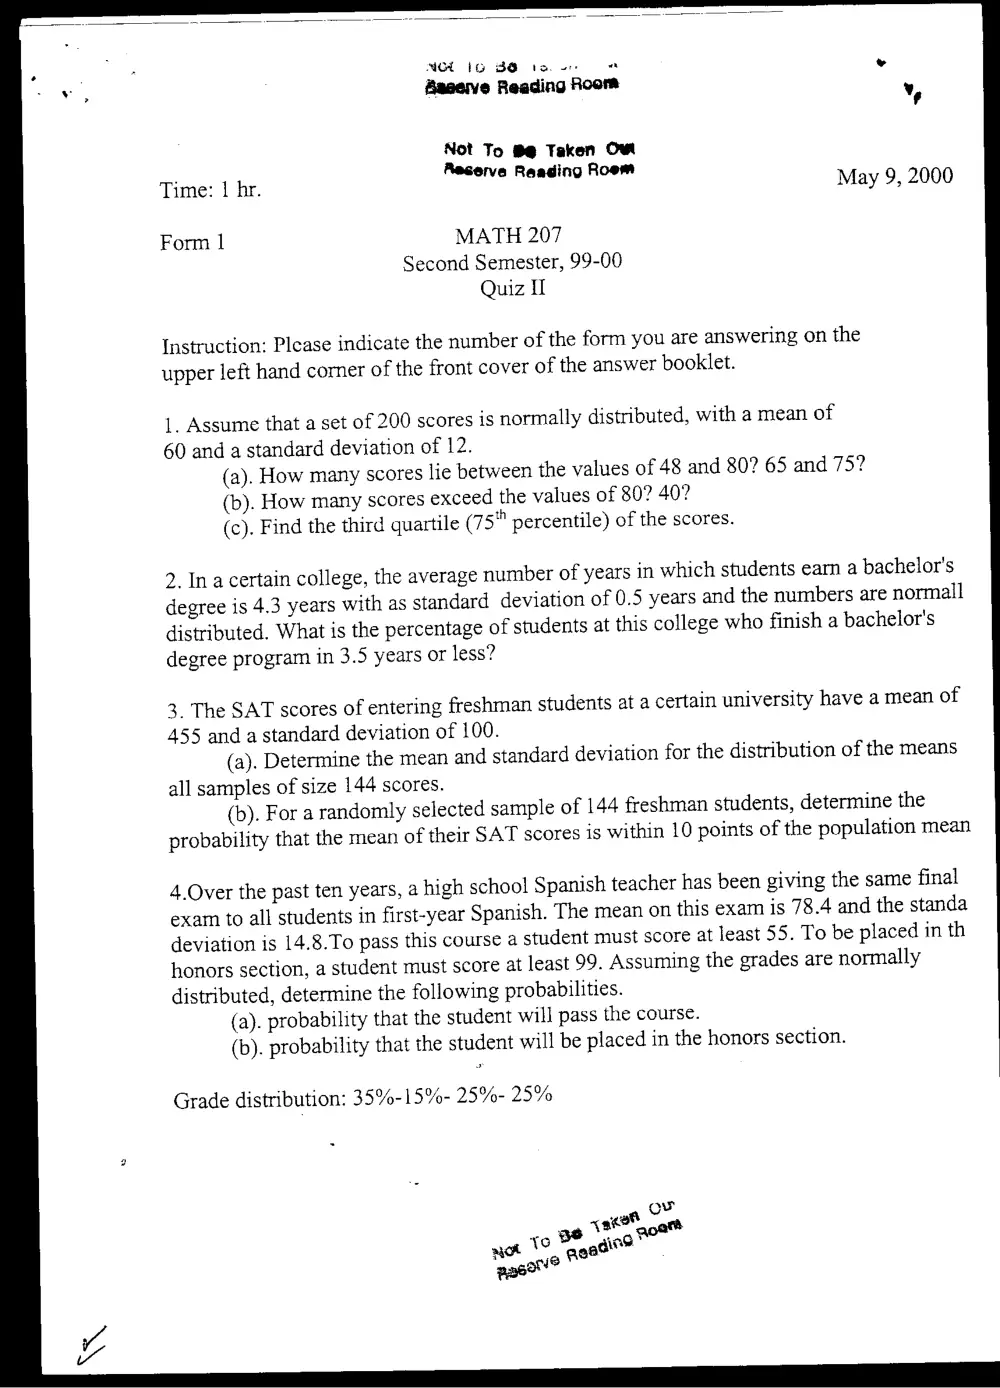
MATH 207
Second Semester, 99-00
Quiz
Instruction: Please indicate the number of the form you are answering on the
upper left hand corner of the front cover of the answer booklet.
1. Assume that a set of 200 scores is normally distributed, with a mean of
60 and a standard deviation of 12.
(a). How many scores lie between the values of 48 and 80? 65 and 75?
(b). How many scores exceed the values of 80? 40?
(c). Find the third quartile (75" percentile) of the scores.
2. In acertain college, the average number of years in which students earn a bachelor’s
degree is 4.3 years with as standard deviation of 0.5 years and the numbers are normall
distributed, What is the percentage of students at this college who finish a bachelor's
degree program in 3.5 years or less?
3. The SAT scores of entering freshman students at a certain university have a mean of
455 and a standard deviation of 100.
(a). Determine the mean and standard deviation for the distribution of the means
all samples of size 144 scores.
(b). For a randomly selected sample of 144 freshman students, determine the
probability that the mean of their SAT scores is within 10 points of the population mean
4.Over the past ten years, a high school Spanish teacher has been giving the same final
exam to all students in first-year Spanish. The mean on this exam is 78.4 and the standa
deviation is 14.8.To pass this course a student must score at least 55. To be placed in th
honors section, a student must score at least 99. Assuming the grades are normally
distributed, determine the following probabilities.
(a). probability that the student will pass the course.
(b). probability that the student will be placed in the honors section.
Grade distribution: 35%-15%- 25%- 25%