
STAT 201 Exam 2, Spring 2001
American University of Beirut · Elementary Statistics for the Social Sciences · 2 pages

More STAT 201 files
Show the text of this exam
Not Te S@ Taken Ovt
Tt a i
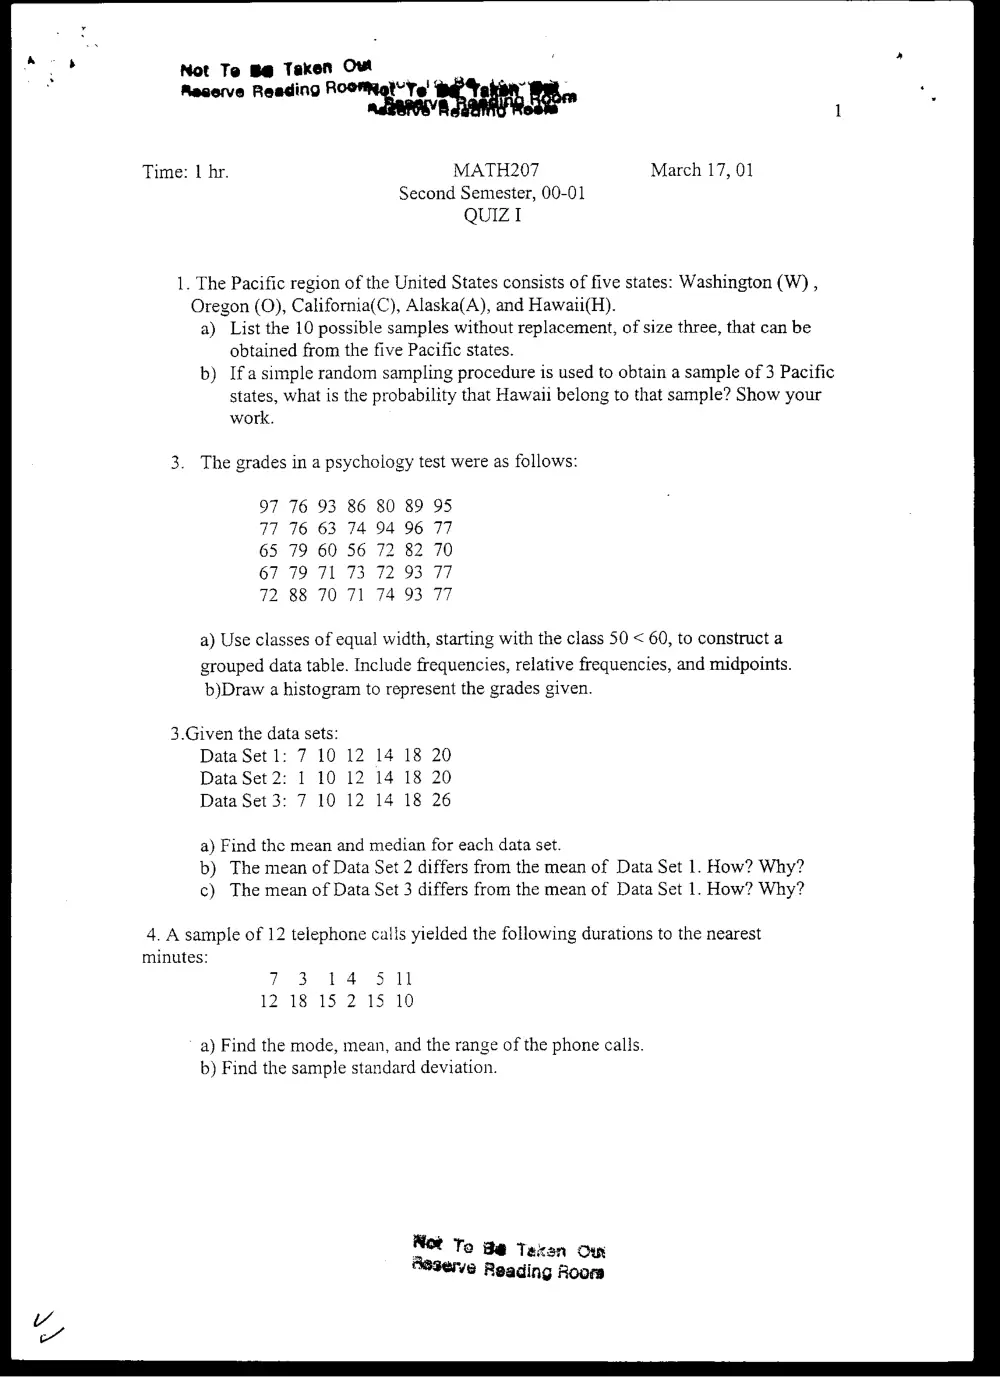
Time: | hr. MATH207 March 17, 01
Second Semester, 00-01
QUIZ I
1. The Pacific region of the United States consists of five states: Washington (W) ,
Oregon (0), California(C), Alaska(A), and Hawaii(H).
a) List the 10 possible samples without replacement, of size three, that can be
obtained from the five Pacific states.
b) Ifa simple random sampling procedure is used to obtain a sample of 3 Pacific
states, what is the probability that Hawaii belong to that sample? Show your
work.
3. The grades in a psychology test were as follows:
97 76 93 86 80 89 95
77 76 63 74 94 96 77
65 79 60 56 72 82 70
67 79 71 73 72 93 77
72 88 70 71 74 93 77
a) Use classes of equal width, starting with the class 50 < 60, to construct a
grouped data table. Include frequencies, relative frequencies, and midpoints.
b)Draw a histogram to represent the grades given.
3.Given the data sets:
Data Set 1: 7 10 12 14 18 20
Data Set 2: 1 10 12 14 18 20
Data Set 3: 7 10 12 14 18 26
a) Find the mean and median for each data set.
b) The mean of Data Set 2 differs from the mean of Data Set 1. How? Why?
c) The mean of Data Set 3 differs from the mean of Data Set 1. How? Why?
4. A sample of 12 telephone calls yielded the following durations to the nearest
minutes:
7 3°14 511
12 18 15 2 15 10
a) Find the mode, mean, and the range of the phone calls.
b) Find the sample standard deviation.
Wot To ge Taxen Om
Aaserve Reading Room
5. Twenty small investors lost money in stocks last week. The amounts they lost( in
hundreds of dollars) were:
10 13 22 26 16
4] 35 24 23 27
52 31 17 20 3
26 46 30 19 2
a) Find the interquartile range (IQR) of these amounts.
b) Find their five- number-summary.