
STAT 201 Exam 2, Spring 2002
American University of Beirut · Elementary Statistics for the Social Sciences · 3 pages

More STAT 201 files
Show the text of this exam
Not To @@ Taken Vu
Reserve Reading Roo
. e
Time: 50 minutes Us April 2, 2002
MATH 207, C,
TX
QuizI
Second Semester, 01-02
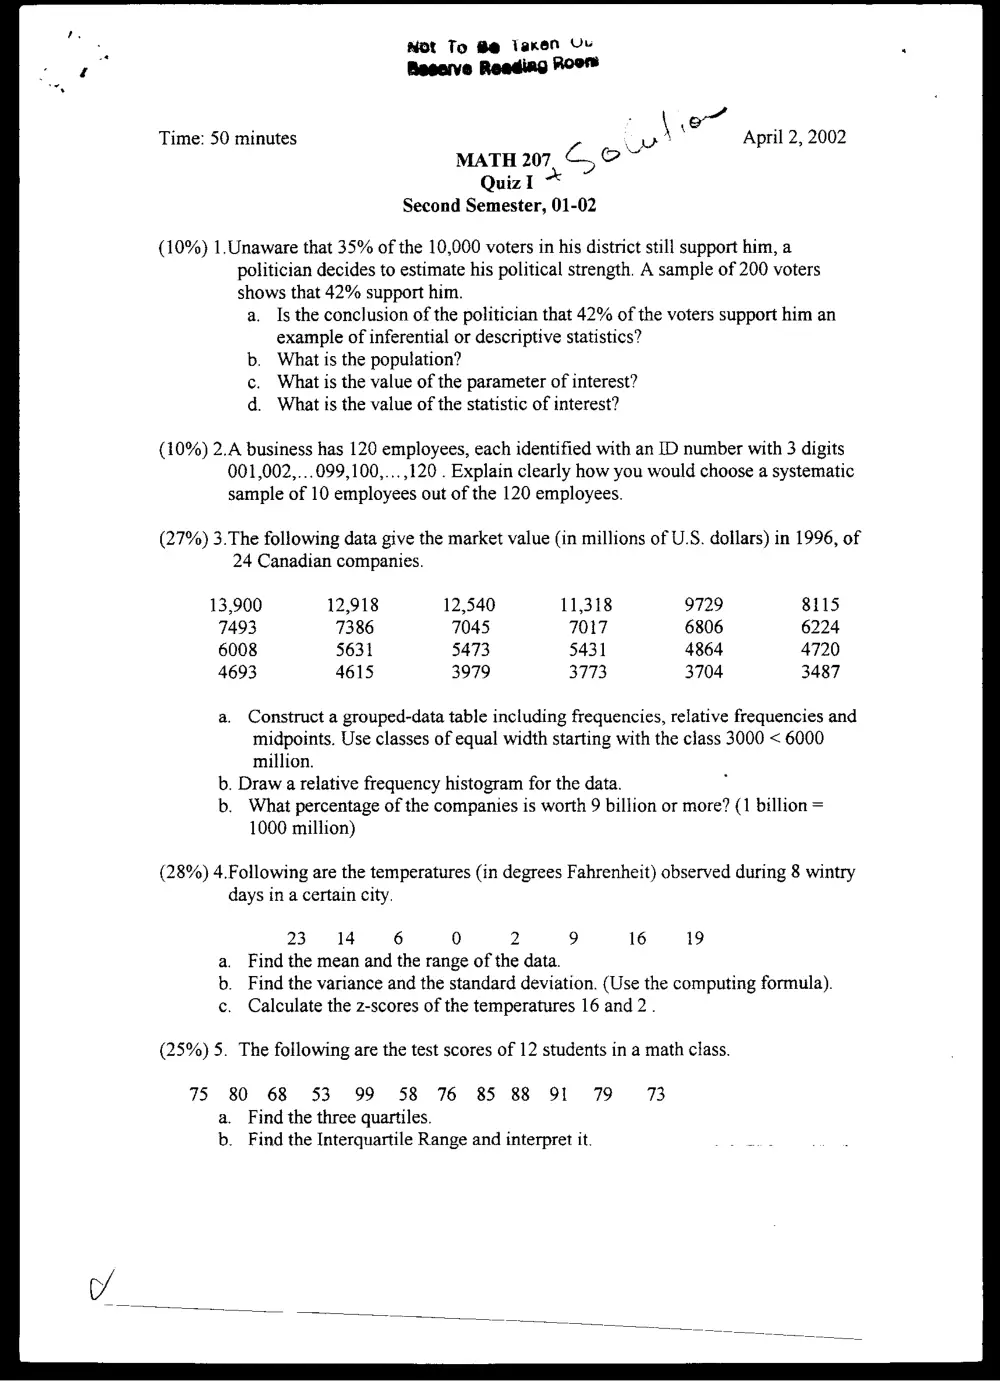
(10%) 1.Unaware that 35% of the 10,000 voters in his district still support him, a
politician decides to estimate his political strength. A sample of 200 voters
shows that 42% support him.
a. Is the conclusion of the politician that 42% of the voters support him an
example of inferential or descriptive statistics?
b. What is the population?
c. What is the value of the parameter of interest?
d. What is the value of the statistic of interest?
(10%) 2.A business has 120 employees, each identified with an ID number with 3 digits
001,002,...099,100,...,120 . Explain clearly how you would choose a systematic
sample of 10 employees out of the 120 employees.
(27%) 3.The following data give the market value (in millions of U.S. dollars) in 1996, of
24 Canadian companies.
13,900 12,918 12,540 11,318 9729 8115
7493 7386 7045 7017 6806 6224
6008 5631 5473 5431 4864 4720
4693 4615 3979 3773 3704 3487
a. Construct a grouped-data table including frequencies, relative frequencies and
midpoints. Use classes of equal width starting with the class 3000 < 6000
million.
b. Draw a relative frequency histogram for the data.
b. What percentage of the companies is worth 9 billion or more? (1 billion =
1000 million)
(28%) 4.Following are the temperatures (in degrees Fahrenheit) observed during 8 wintry
days in a certain city.
23 «14 6 0 2 9 16 19
a. Find the mean and the range of the data.
b. Find the variance and the standard deviation. (Use the computing formula).
c. Calculate the z-scores of the temperatures 16 and 2.
(25%) 5. The following are the test scores of 12 students in a math class.
75 80 68 53 99 58 76 85 88 91 79 73
a. Find the three quartiles.
b. Find the Interquartile Range and interpret it.
Ss T met 3) !
fe MATT 209 tevane Reading Room
“4
Qui2me
Second Semester Ol -9O >".
Solutions
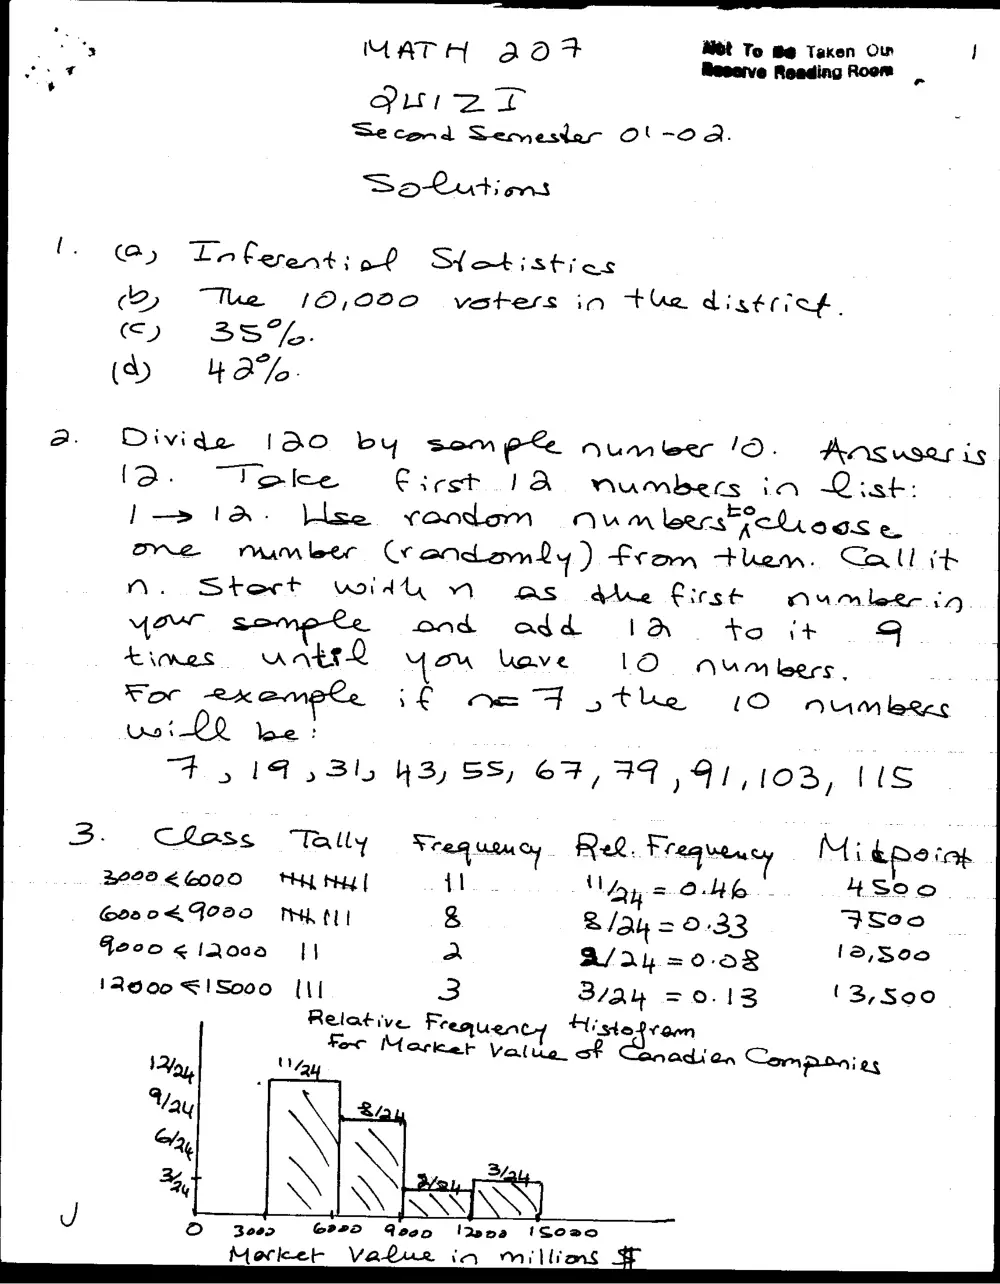
(GO) La leant: of Heotistras
(2 “Me 10,020 voters in the districg.
Cy) ZB35°%.
(a> 4 AY.
a Divide 100 by seme number /O. Ancuser is
[Q. “Telee Eicsh 1A numbers in Q:ist:
}—»tArA. Llse vrondom Aum leacsPeliogse.
One namleer CW aendenty ) From them. Call st
MW. Stect wid 1 as dee Cirst Dumleke in.
you sompeLe ernk add IR to es
dimes. UntsQ ou lave LO AuUmlegcs .
Foc ek am if Oc 5» the LO NUM eeec
01 LQ lee:
F514 5315 43) SS) 6F, 49 91,103, IIS
3. Chass “Tally Fred Wau cy ; Riek. Frequency IE kpe ab
BOPAEGOQO =H NY | {1 Vays 0-H - 4 S90.
G200<F080 MLL! & R/ay = 0-33 Seo
4o00 < lQooa im a B/a4 =0-o8 1d,500
12600 <!So00 [11 3 3/ay =0.13 (23,8500.
Mee anetene, Mistedeaen: |
Ay} a “e Adien Componies
Vay
ray
4,
J 2D Bee GaeD Geen '2ana Gono
Moricet Value in millims
Wot To Be Taken: x
, Reserve Reading Root:
vy” @
ly, QA. Ween Kz Sx _ BH 2 NASR llta
8B ~S.
Rome = lo. ekest —sma lee =Aa2P-O =93
b, *
a3 $a \*
ue 146 cao 207 EX
& 36 i)
o 8608 s. 463 - 7 67.5835
a 4 =)
ol 8 | Ss? is) Variance:
(6 356 S:D. s=\\vosmn = 2,92
(G Bél
ce Stadord Scores!
Foc x2/6) ze (6-113 _ 589
8:2 7
Vor & = 2, ve QR H-—NNB_ _he |]
ascending Baa
S53 58 68!493 #5 46599 So 25,8R 41 99
fay) Qo, a
S.Stips 6 Sthpas Sd pos.
Qa =tt?F. 975, Qiz GBtF93 270-5; Qa SS+ B8 = BES
TQA- Qa — Qe BES -FOS= 1é
Late p~etotion : Middle 50% of data values Orewiduin 1G maids.
Boxpfot ' Q, 2
=
3
!
50 S55 Go Fo IR5 ES aq 45
AN RN Bo