
STAT 201 Final, Fall 2007
American University of Beirut · Elementary Statistics for the Social Sciences · 5 pages


More STAT 201 files
Show the text of this final exam
American University of Beirut
Department of Mathematics
STAT 201-Elementary Statistics
Fall 2007
Final Exam
Name: ____________________
Section: ___________
ID #
____________________
A normal table & T- table is attached to the end of this exam. Circle only one answer for
each question. If you show your work in the space provided you may receive partial
credit.
Good Luck!
1. An advisor to the mayor of a large city wants to estimate, within 3 minutes, the
mean travel time to work for all employees who work within the city limits. He
knows that the standard deviation for all travel times is 12.25 minutes. He also
wants to achieve a 95% confidence interval. He will poll a random sample of city
employees. How many employees should he poll?
a. 25
b. 35
c. 65
d. 85
2. Suppose that [133.8;140] is a z-confidence interval for a population mean, based
on a sample of size 64. If the population standard deviation is 15.1. what
confidence level is used
(a) 95%
(b) 90%
(c) 99%
(d) 98%
3. If the testing of Ho : µ = 70 vs. HA : µ ≠ 70 at a significance level α=0.05 results
in a P-value = 0.03 then which of the following is true?
a. Ho is not rejected
b. Ho is rejected
c. HA is rejected
d. Need more information to conclude
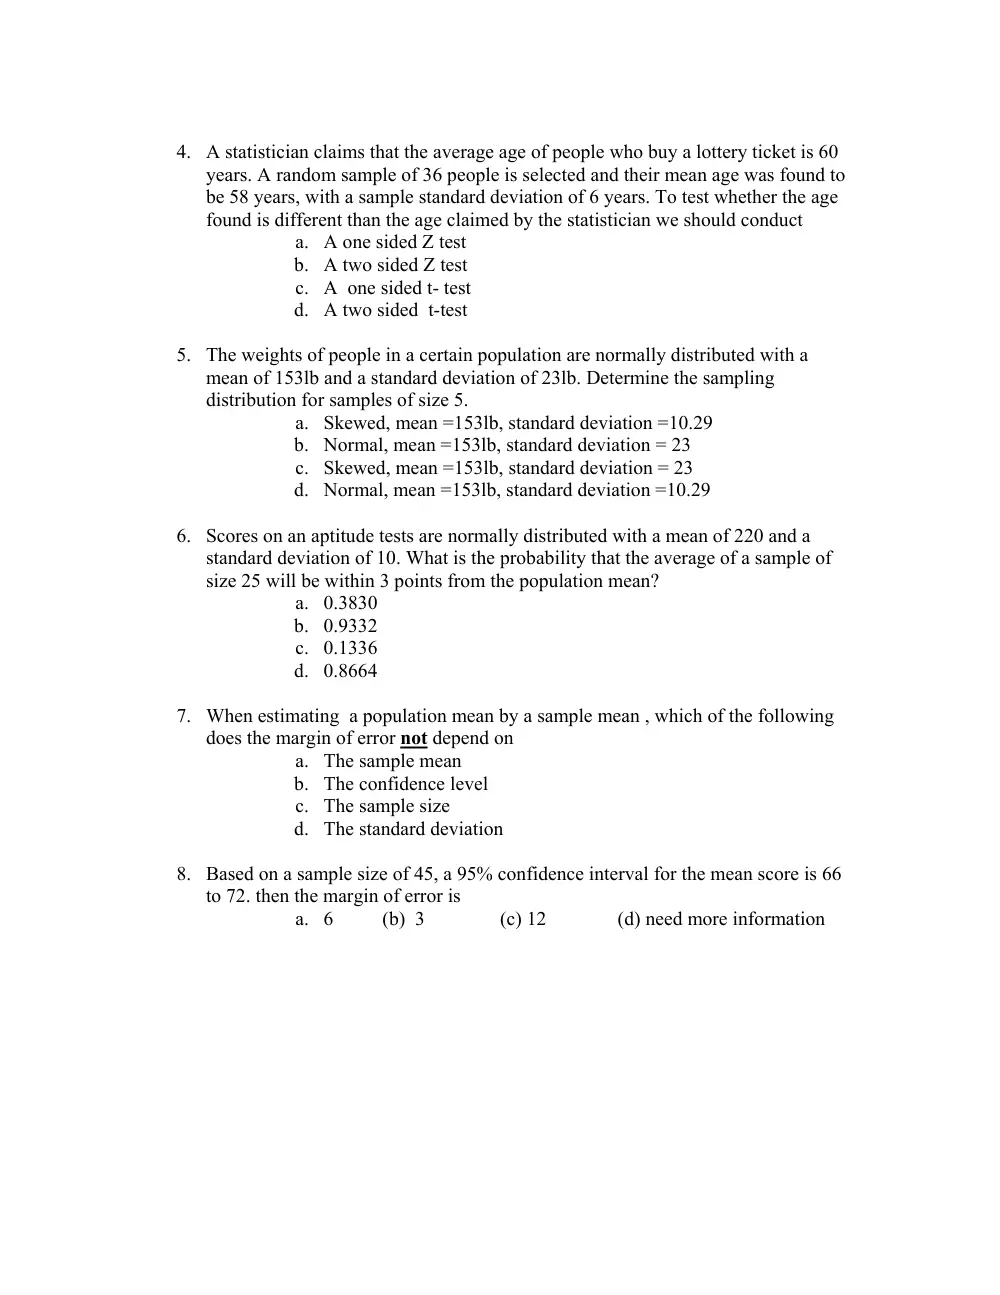
4. A statistician claims that the average age of people who buy a lottery ticket is 60
years. A random sample of 36 people is selected and their mean age was found to
be 58 years, with a sample standard deviation of 6 years. To test whether the age
found is different than the age claimed by the statistician we should conduct
a. A one sided Z test
b. A two sided Z test
c. A one sided t- test
d. A two sided t-test
5. The weights of people in a certain population are normally distributed with a
mean of 153lb and a standard deviation of 23lb. Determine the sampling
distribution for samples of size 5.
a. Skewed, mean =153lb, standard deviation =10.29
b. Normal, mean =153lb, standard deviation = 23
c. Skewed, mean =153lb, standard deviation = 23
d. Normal, mean =153lb, standard deviation =10.29
6. Scores on an aptitude tests are normally distributed with a mean of 220 and a
standard deviation of 10. What is the probability that the average of a sample of
size 25 will be within 3 points from the population mean?
a. 0.3830
b. 0.9332
c. 0.1336
d. 0.8664
7. When estimating a population mean by a sample mean , which of the following
does the margin of error not depend on
a. The sample mean
b. The confidence level
c. The sample size
d. The standard deviation
8. Based on a sample size of 45, a 95% confidence interval for the mean score is 66
to 72. then the margin of error is
a. 6
(b) 3
(c) 12
(d) need more information
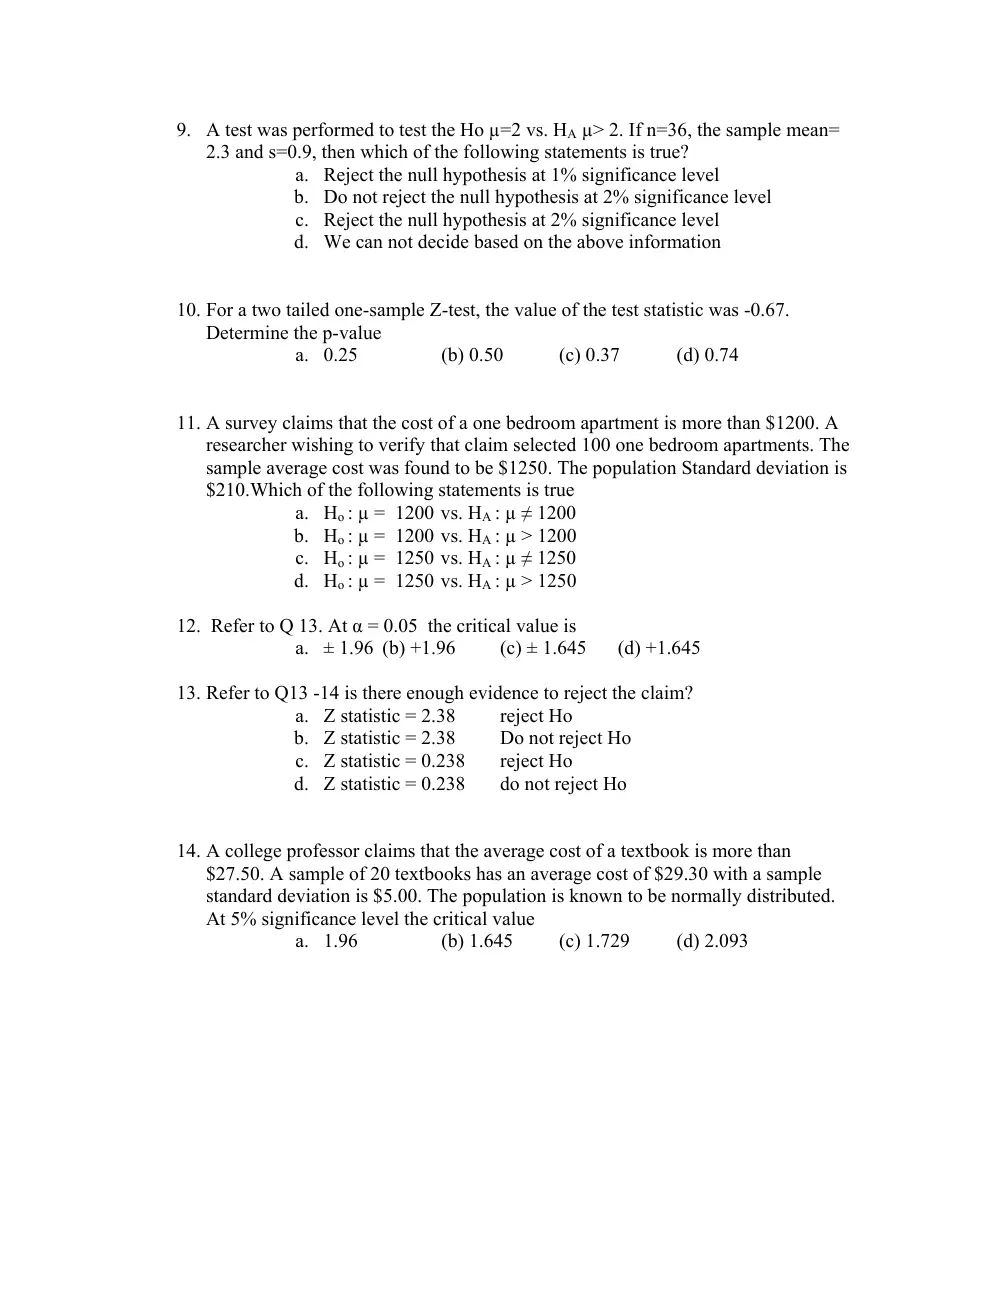
9. A test was performed to test the Ho µ=2 vs. HA µ> 2. If n=36, the sample mean=
2.3 and s=0.9, then which of the following statements is true?
a. Reject the null hypothesis at 1% significance level
b. Do not reject the null hypothesis at 2% significance level
c. Reject the null hypothesis at 2% significance level
d. We can not decide based on the above information
10. For a two tailed one-sample Z-test, the value of the test statistic was -0.67.
Determine the p-value
a. 0.25
(b) 0.50
(c) 0.37
(d) 0.74
11. A survey claims that the cost of a one bedroom apartment is more than $1200. A
researcher wishing to verify that claim selected 100 one bedroom apartments. The
sample average cost was found to be $1250. The population Standard deviation is
$210.Which of the following statements is true
a. Ho : µ = 1200 vs. HA : µ ≠ 1200
b. Ho : µ = 1200 vs. HA : µ > 1200
c. Ho : µ = 1250 vs. HA : µ ≠ 1250
d. Ho : µ = 1250 vs. HA : µ > 1250
12. Refer to Q 13. At α = 0.05 the critical value is
a. ± 1.96 (b) +1.96
(c) ± 1.645
(d) +1.645
13. Refer to Q13 -14 is there enough evidence to reject the claim?
a. Z statistic = 2.38
reject Ho
b. Z statistic = 2.38
Do not reject Ho
c. Z statistic = 0.238
reject Ho
d. Z statistic = 0.238
do not reject Ho
14. A college professor claims that the average cost of a textbook is more than
$27.50. A sample of 20 textbooks has an average cost of $29.30 with a sample
standard deviation is $5.00. The population is known to be normally distributed.
At 5% significance level the critical value
a. 1.96
(b) 1.645
(c) 1.729
(d) 2.093
15. The average time it takes a child to react to noise is normally distributed with a
mean of 1.5 seconds with a standard deviation of 0.3 seconds. What is the
probability that a child will require more than 2.2 seconds to react?
a. 0.0099
b. 0.9901
c. 0.0918
d. None of the above
16. Find the regression line for the data points:
X
1
1
5
5
Y
1
3
2
4
∑x = 12
∑y= 10
∑ xy = 34
∑x 2 = 52
a. y= 1.75 +0.25 x
b. y= 1.75 - 0.25 x
c. y= 0.25 + 1.75 x
d. y= 0.25 – 1.75 x
17. Find two values symmetric about a mean of 100, standard deviation of 10, such
that they include an area equal to 0.95.
a. 90,110
b. 80.4, 119.6
c. 98.04, 101.96
d. 70, 130
18. Following is the probability distribution for a random variable X
X
0
1
2
3
4
P(X) 0.1
0.2
0.4
0.2
0.1
the probability that x is at least 3 is
a. 0.2
(b) 0.1
(c) 0.3
(d) 0.7
19. When the value α increases, the probability of committing Type I error
a. Increases
b. Decreases
c. Remains the same
d. Has nothing to do with type I error
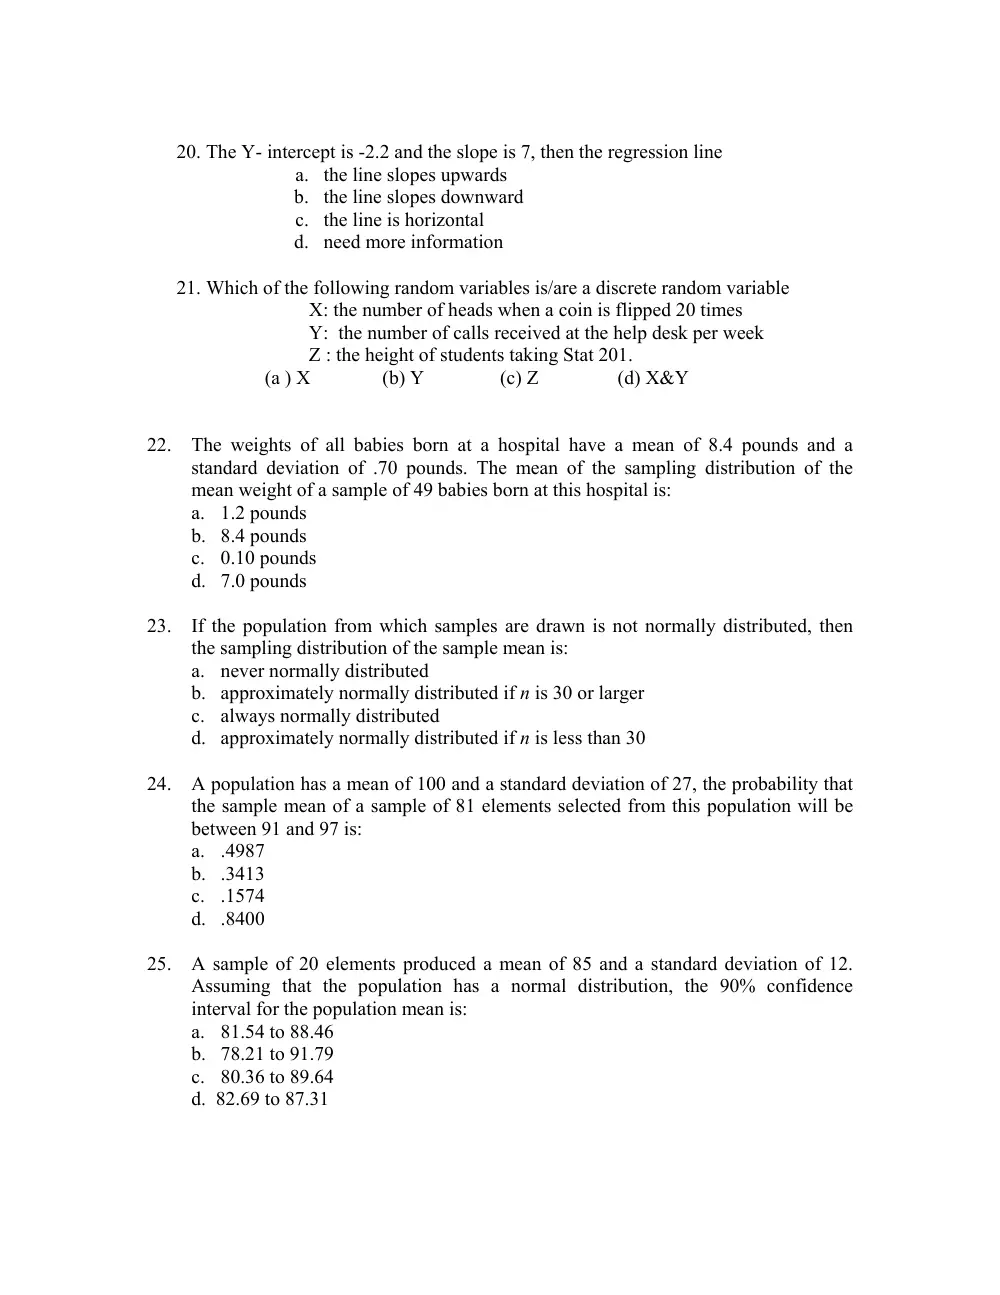
20. The Y- intercept is -2.2 and the slope is 7, then the regression line
a. the line slopes upwards
b. the line slopes downward
c. the line is horizontal
d. need more information
21. Which of the following random variables is/are a discrete random variable
X: the number of heads when a coin is flipped 20 times
Y: the number of calls received at the help desk per week
Z : the height of students taking Stat 201.
(a ) X
(b) Y
(c) Z
(d) X&Y
22. The weights of all babies born at a hospital have a mean of 8.4 pounds and a
standard deviation of .70 pounds. The mean of the sampling distribution of the
mean weight of a sample of 49 babies born at this hospital is:
a. 1.2 pounds
b. 8.4 pounds
c. 0.10 pounds
d. 7.0 pounds
23. If the population from which samples are drawn is not normally distributed, then
the sampling distribution of the sample mean is:
a. never normally distributed
b. approximately normally distributed if n is 30 or larger
c. always normally distributed
d. approximately normally distributed if n is less than 30
24. A population has a mean of 100 and a standard deviation of 27, the probability that
the sample mean of a sample of 81 elements selected from this population will be
between 91 and 97 is:
a. .4987
b. .3413
c. .1574
d. .8400
25. A sample of 20 elements produced a mean of 85 and a standard deviation of 12.
Assuming that the population has a normal distribution, the 90% confidence
interval for the population mean is:
a. 81.54 to 88.46
b. 78.21 to 91.79
c. 80.36 to 89.64
d. 82.69 to 87.31