
STAT 201 Final, Spring 2004
American University of Beirut · Elementary Statistics for the Social Sciences · 3 pages
More STAT 201 files
Show the text of this final exam
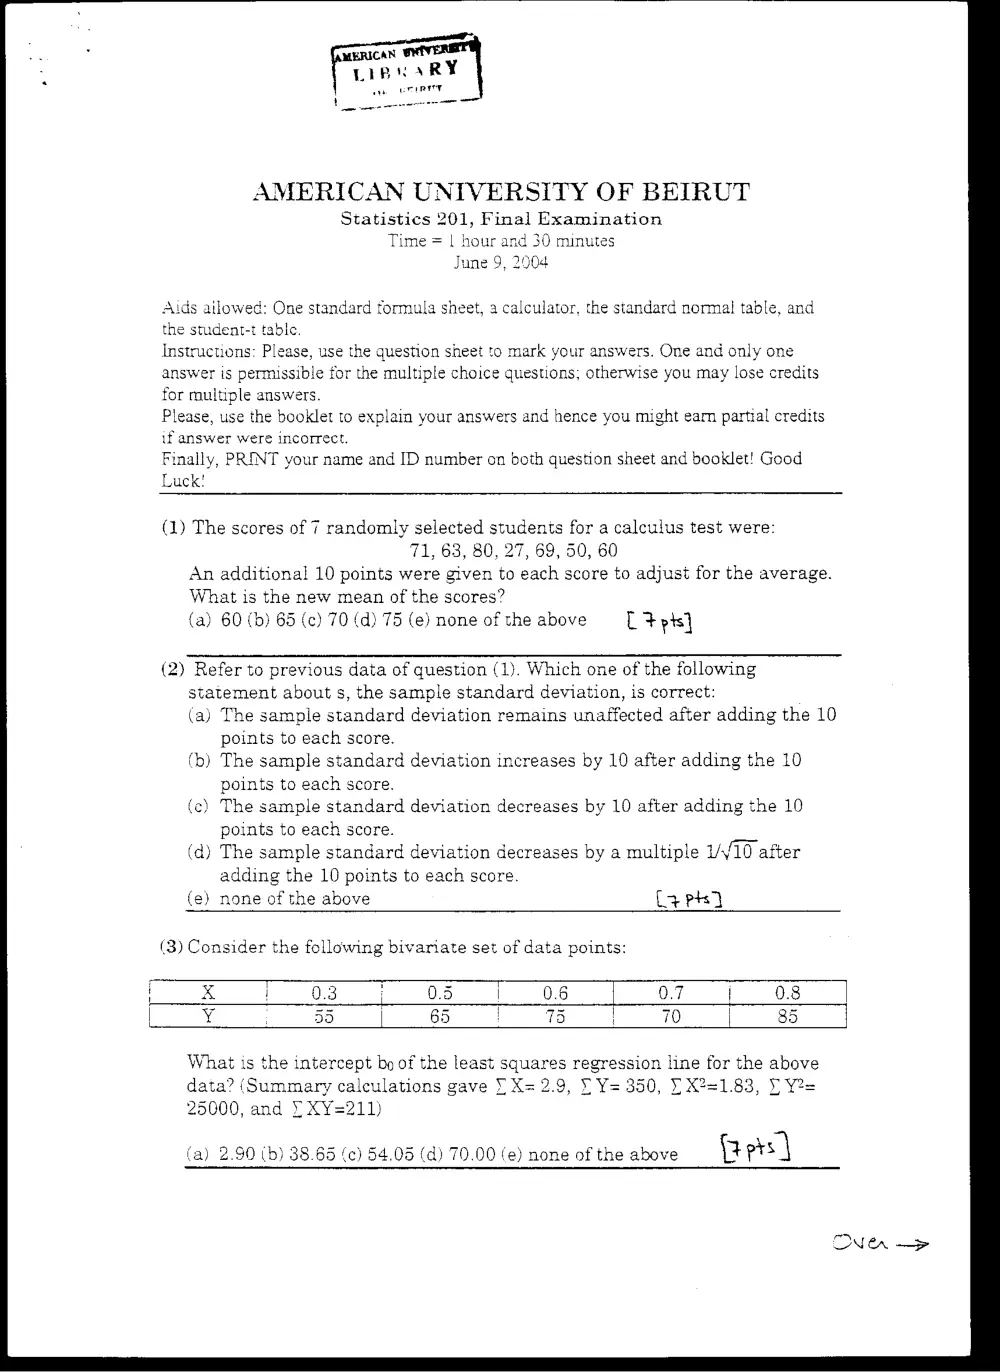
AMERICAN UNIVERSITY OF BEIRUT
Statistics 201, Final Examination
Time = | hour and 30 minutes
June 9, 2004
Aids atlowed: One standard formula sheet, a calculator, the standard normal table, and
the student-t table.
Instructions: Please, use the question sheet to mark your answers. One and only one
answer is permissible for the multiple choice questions; otherwise you may lose credits
for multiple answers.
Please, use the booklet to explain your answers and hence you might earn partial credits
if answer were incorrect.
Finally, PRINT your name and ID number on doth question sheet and booklet! Good
Luck!
(1) The scores of 7 randomly selected students for a calculus test were:
71, 63, 80, 27, 69, 50, 60
An additional 10 points were given to each score to adjust for the average.
What is the new mean of the scores?
(a) 60 (b) 65 (c) 70 (d) 75 (e) none of the above Lt pts]
(2) Refer to previous data of question (1). Which one of the following
statement about s, the sample standard deviation, is correct:
(a) The sample standard deviation remains unaffected after adding the 10
points to each score.
(b) The sample standard deviation increases by 10 after adding the 10
points to each score.
(c) The sample standard deviation decreases by 10 after adding the 10
points to each score.
(d) The sample standard deviation decreases by a multiple VY10 after
adding the 10 points to each score.
(e) none of the above Lap)
(3) Consider the following bivariate set of data points:
0.6 | 0.8
73 i | 85
What is the intercept bo of the least squares regression line for the above
data? ‘Summary calculations gave ¥ X= 2.9, 8 Y= 350, 5 X2=1.83, VY Y2=
25000, and ¥ XY=211)
(a) 2.90 (b) 38.65 (c) 54.05 (d) 70.00 (e) none of the above B prs |
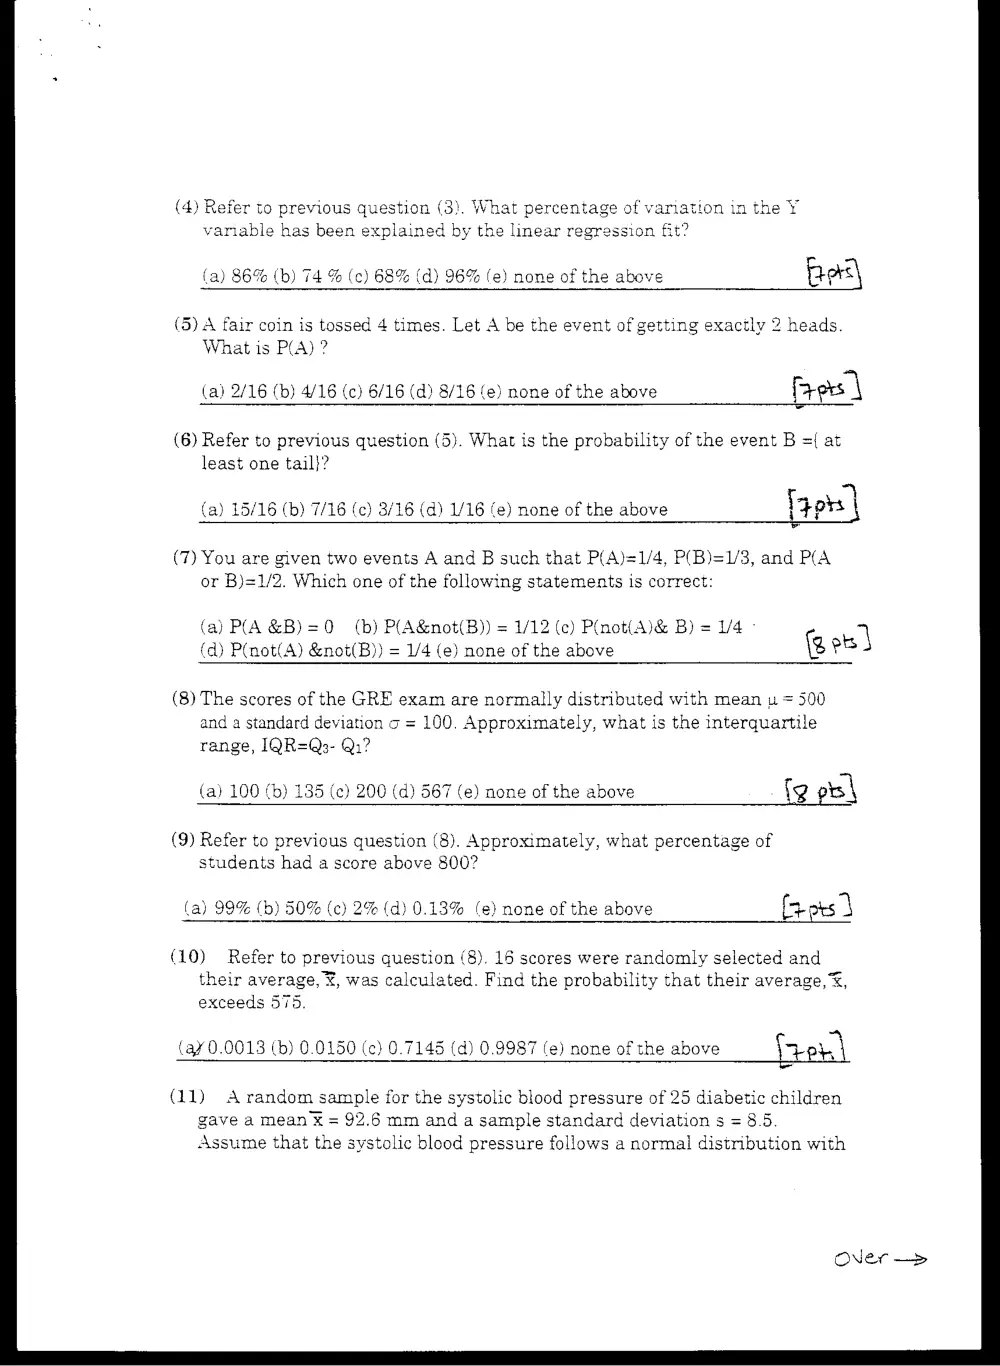
(4) Refer to previous question (3). What percentage of variation in the Y
variable has been explained by the linear regression fit?
(a) 86% (b) 74 % (c) 68% (d) 96% fe) none of the above Bes\
(5) A fair coin is tossed 4 times. Let A be the event of getting exactly 2 heads.
What is P(A) ?
~
(a) 2/16 (b) 4/16 (c) 6/16 (d) 8/16 (e) none of the above [es \
(6) Refer to previous question (5). What is the probability of the event B ={ at
least one tail}?
(a) 15/16 (b) 7/16 (c) 3/16 (d) 1/16 (e) none of the above ipots
(7) You are given two events A and B such that P(A)=1/4, P(B)=1/3, and P(A
or B)=1/2. Which one of the following statements is correct:
(a) PA &B)=0 (b) P(A¬(B)) = 1/12 (c) Pinot(A)& B) = 1/4 ° 7
(d) P(not(A) ¬(B)) = 1/4 (e) none of the above & pts
(8) The scores of the GRE exam are normally distributed with mean u = 500
and a standard deviation g = 100. Approximately, what is the interquartile
range, IQR=Q3- Qi?
(a) 100 (b) 135 (¢) 200 (d) 587 (e) none of the above (g ps\
(9) Refer to previous question (8). Approximately, what percentage of
students had a score above 800?
(a) 99% (b) 50% (c) 2% (d) 0.13% (e}) none of the above fr pts |
(10) Refer to previous question (8). 16 scores were randomly selected and
their average, ¥, was calculated. Find the probability that their average, &,
exceeds 575.
(ay 0.0013 (b) 0.0150 (c) 0.7145 (d) 0.9987 (e) none of the above et \
(11) A random sample for the systolic blood pressure of 25 diabetic children
gave a mean x = 92.6 mm and a sample standard deviation s = 8.5.
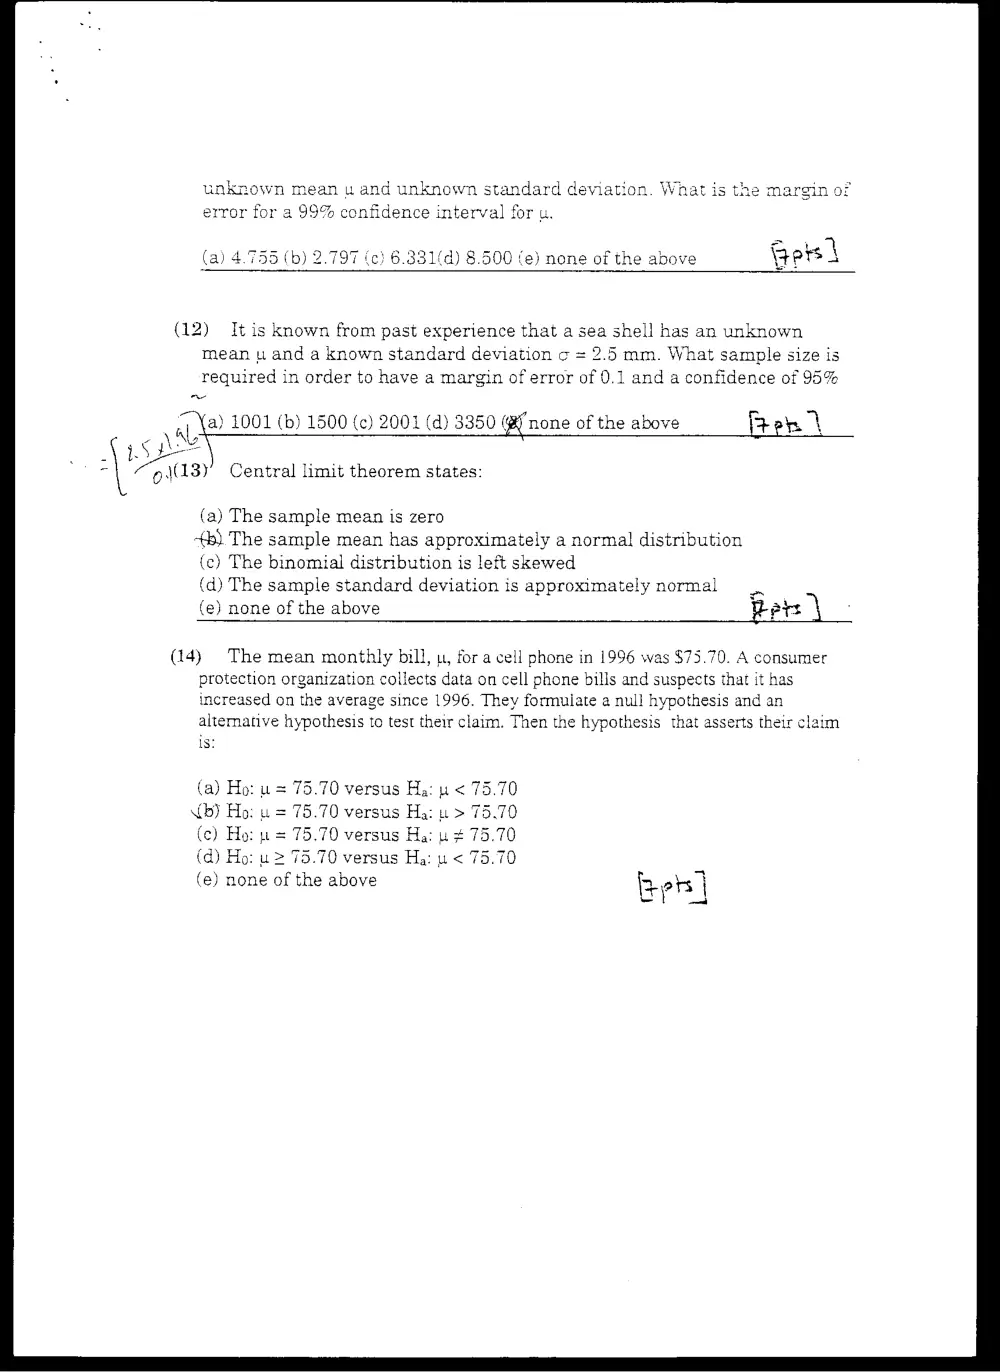
Assume that the systolic blood pressure follows a normal distribution with
ONer — >
unknown mean u and unknown standard deviation. What is the m
error for a 99% confidence interval for u.
(a) 4.755 (b) 2.797 (c} 6.331{d) 8.500 fe) none of the above
(12) It is known from past experience that a sea shell has an unknown
mean u and a known standard deviation c = 2.5 mm. What sample size is
required in order to have a margin of error of 0.1 and a confidence of 95%
~
~ Ya) 1001 (b) 1500 (c) 2001 (d) 3350 none of the above Ren |
ae “2 oo
\ 08) Central limit theorem states:
(a) The sample mean is zero
+b). The sample mean has approximately a normal distribution
(c) The binomial distribution is left skewed
(d) The sample standard deviation is approximately normal
(e) none of the above Per \
(14) The mean monthly bill, u, for a cell phone in 1996 was $75.70. A consumer
protection organization collects data on cell phone bills and suspects that it has
increased on the average since 1996. They formulate a null hypothesis and an
alternative hypothesis to test their claim. Then the hypothesis that asserts their clatm
‘st
(a) Ho: u = 75.70 versus Ha: uw < 75.70
0b) Ho: u = 75.70 versus Ha: u > 75.70
(ce) Ho: p = 75.70 versus Ha: u # 75.70
(d) Ho: u > 75.70 versus Ha: u < 75.70
(e) none of the above