
STAT 201 Final, Spring 2008
American University of Beirut · Elementary Statistics for the Social Sciences · 4 pages
More STAT 201 files
Show the text of this final exam
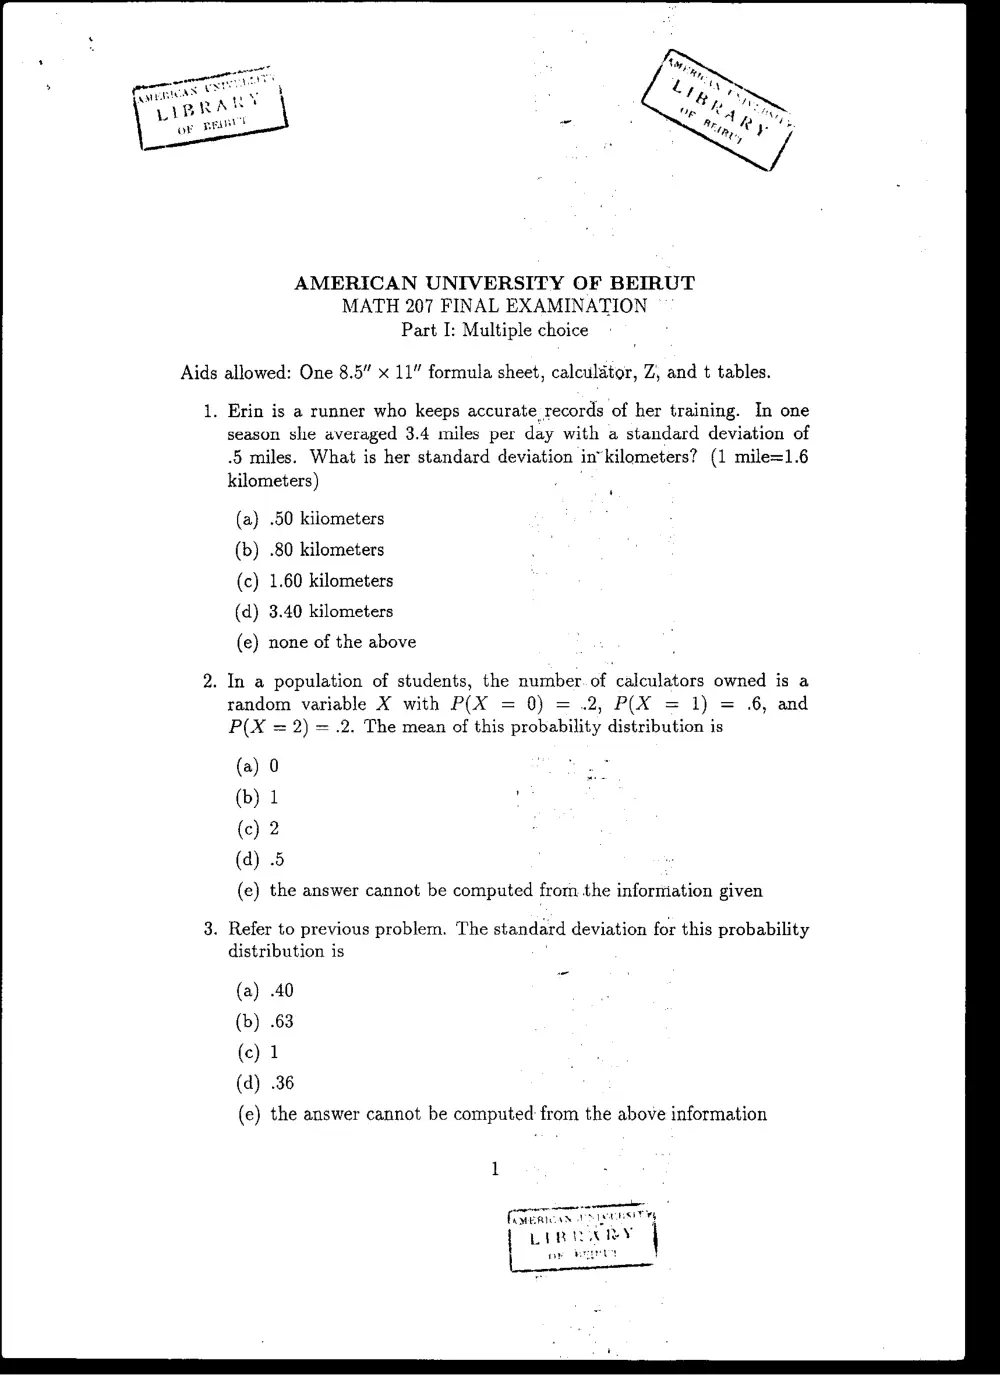
AMERICAN UNIVERSITY OF BEIRUT
MATH 207 FINAL EXAMINATION —”
Part I: Multiple choice ;
Aids allowed: One 8.5” x 11” formula sheet, calculator, Z, and t tables.
1. Erin is a runner who keeps accurate records of her training. In one
season she averaged 3.4 miles per day with a standard deviation of
.5 miles. What is her standard deviation in’kilometers? (1 mile=1.6
kilometers) ‘
‘
(a) .50 kilometers
(b) .80 kilometers
(c) 1.60 kilometers
(d) 3.40 kilometers
(e) none of the above
. In a population of students, the number of calculators owned is a
random variable X with P(X = 0) = .2, P(X = 1) = .6, and
P(X = 2) =.2. The mean of this probability distribution is
e) the answer cannot be computed from the information given
. Refer to previous problem. The standard deviation for this probability
distribution is ;
(a) .40
(b) .63
(c) 1
(d) .36
(e) the answer cannot be computed from the above information
(yreRtcas Net Hse
|
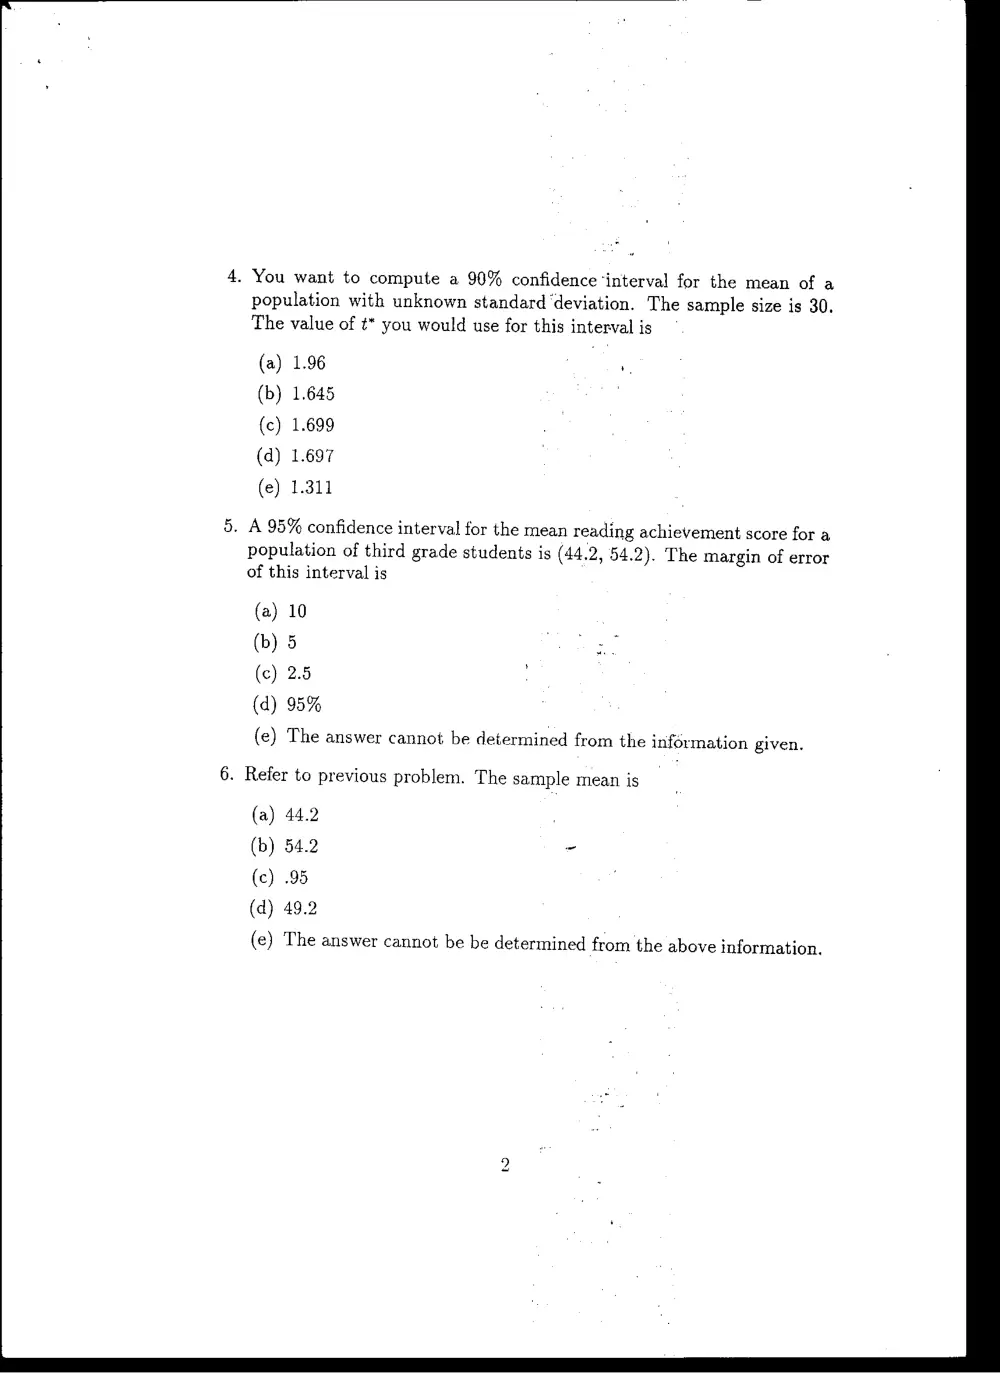
. You want to compute a 90% confidence ‘interval for the mean of a
population with unknown standard ‘deviation. The sample size is 30.
The value of t* you would use for this interval is
1.96 ; .
. A 95% confidence interval for the mean reading achievement score for a
population of third grade students is (44.2, 54.2). The margin of error
of this interval is
(a) 10
(b) 5 a
(c) 2.5
(d) 95%
(e) The answer cannot be determined from the information given.
. Refer to previous problem. The sample mean is
(a) 44.2
(b) 54.2 -
(c) .95
(d) 49.2
(e) The answer cannot be be determined from the above information,
to
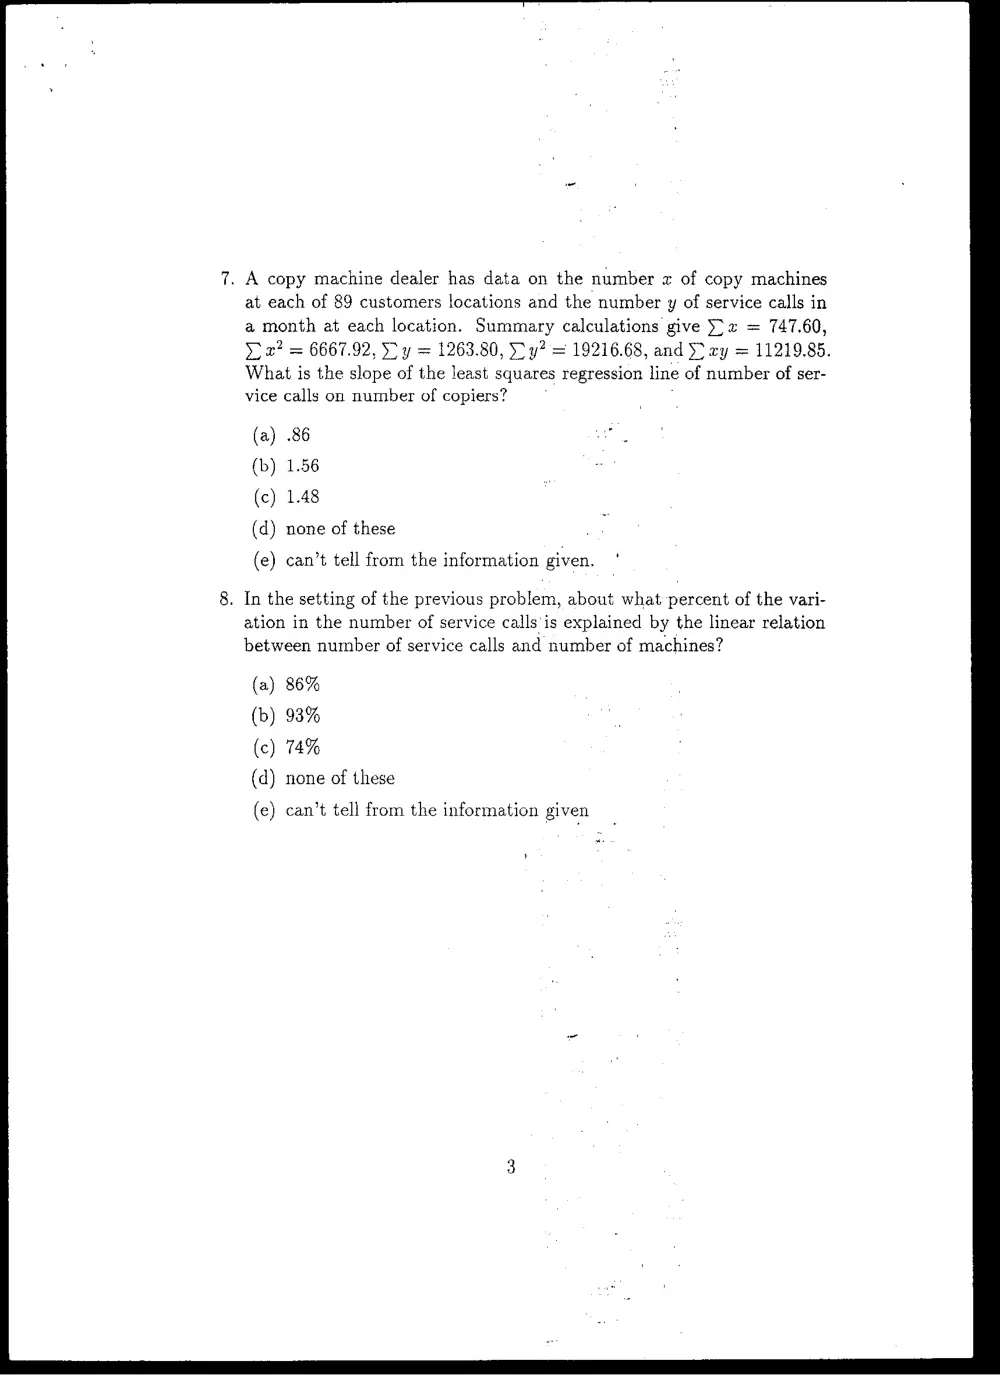
7. A copy machine dealer has data on the number z of copy machines
at each of 89 customers locations and the number y of service calls in
a month at each location. Summary calculations give 2 = 747.60,
yx? = 6667.92, © y = 1263.80, Sy? = 19216.68, and 3° zy = 11219.85.
What is the slope of the least squares regression line of number of ser-
vice calls on number of copiers? . .
none of these
e) can’t tell from the information given.
. In the setting of the previous problem, about what percent of the vari-
ation in the number of service calls'is explained by the linear relation
between number of service calls and number of machines?
'
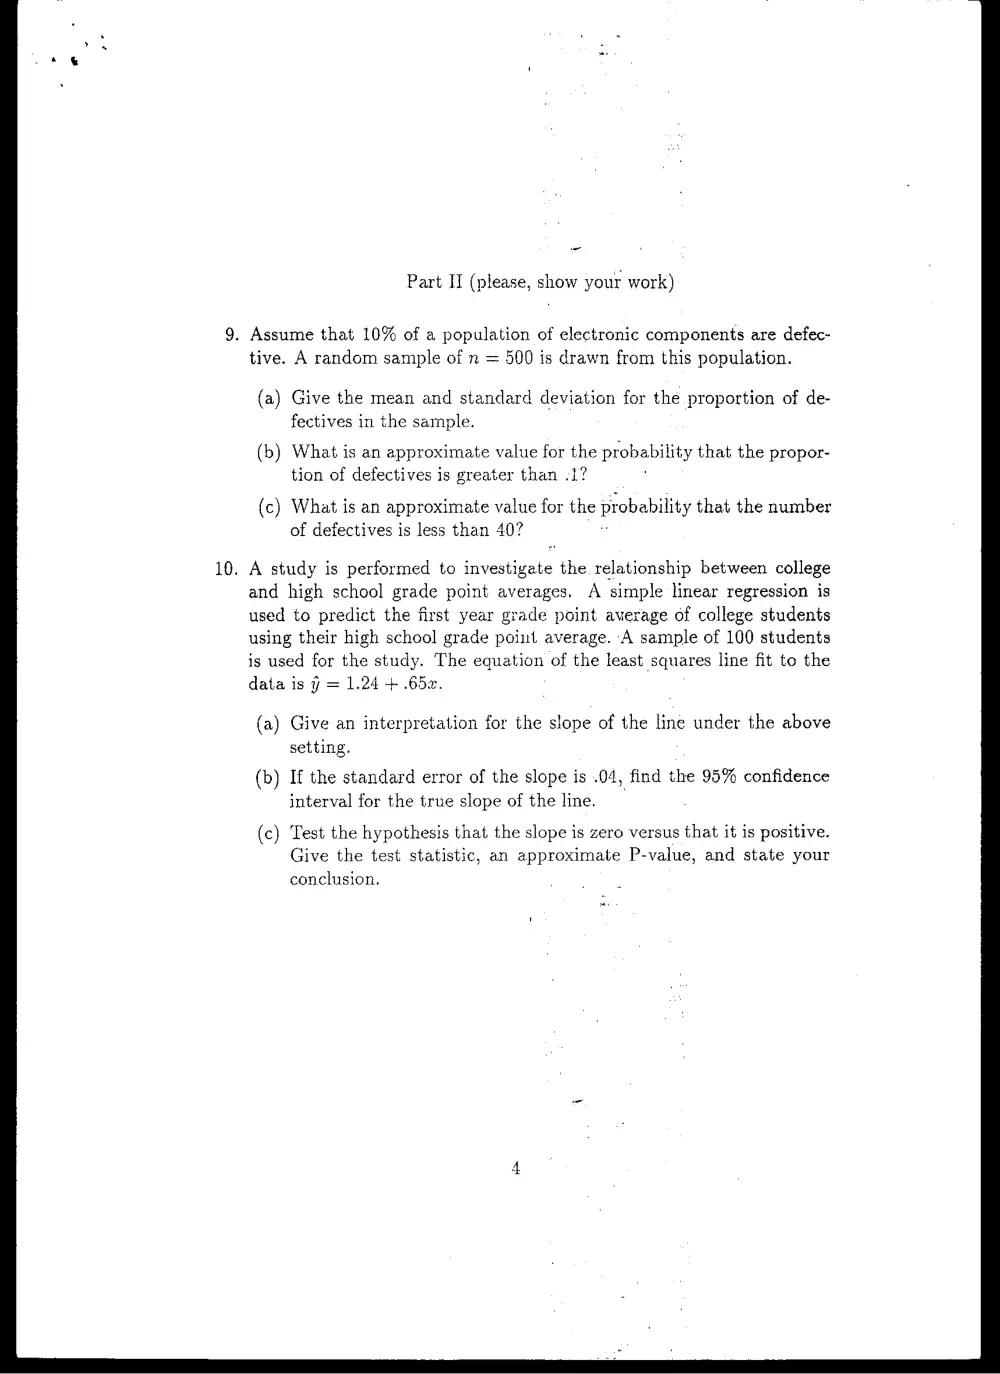
Part II (please, show your work)
9. Assume that 10% of a population of electronic components are defec-
tive. A random sample of n = 500 is drawn from this population.
(a) Give the mean and standard deviation for the proportion of de-
fectives in the sample.
(b) What is an approximate value for the probability that the propor-
tion of defectives is greater than -1?
(c) What is an approximate value for the probability that the number
of defectives is less than 40?
10. A study is performed to investigate the. relationship between college
and high school grade point averages. A simple linear regression is
used to predict the first year grade point average of college students
using their high school grade point average. A sample of 100 students
is used for the study. The equation of the least squares line fit to the
data is 7 = 1.24 + .652.
(a) Give an interpretation for the slope of the line under the above
setting.
(b) If the standard error of the slope is .04, find the 95% confidence
interval for the true slope of the line.
(c) Test the hypothesis that the slope is zero versus that it is positive.
Give the test statistic, an approximate P-value, and state your
conclusion.