
STAT 210 Lecture, Fall 2010
American University of Beirut · Elementary Statistics for the Sciences · 1 page
Stuck on a question? A tutor can walk you through it.
More STAT 210 files
Show the text of this lab
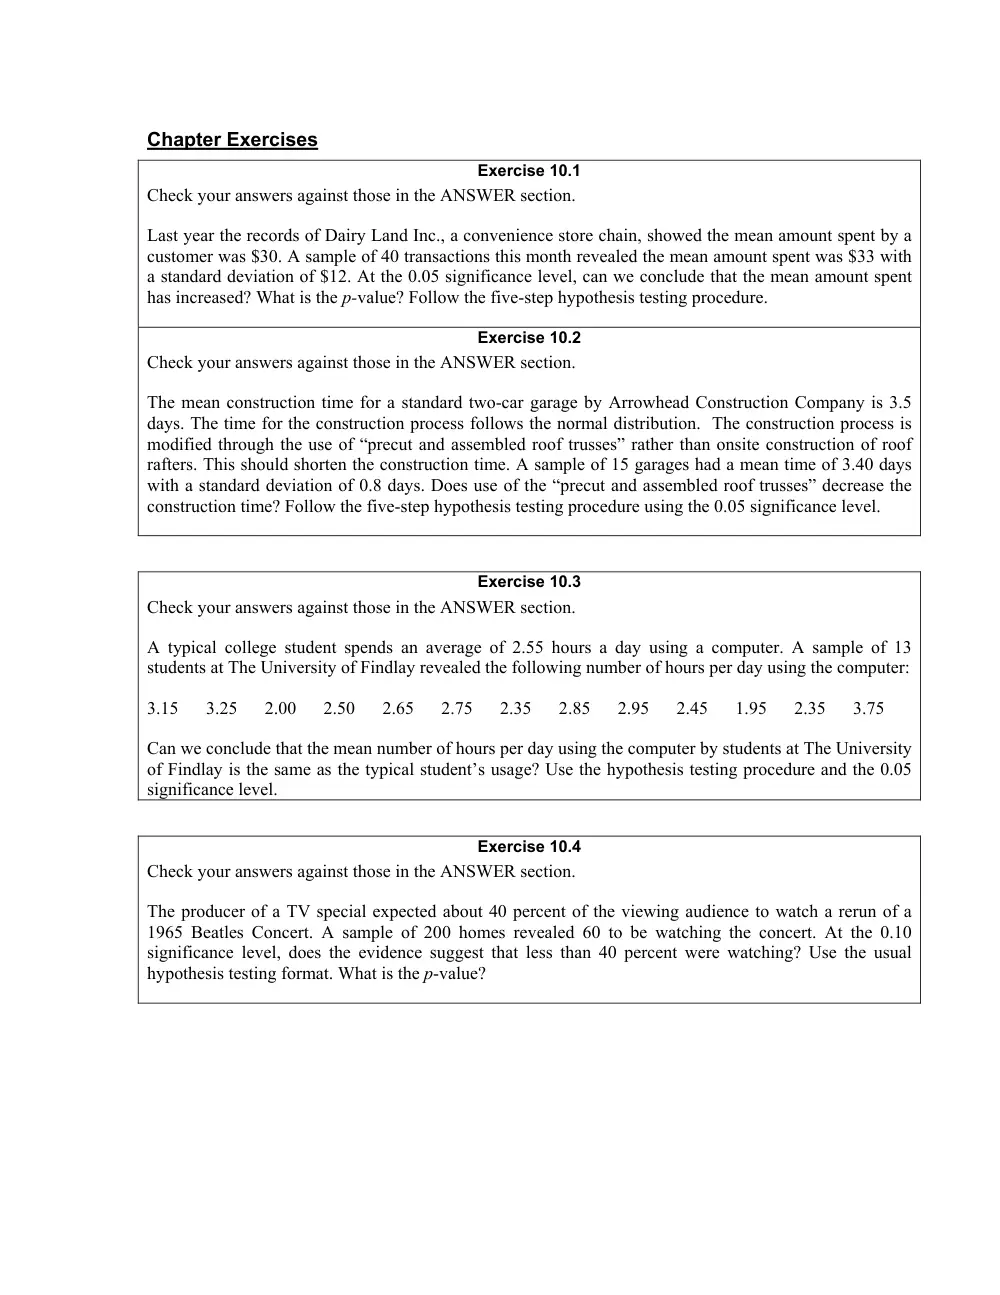
Chapter Exercises
Exercise 10.1
Check your answers against those in the ANSWER section.
Last year the records of Dairy Land Inc., a convenience store chain, showed the mean amount spent by a
customer was $30. A sample of 40 transactions this month revealed the mean amount spent was $33 with
a standard deviation of $12. At the 0.05 significance level, can we conclude that the mean amount spent
has increased? What is the p-value? Follow the five-step hypothesis testing procedure.
Exercise 10.2
Check your answers against those in the ANSWER section.
The mean construction time for a standard two-car garage by Arrowhead Construction Company is 3.5
days. The time for the construction process follows the normal distribution. The construction process is
modified through the use of “precut and assembled roof trusses” rather than onsite construction of roof
rafters. This should shorten the construction time. A sample of 15 garages had a mean time of 3.40 days
with a standard deviation of 0.8 days. Does use of the “precut and assembled roof trusses” decrease the
construction time? Follow the five-step hypothesis testing procedure using the 0.05 significance level.
Exercise 10.3
Check your answers against those in the ANSWER section.
A typical college student spends an average of 2.55 hours a day using a computer. A sample of 13
students at The University of Findlay revealed the following number of hours per day using the computer:
3.15
3.25
2.00
2.50
2.65
2.75
2.35
2.85
2.95
2.45
1.95
2.35
3.75
Can we conclude that the mean number of hours per day using the computer by students at The University
of Findlay is the same as the typical student’s usage? Use the hypothesis testing procedure and the 0.05
significance level.
Exercise 10.4
Check your answers against those in the ANSWER section.
The producer of a TV special expected about 40 percent of the viewing audience to watch a rerun of a
1965 Beatles Concert. A sample of 200 homes revealed 60 to be watching the concert. At the 0.10
significance level, does the evidence suggest that less than 40 percent were watching? Use the usual
hypothesis testing format. What is the p-value?