
STAT 210 Lecture, Spring 2011
American University of Beirut · Elementary Statistics for the Sciences · 2 pages

More STAT 210 files
Show the text of this lab
Chapter Exercises
Exercise 8.1
Check your answers against those in the ANSWER section.
Refer to Problem One and the advertisers in the “Coupon Section” of the Fort Walton
Beach/Destin Florida phone directory. Use Appendix E – Table of Random Numbers.
a. Pick a sample of five advertisers. Start with row six and column six. The number is 84822.
Use the first two numbers starting with 84.
b. Randomly select a second sample of five advertisers starting at the bottom right corner of the
table. The number is 70603. Use the far right two digits starting with 03.
c. Randomly select a sample that consists of every fourth advertiser starting with 03.
d. Select a sample of four advertisers so that one of each type of advertiser is included. Start at
the top of column two. The number is 08182. Use the left two digits starting with 08.
Exercise 8.2
Check your answers against those in the ANSWER section.
The real estate company of Kuhlman and Associates has five sales people. Listed below is the number of
homes sold last month by each of the five associates. Bruce Kuhlman, the owner, wants to estimate the
population mean number of homes sold based on samples of three.
Associate
Number of Homes Sold
A. Sue Klaus
6
B. John Bardo
2
C. Jean Cannon
5
D. A.J.Kemper
9
E. Carol Ford
3
a. If samples of size 3 are selected, how many different samples are possible?
b. List the various samples and compute the mean of each.
c. Develop a sampling distribution of the means.
d. Draw graphs to compare the variability of the sampling distribution of the mean with that of the
population.
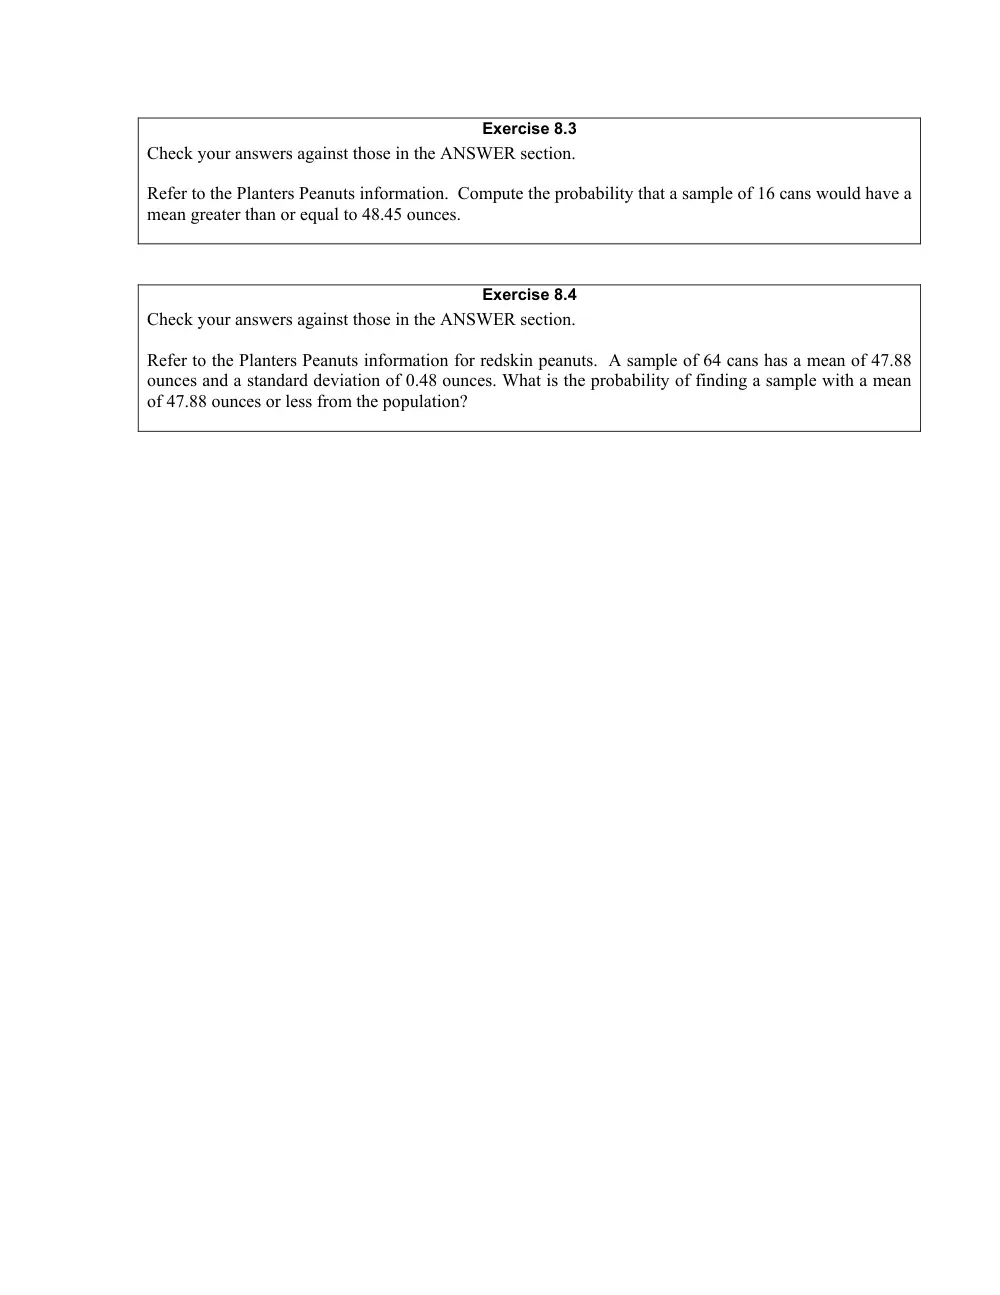
Exercise 8.3
Check your answers against those in the ANSWER section.
Refer to the Planters Peanuts information. Compute the probability that a sample of 16 cans would have a
mean greater than or equal to 48.45 ounces.
Exercise 8.4
Check your answers against those in the ANSWER section.
Refer to the Planters Peanuts information for redskin peanuts. A sample of 64 cans has a mean of 47.88
ounces and a standard deviation of 0.48 ounces. What is the probability of finding a sample with a mean
of 47.88 ounces or less from the population?