
ECO 201 Chapter 2, Fall 2016
Lebanese American University · Microeconomics · 30 pages · Dr. Saifedean Ammous

Showing the first 10 of 30 pages. Download the PDF to see all of it.
More ECO 201 files
Show the text of this chapter
1 of 32
2 of 32
© 2014 Pearson Education, Inc.
3 of 32
© 2014 Pearson Education, Inc.
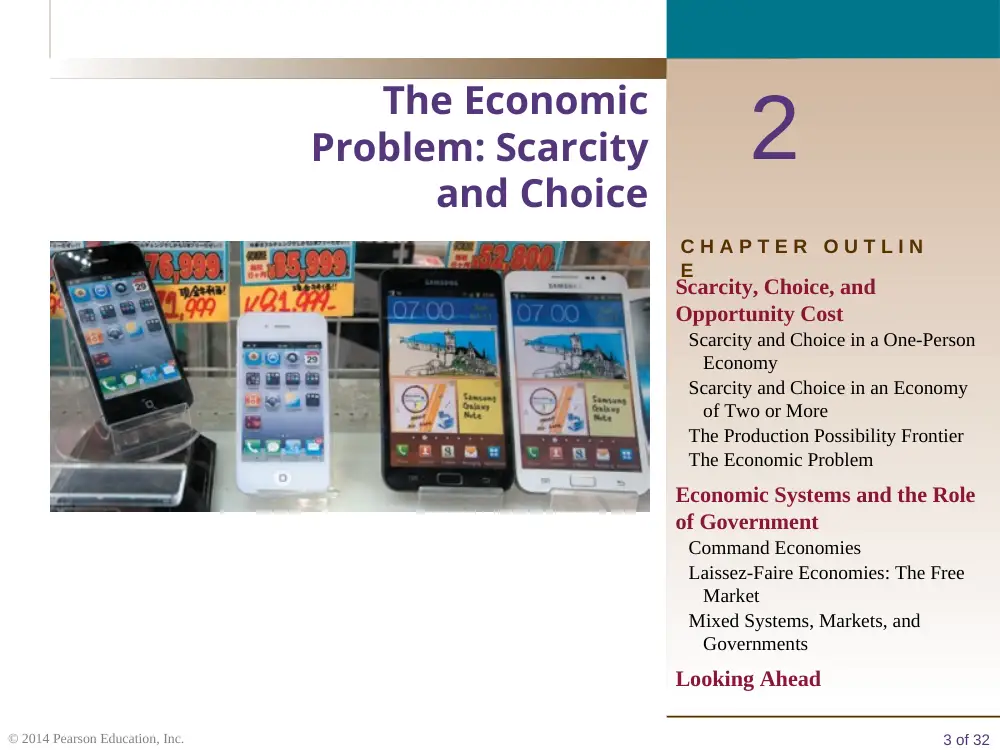
C H A P T E R O U T L I N
E
2
The Economic
Problem: Scarcity
and Choice
Scarcity, Choice, and
Opportunity Cost
Scarcity and Choice in a One-Person
Economy
Scarcity and Choice in an Economy
of Two or More
The Production Possibility Frontier
The Economic Problem
Economic Systems and the Role
of Government
Command Economies
Laissez-Faire Economies: The Free
Market
Mixed Systems, Markets, and
Governments
Looking Ahead
4 of 32
© 2014 Pearson Education, Inc.
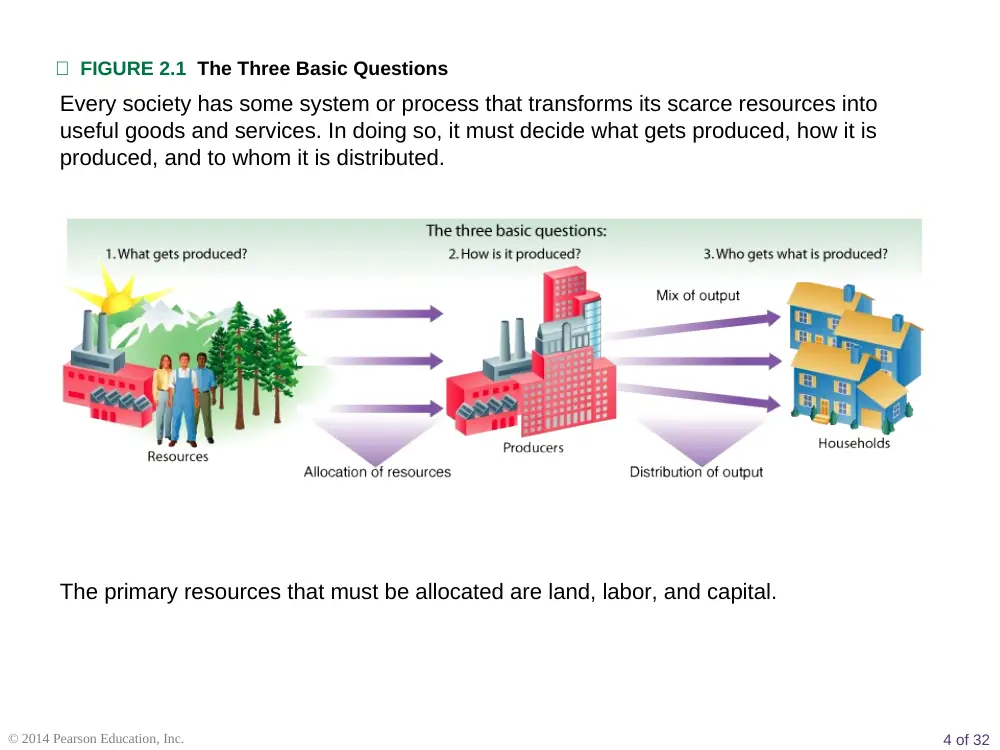
FIGURE 2.1 The Three Basic Questions
Every society has some system or process that transforms its scarce resources into
useful goods and services. In doing so, it must decide what gets produced, how it is
produced, and to whom it is distributed.
The primary resources that must be allocated are land, labor, and capital.
5 of 32
© 2014 Pearson Education, Inc.
capital Things that are produced and then used in the production of other
goods and services.
factors of production (or factors) The inputs into the process of production.
Another term for resources.
production The process that transforms scarce resources into useful goods
and services.
inputs or resources Anything provided by nature or previous generations that
can be used directly or indirectly to satisfy human wants.
outputs Goods and services of value to households.
6 of 32
© 2014 Pearson Education, Inc.
Nearly all the same basic decisions that characterize complex economies must
also be made in a simple economy.
Scarcity, Choice, and Opportunity Cost
Scarcity and Choice in a One-Person Economy
7 of 32
© 2014 Pearson Education, Inc.
The concepts of constrained choice and scarcity are central to the discipline
of economics.
opportunity cost The best alternative that we give up, or forgo, when we
make a choice or decision.
Opportunity Cost
8 of 32
© 2014 Pearson Education, Inc.
theory of comparative advantage Ricardo’s theory that specialization and
free trade will benefit all trading parties, even those that may be “absolutely”
more efficient producers.
Scarcity and Choice in an Economy of Two or More
Specialization, Exchange, and Comparative Advantage
absolute advantage A producer has an absolute advantage over another in
the production of a good or service if he or she can produce that product using
fewer resources (a lower absolute cost per unit).
comparative advantage A producer has a comparative advantage over
another in the production of a good or service if he or she can produce that
product at a lower opportunity cost.
9 of 32
© 2014 Pearson Education, Inc.
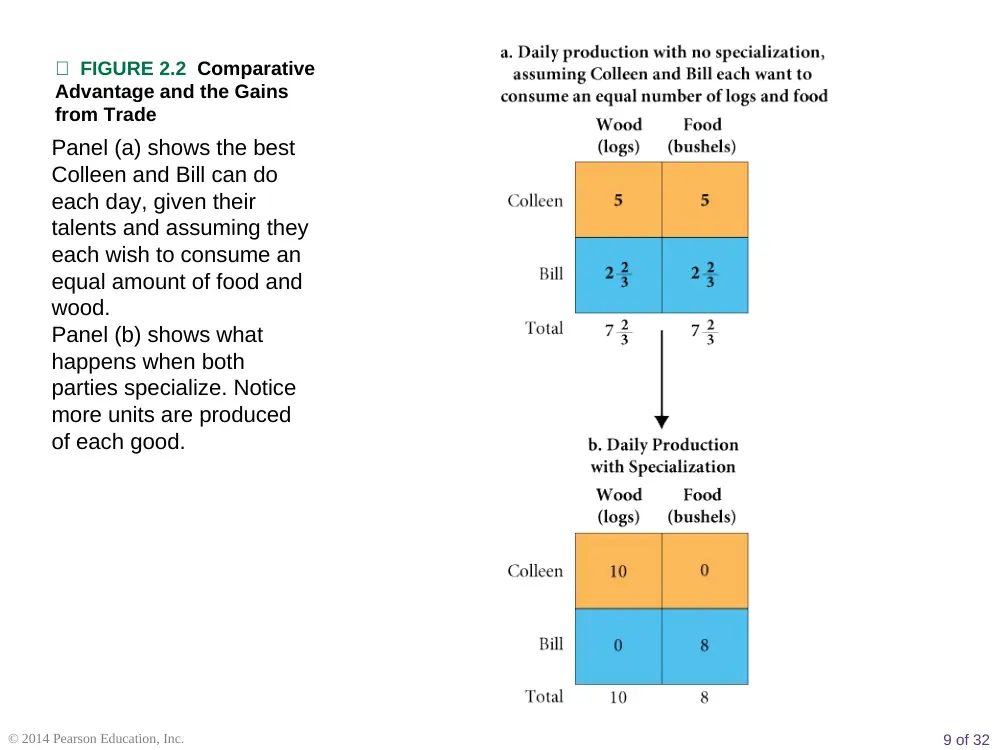
FIGURE 2.2 Comparative
Advantage and the Gains
from Trade
Panel (a) shows the best
Colleen and Bill can do
each day, given their
talents and assuming they
each wish to consume an
equal amount of food and
wood.
Panel (b) shows what
happens when both
parties specialize. Notice
more units are produced
of each good.
10 of 32
© 2014 Pearson Education, Inc.
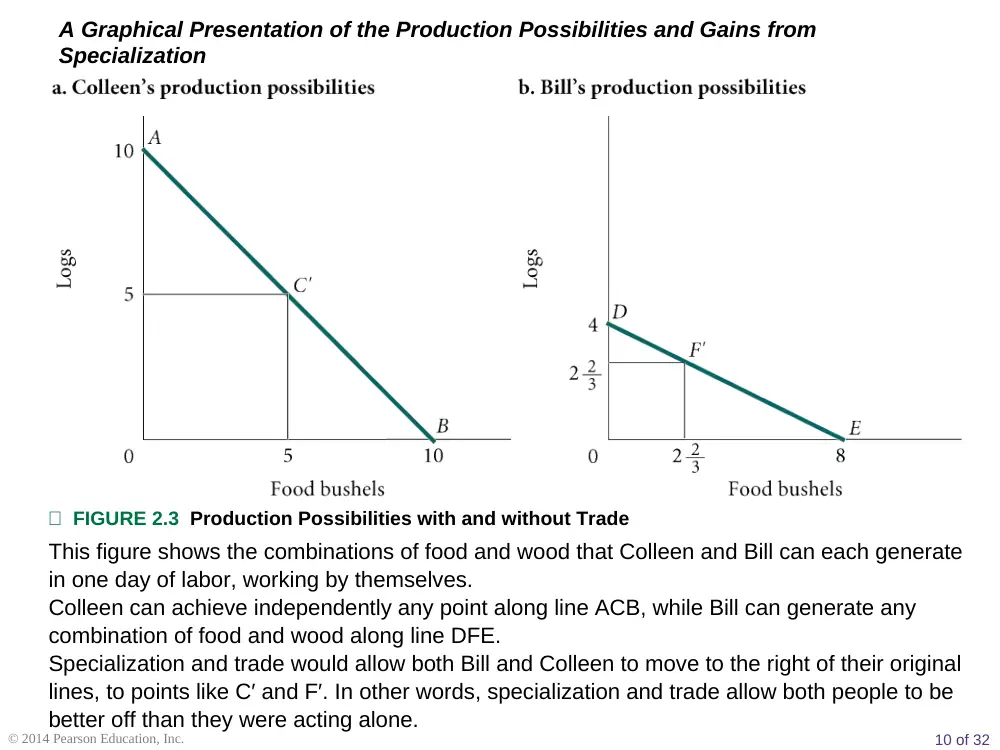
FIGURE 2.3 Production Possibilities with and without Trade
This figure shows the combinations of food and wood that Colleen and Bill can each generate
in one day of labor, working by themselves.
Colleen can achieve independently any point along line ACB, while Bill can generate any
combination of food and wood along line DFE.
Specialization and trade would allow both Bill and Colleen to move to the right of their original
lines, to points like C′ and F′. In other words, specialization and trade allow both people to be
better off than they were acting alone.
A Graphical Presentation of the Production Possibilities and Gains from
Specialization
11 of 32
© 2014 Pearson Education, Inc.
We trade off present and future benefits in small ways all the time.
Weighing Present and Expected Future Costs and Benefits
Capital Goods and Consumer Goods
consumer goods Goods produced for present consumption.
investment The process of using resources to produce new capital.
12 of 32
© 2014 Pearson Education, Inc.
production possibility frontier (ppf) A graph that shows all the combinations
of goods and services that can be produced if all of society’s resources are
used efficiently.
The Production Possibility Frontier
13 of 32
© 2014 Pearson Education, Inc.
All points below and to the left
of the curve (the shaded area)
represent combinations of
capital and consumer goods
that are possible for the society
given the resources available
and existing technology.
Points above and to the right of
the curve, such as point G,
represent combinations that
cannot be reached.
If an economy were to end up
at point A on the graph, it would
be producing no consumer
goods at all; all resources
would be used for the
production of capital.
If an economy were to end up
at point B, it would produce
only consumer goods.
14 of 32
© 2014 Pearson Education, Inc.
Although an economy may be
operating with full employment
of its land, labor, and capital
resources, it may still be
operating inside its ppf, at a
point such as D. The economy
could be using those resources
inefficiently.
Periods of unemployment also
correspond to points inside the
ppf, such as point D.
Moving onto the frontier from a
point such as D means
achieving full employment of
resources.
15 of 32
© 2014 Pearson Education, Inc.
FIGURE 2.4 Production
Possibility Frontier
The ppf illustrates a number
of economic concepts.
One of the most important is
opportunity cost.
The opportunity cost of
producing more capital
goods is fewer consumer
goods.
Moving from E to F, the
number of capital goods
increases from 550 to 800,
but the number of consumer
goods decreases from 1,300
to 1,100.
16 of 32
© 2014 Pearson Education, Inc.
marginal rate of transformation (MRT) The slope of the production
possibility frontier (ppf).
Negative Slope and Opportunity Cost
17 of 32
© 2014 Pearson Education, Inc.
TABLE 2.1 Production Possibility Schedule
for Total Corn and Wheat
Production in Ohio and Kansas
Point
on ppf
Total
Corn Production
(Millions of
Bushels per Year)
Total
Wheat Production
(Millions of
Bushels per Year)
A
700
100
B
650
200
C
510
380
D
400
500
E
300
550
FIGURE 2.5 Corn and Wheat Production in Ohio and Kansas
The ppf illustrates that the opportunity cost of corn production increases as we shift
resources from wheat production to corn production. Moving from point E to D, we
get an additional 100 million bushels of corn at a cost of 50 million bushels of wheat.
Moving from point B to A, we get only 50 million bushels of corn at a cost of 100
million bushels of wheat. The cost per bushel of corn—measured in lost wheat—
has increased.
The Law of Increasing Opportunity Cost
18 of 32
© 2014 Pearson Education, Inc.
During economic downturns or recessions, industrial plants run at less than
their total capacity. When there is unemployment of labor and capital, we are
not producing all that we can.
Unemployment
Waste and mismanagement are the results of a firm operating below its
potential.
Sometimes inefficiency results from mismanagement of the economy instead of
mismanagement of individual private firms.
Inefficiency
19 of 32
© 2014 Pearson Education, Inc.
FIGURE 2.6 Inefficiency from
Misallocation of Land in Farming
Society can end up inside its
ppf at a point such as A by
using its resources
inefficiently.
If, for example, Ohio’s climate
and soil were best-suited for
corn production and those of
Kansas were best suited for
wheat production, a law
forcing Kansas farmers to
produce corn and Ohio
farmers to produce wheat
would result in less of both. In
such a case, society might be
at point A instead of point B.
20 of 32
© 2014 Pearson Education, Inc.
To be efficient, an economy must produce what people want.
The Efficient Mix of Output
economic growth An increase in the total output of an economy. Growth
occurs when a society acquires new resources or when it learns to produce
more using existing resources.
Economic Growth
21 of 32
© 2014 Pearson Education, Inc.
TABLE 2.2 Increasing Productivity in Corn and Wheat Production
in the United States, 1935–2009
Corn
Wheat
Yield per Acre
(Bushels)
Labor Hours per
100 Bushels
Yield per Acre
(Bushels)
Labor Hours
per 100 Bushels
1935–1939
1945–1949
1955–1959
1965–1969
1975–1979
1981–1985
1985–1990
1990–1995
1998
2001
2006
2007
2008
2009
26.1
36.1
48.7
78.5
95.3
107.2
112.8
120.6
134.4
138.2
145.6
152.8
153.9
164.9
108
53
20
7
4
3
NAa
NAa
NAa
NAa
NAa
NAa
NAa
NAa
13.2
16.9
22.3
27.5
31.3
36.9
38.0
38.1
43.2
43.5
42.3
40.6
44.9
44.3
67
34
17
11
9
7
NAa
NAa
NAa
NAa
NAa
NAa
NAa
NAa
a Data not available.
22 of 32
© 2014 Pearson Education, Inc.
FIGURE 2.7 Economic Growth
Shifts the PPF Up and to the Right
Productivity increases have
enhanced the ability of the United
States to produce both corn and
wheat.
As Table 2.2 shows, productivity
increases were more dramatic for
corn than for wheat. Thus, the
shifts in the ppf were not parallel.
Note: The ppf also shifts if the amount
of land or labor in corn and wheat
production changes. Although we
emphasize productivity increases
here, the actual shifts between years
were due in part to land and labor
changes.
23 of 32
© 2014 Pearson Education, Inc.
FIGURE 2.8 Capital Goods and
Growth in Poor and Rich
Countries
Rich countries find it easier
than poor countries to devote
resources to the production
of capital, and the more
resources that flow into
capital production, the faster
the rate of economic growth.
Thus, the gap between poor
and rich countries has grown
over time.
Sources of Growth and the Dilemma of Poor Countries
24 of 32
© 2014 Pearson Education, Inc.
Recall the three basic questions facing all economic systems:
(1) What gets produced?
(2) How is it produced?
(3) Who gets it?
Given scarce resources, how do large, complex societies go about
answering the three basic economic questions?
The Economic Problem
25 of 32
© 2014 Pearson Education, Inc.
command economy An economy in which a central government either
directly or indirectly sets output targets, incomes, and prices.
Economic Systems and the Role of Government
Command Economies
Laissez-Faire Economies: The Free Market
laissez-faire economy Literally from the French: “allow [them] to do.” An
economy in which individual people and firms pursue their own self-interest
without any central direction or regulation.
market The institution through which buyers and sellers interact and engage in
exchange.
Some markets are simple and others are complex, but they all involve
buyers and sellers engaging in exchange.
The behavior of buyers and sellers in a laissez-faire economy determines
what gets produced, how it is produced, and who gets it.
26 of 32
© 2014 Pearson Education, Inc.
consumer sovereignty The idea that consumers ultimately dictate what will
be produced (or not produced) by choosing what to purchase (and what not to
purchase).
Consumer Sovereignty
Individual Production Decisions: Free Enterprise
free enterprise The freedom of individuals to start and operate private
businesses in search of profits.
27 of 32
© 2014 Pearson Education, Inc.
The amount that any one household gets depends on its income and wealth.
Income is the amount that a household earns each year. It comes in a number
of forms: wages, salaries, interest, and the like.
Wealth is the amount that households have accumulated out of past income
through saving or inheritance.
Distribution of Output
28 of 32
© 2014 Pearson Education, Inc.
In a free market system, the basic economic questions are answered without
the help of a central government plan or directives. This is what the “free” in
free market means—the system is left to operate on its own with no outside
interference. Individuals pursuing their own self-interest will go into business
and produce the products and services that people want. Other individuals will
decide whether to acquire skills; whether to work; and whether to buy, sell,
invest, or save the income that they earn.
The basic coordinating mechanism is price.
Price Theory
The differences between command economies and laissez-faire economies in
their pure forms are enormous. In fact, these pure forms do not exist in the
world; all real systems are in some sense “mixed.”
Mixed Systems, Markets, and Governments
29 of 32
© 2014 Pearson Education, Inc.
This chapter described the economic problem in broad terms. We outlined the
questions that all economic systems must answer. We also discussed very
broadly the two kinds of economic systems. In the next chapter, we analyze the
way market systems work.
Looking Ahead
30 of 32
© 2014 Pearson Education, Inc.
absolute advantage
capital
command economy
comparative advantage
consumer goods
consumer sovereignty
economic growth
factors of production (or factors)
free enterprise
inputs or resources
investment
laissez-faire economy
marginal rate of transformation (MRT)
market
opportunity cost
outputs
production
production possibility frontier (ppf)
theory of comparative advantage
R E V I E W T E R M S A N D C O N C E P T
S