
ECO 201 Problems Chapter 1, Fall 2013
Lebanese American University · Microeconomics · 4 pages · Ms. Sylvia Rebeiz


More ECO 201 files
Show the text of this chapter
Handout Chapter 1: Limits, Alternatives, and Choices
TEXTBOOK: QUESTIONS (1,5,7)
PROBLEM 1:
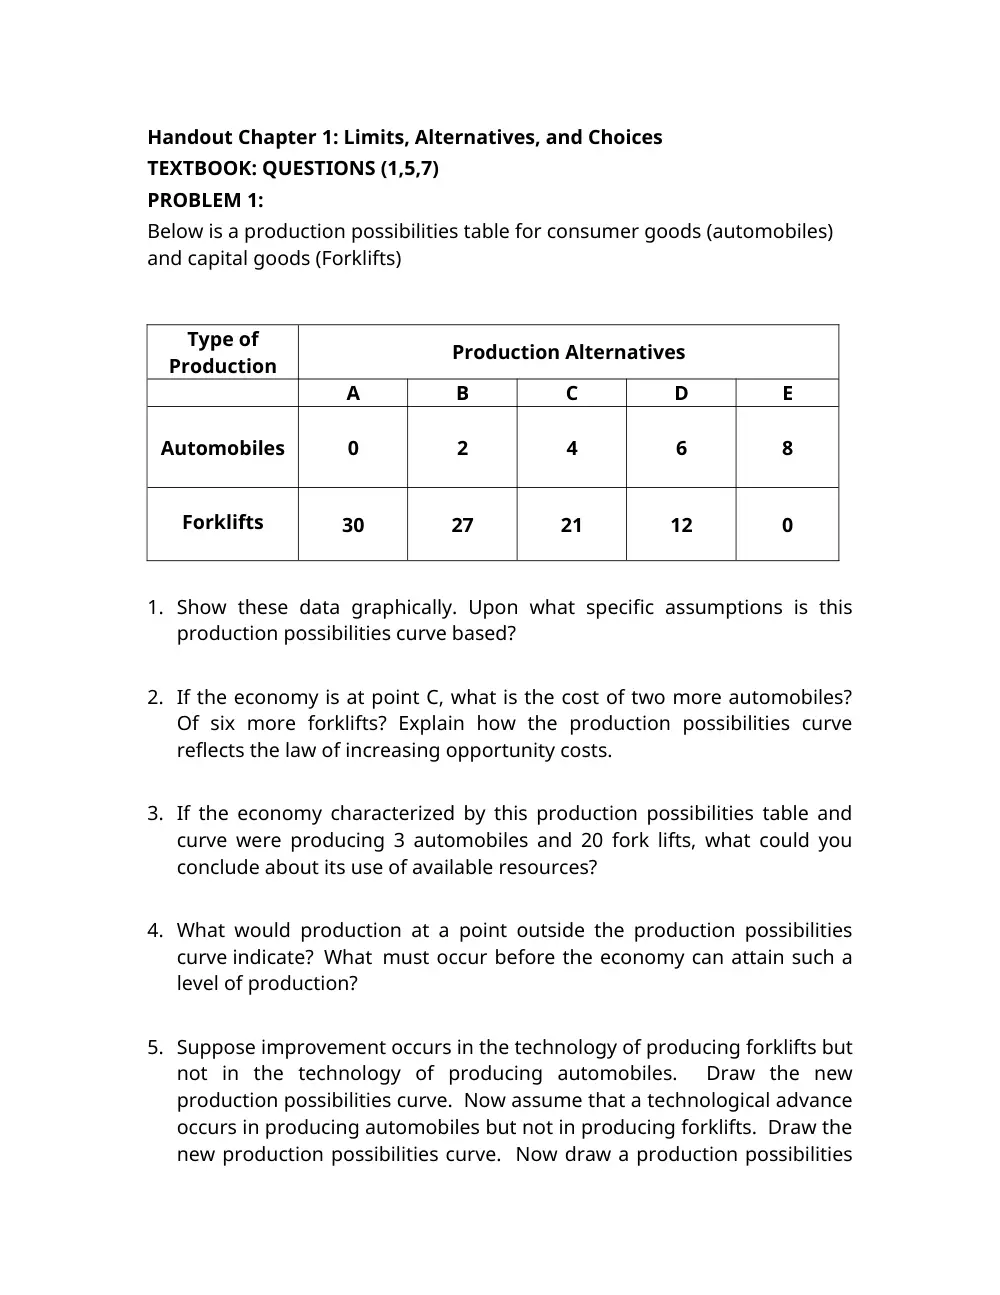
Below is a production possibilities table for consumer goods (automobiles)
and capital goods (Forklifts)
Type of
Production
Production Alternatives
A
B
C
D
E
Automobiles
0
2
4
6
8
Forklifts
30
27
21
12
0
1. Show these data graphically. Upon what specific assumptions is this
production possibilities curve based?
2. If the economy is at point C, what is the cost of two more automobiles?
Of six more forklifts? Explain how the production possibilities curve
reflects the law of increasing opportunity costs.
3. If the economy characterized by this production possibilities table and
curve were producing 3 automobiles and 20 fork lifts, what could you
conclude about its use of available resources?
4. What would production at a point outside the production possibilities
curve indicate? What must occur before the economy can attain such a
level of production?
5. Suppose improvement occurs in the technology of producing forklifts but
not in the technology of producing automobiles. Draw the new
production possibilities curve. Now assume that a technological advance
occurs in producing automobiles but not in producing forklifts. Draw the
new production possibilities curve. Now draw a production possibilities
curve that reflects technological improvement in the production of both
products.
6. Explain how (if at all) each of the following affects the location of a
country’s production possibilities curve:
a. The quality of education increases.
b. The number of unemployed workers increases.
c. A devastating earthquake destroys numerous production facilities.
PROBLEM 2:
The following data show the different combinations of coffee and cars that
can be produced by an economy, given a particular amount of resources,
and a particular state of technology. Draw the corresponding production
possibility frontier to answer the questions below:
Type of
Production
Production Alternatives
A
B
C
D
E
F
Coffee (tons)
100
80
60
40
20
0
Cars (units)
0
8
12
15
17
18
1. Given the production possibility frontier above, can the economy
produce the combination of 50 tons of coffee and 5 units of cars? What
does this combination suggest about the use of the resources? Are they
fully utilized?
2. Given the production possibility frontier above, can the economy
produce the combination of 80 tons of coffee and 12 units of cars, and
why?
3. What is the opportunity cost of increasing coffee production from 40 to
60 tons per year, assuming that resources are fully utilized?
4. What would be the cost of producing 3 additional units of cars if this
economy were currently producing 80 tons of coffee and 5 units of car?
Explain.
5. What would happen to the production possibility frontier if a new
production technique allows cars production to double? On the same
graph, draw the new production possibility frontier.
6. What would happen to the production possibility frontier, if the
resources available to the economy were to increase? Explain.
PROBLEM 3:
You can either spend Spring Break working for $80 per day for five days or
go to Italy for the week. If you stay home and work, your expenses will total
about $100. If you go to Italy, the airfare, hotel, food, and miscellaneous
expenses will be about $700. What’s your opportunity cost of going to Italy?