
EECE 442 Homework, Spring 2008
American University of Beirut · Communication Systems · 5 pages


More EECE 442 files
Show the text of this homework
EECEA4A = -_ Hanewort #2 sin
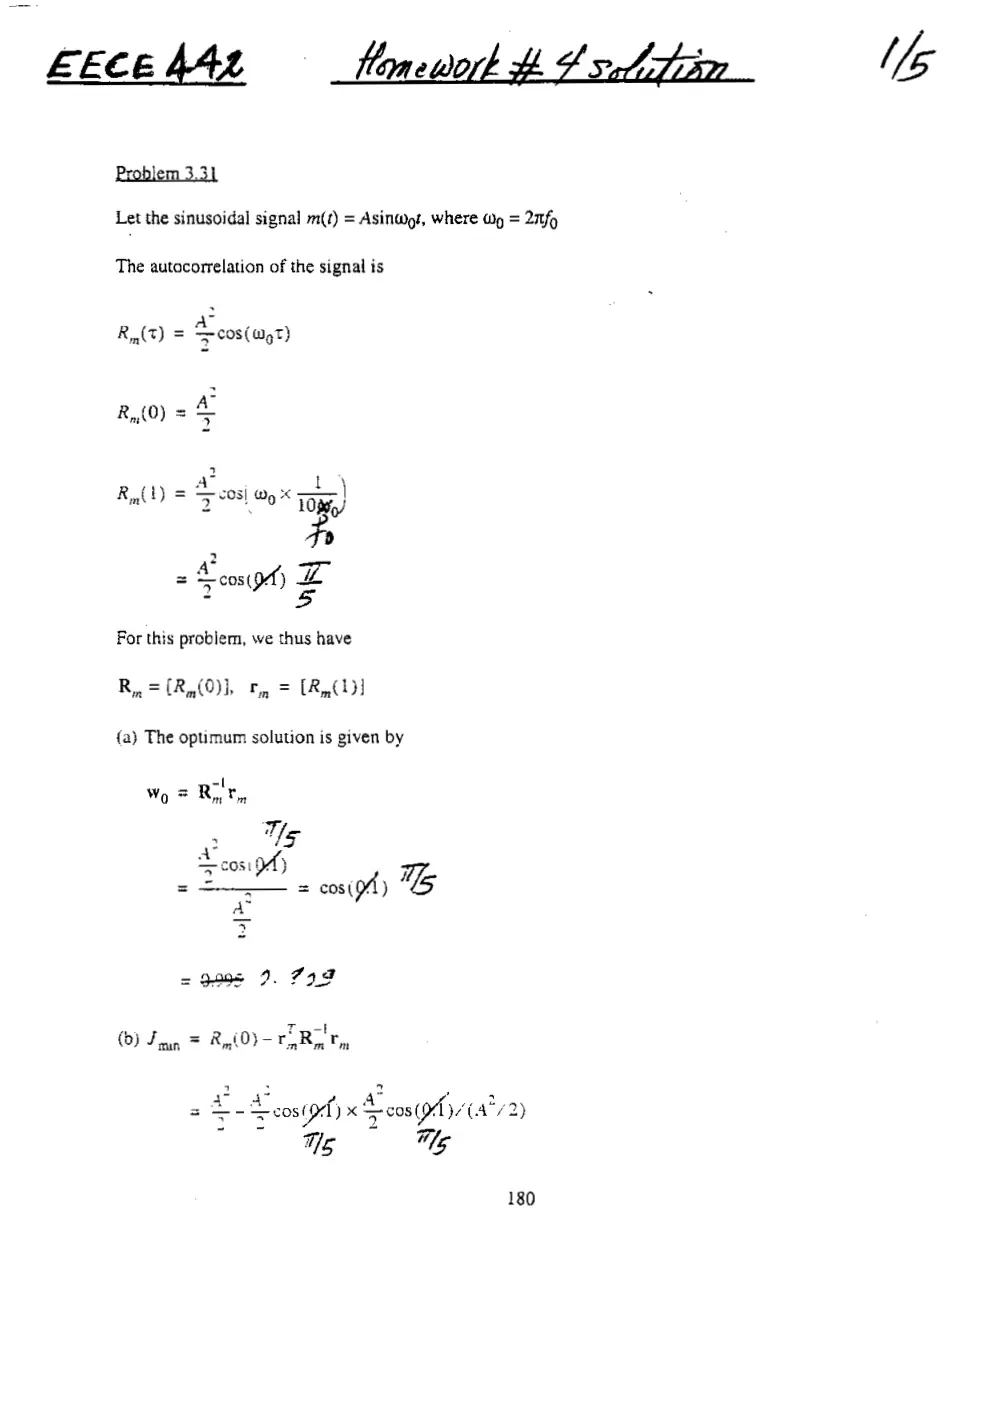
Problem 3.31}
Let the sinusoidal signal m(‘) = AsinWot, where Wp = 27f9
The autocorrelation of ihe signal is
R, (7) = © cos (apt)
A
R,,(0) = >
nye
Ry) = J OS! Wo * cra
fr
a“ T
= cosi 9) Ae
- 5
For this problem, we thus have
R, = (ROL fm = (Rad
{a} The optimum solution is given by
Wo = RF
il
2
u
Q
a
&
wN
Gy
. Tp-!
(0) Jug = &,,(0)-1 RP
mom
5 :
4A
->
tl
cos f) x © cos (pf y/(a°/2)
We Is
z
180
“5
Aa 2
= 51 -cos"(9f})
z
,_ Ss
= 2-605 A7
0.345 A”
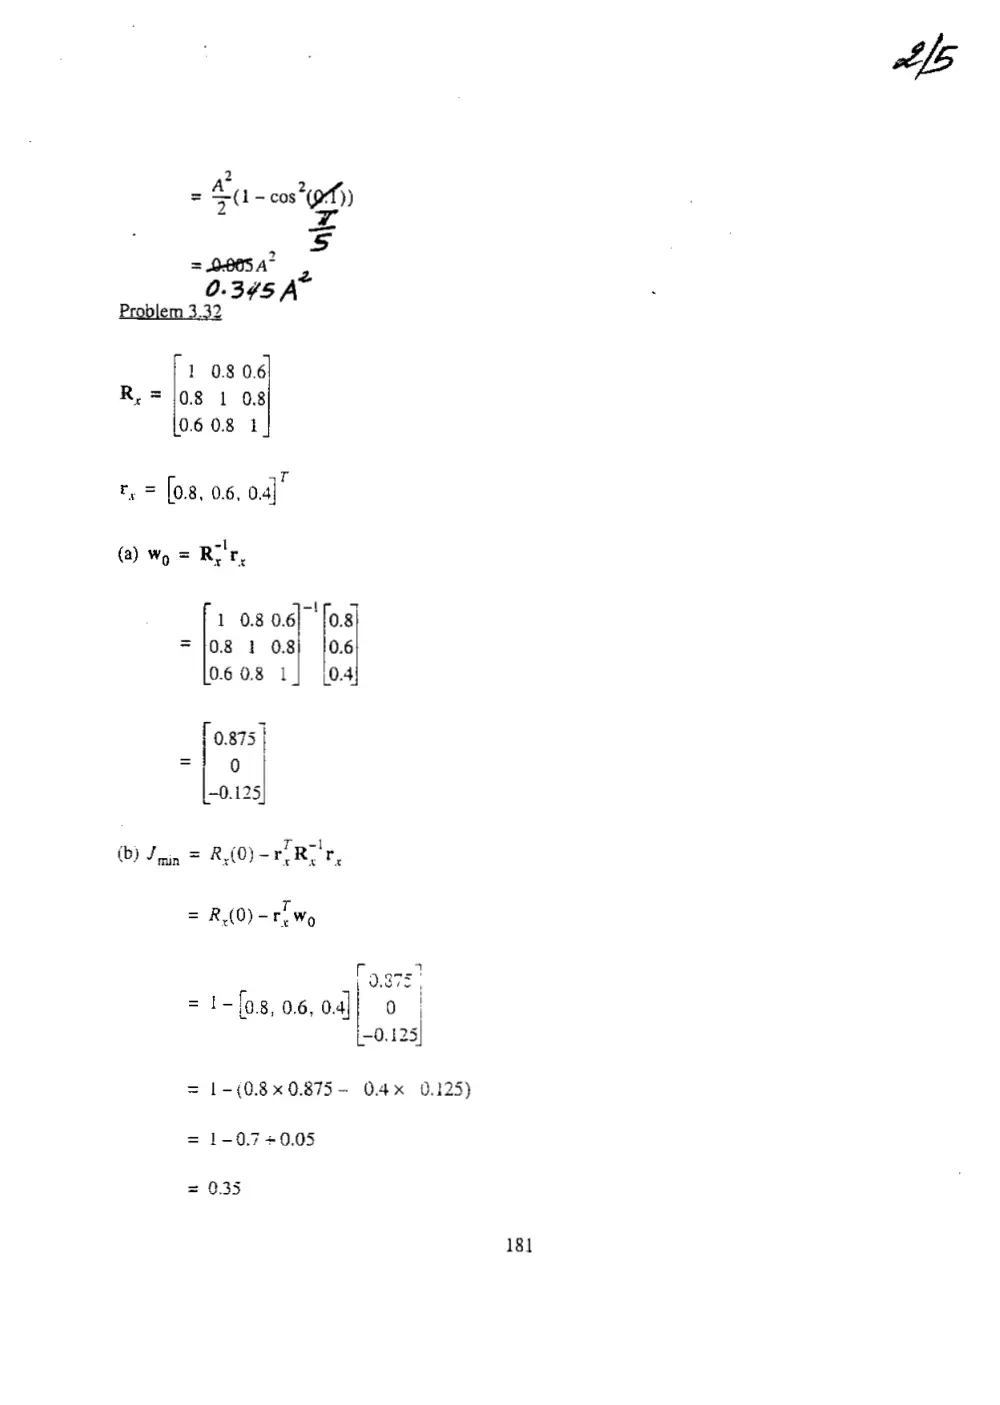
Problem 3.32
R=
x
1 08 06)
0.8 1 0.8
0.60.8 1
aT
= [0.8, 0.6, 0.4]
(a) Wo
(b) J
mn
il
-l
= Rr
xX
08 1 08} 106
10.608 1] [04
[0875]
0
0.125
P Ty-!
R{0) ~r, R, vr.
L
if}
r
R(0) -1, Wo
1-0.7 +0.05
0.35
r “Ip 3
1 0.8 06 bs
-
f
1-[o8, 0.6, 0.
io
2.975
-0.
0
12.
25
1-(0.8 x 0.875 ~ 04x 0.125)
181
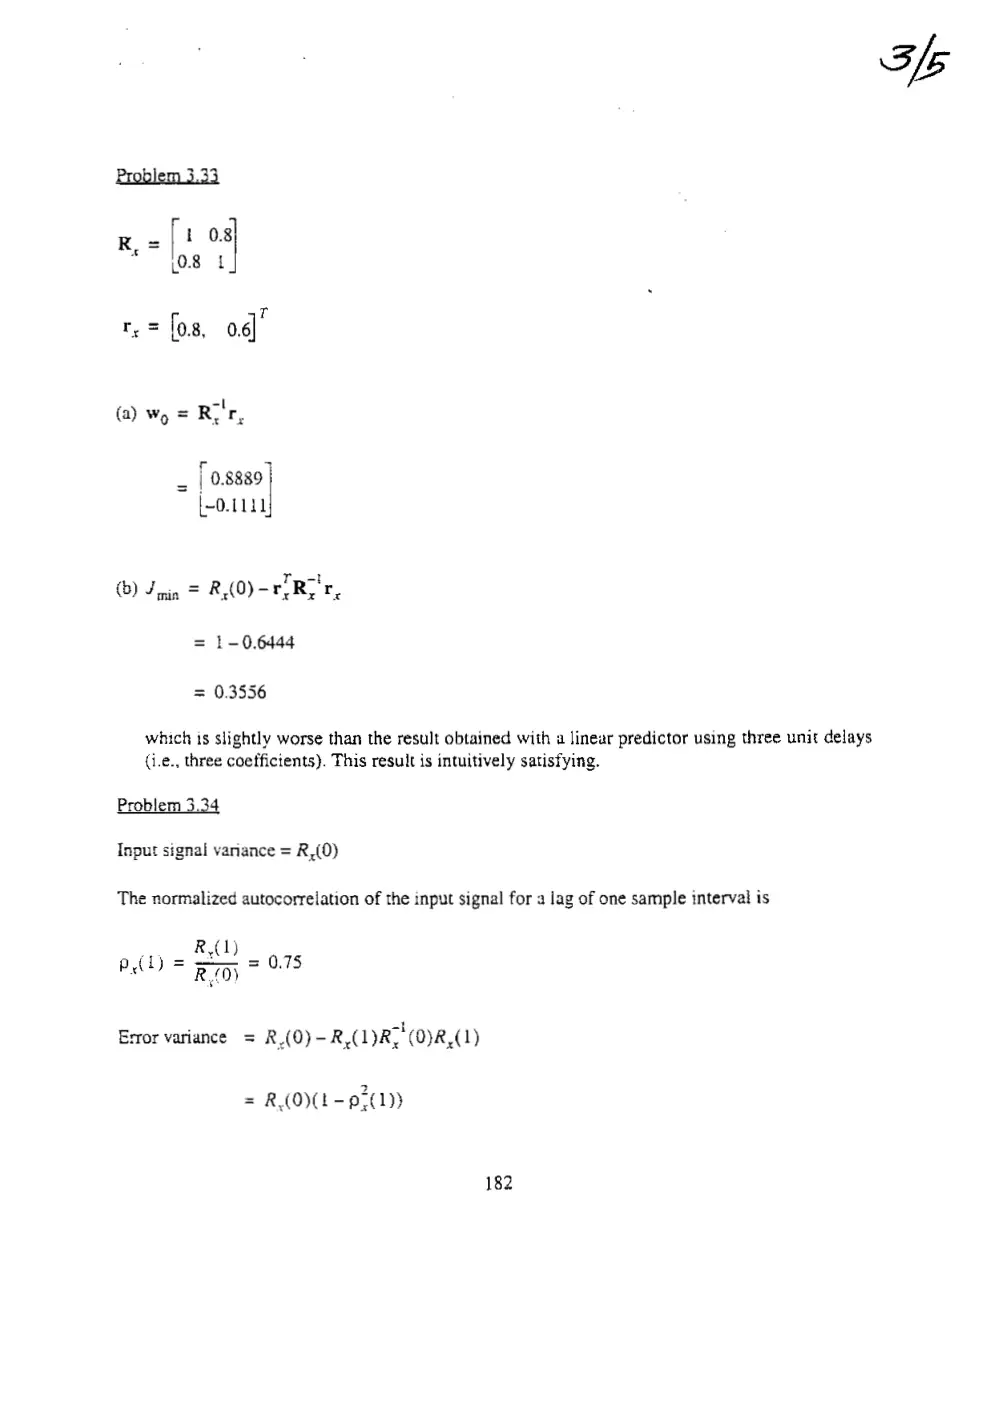
Problem 3
3]
K, = [3 a
10.8 I
T
r, = fos, 0.6]
(a) Wy = Ri'r
ul
() Jin = R,(0)- 1 RY'r,
1-0.6444
= 0.3556
which is slightly worse than the result obtained with a linear predictor using three unit delays
{i.e., three coefficients). This result is intuitively satisfying.
Problem 3.34
Input signal variance = R,(0)
The normalized autocorrelation of the input signal for a lag of one sample interval is
cL Rx) 0.75
pi) = Rio) 7°
‘
Error variance = R,(0)—R,(1)R,'(0)R,(1)
R(O)(L-92(1))
182
R,(0)
Processing gain. = ————~——___
R (0) - p,(1))
1
1- p21)
oe
i~(0.75)*
= 2.2857
Expressing the processing gain in dB, we have
LOlog ,9(2.2857) = 3.59 dB
Problem 3.35
R,(0
Processing gain = x(0)
f Ty-}.
coy 1— res fs
nen’ RO) |
(a) Three-tap predictor:
Processing gain = 2.8571
= 4.56 dB
(b) Two-tap predictor:
Processing gain = 2.8715
= 4.49 dB
Therefore, the use of a three-tap predictor in the DPCM system results an improvement of
4.56 - 4.49 = 0.07 dB over the corresponding system using a two-tap predictor.
Problem 3.36
(a) For DPCM, we have 10logi9(SNR)g = & + 6n dB
For PCM, we have 10logi9(SNR)o = 4.77 + 6n - 20log;g{log(1 + p))
where mis the number of quantization levels
SNR of DPCM
183
4(5
SNR = @ + 6n, where -3 < a < 15
For n=8, the SNR is in the range of 45 to 63 dBs.
SNR of PCM
SNR = 4.77 + 6n - 20logjq(log(2.56))
= 4.77 + 48 - 14.8783
= 38 dB
Therefore, the SNR improvement resulting from the use of DPCM is in the range of 7 to 25
dB.
(b) Let us assume that 7, bits/sample are used for DPCM and x bits/sample for PCM
If a = 15 dB, then we have
15 + 6n; = 6n - 10.0
10 + 15
6
Rearranging: (n-n,) =
= 4.18
which. in effect, represents a saving of about 4 bits/sample due to the use of DPCM.
Tf, on the other hand, we choose & = -3 dB, we have
-3 + On, =6n- 10
10-
a
Rearranging: (n~1,)
2
6
L.Ol
which represents a saving of about i bit/sample due to the use of DPCM.
184