
INDE 301 Lecture All Notes, Spring 2016
American University of Beirut · Engineering Economy · 125 pages



Showing the first 10 of 125 pages. Download the PDF to see all of it.
More INDE 301 files
Show the text of this notes
INDE 301
Engineering Economy
Effects of Inflation
Review and Examples
© 2012 by McGraw-Hill, New York, N.Y
Dr. N. Nehme
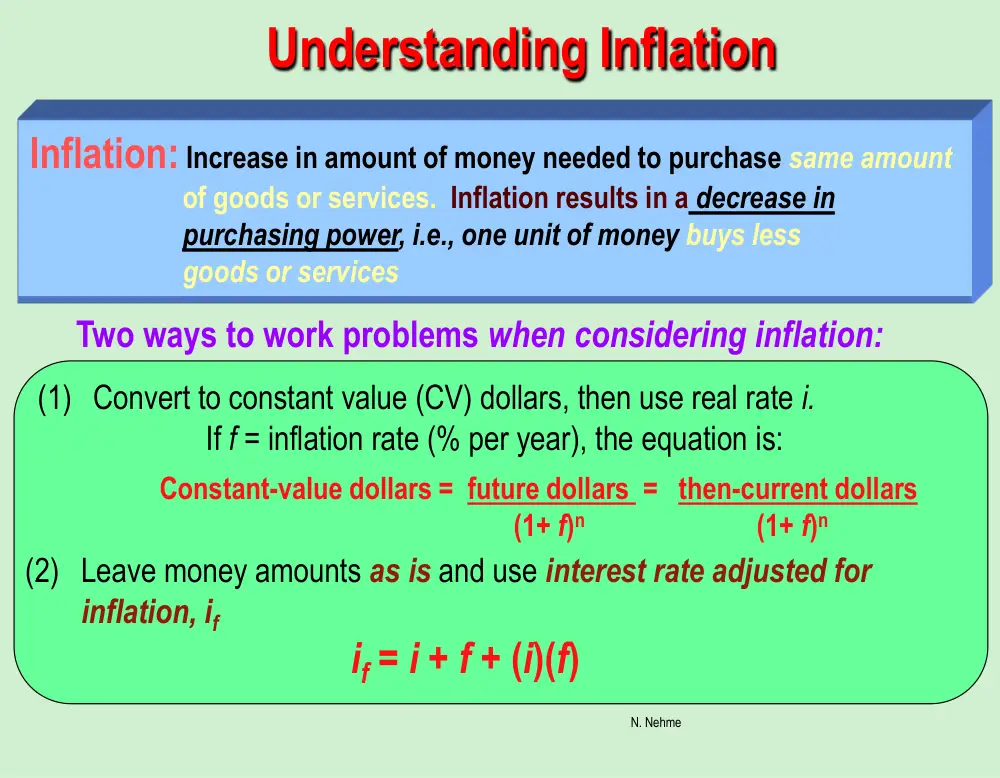
Understanding Inflation
Inflation: Increase in amount of money needed to purchase same amount
of goods or services. Inflation results in a decrease in
purchasing power, i.e., one unit of money buys less
goods or services
Constant-value dollars = future dollars = then-current dollars
(1+ f)n
(1+ f)n
(1) Convert to constant value (CV) dollars, then use real rate i.
If f = inflation rate (% per year), the equation is:
(2) Leave money amounts as is and use interest rate adjusted for
inflation, if
if = i + f + (i)(f)
Two ways to work problems when considering inflation:
N. Nehme
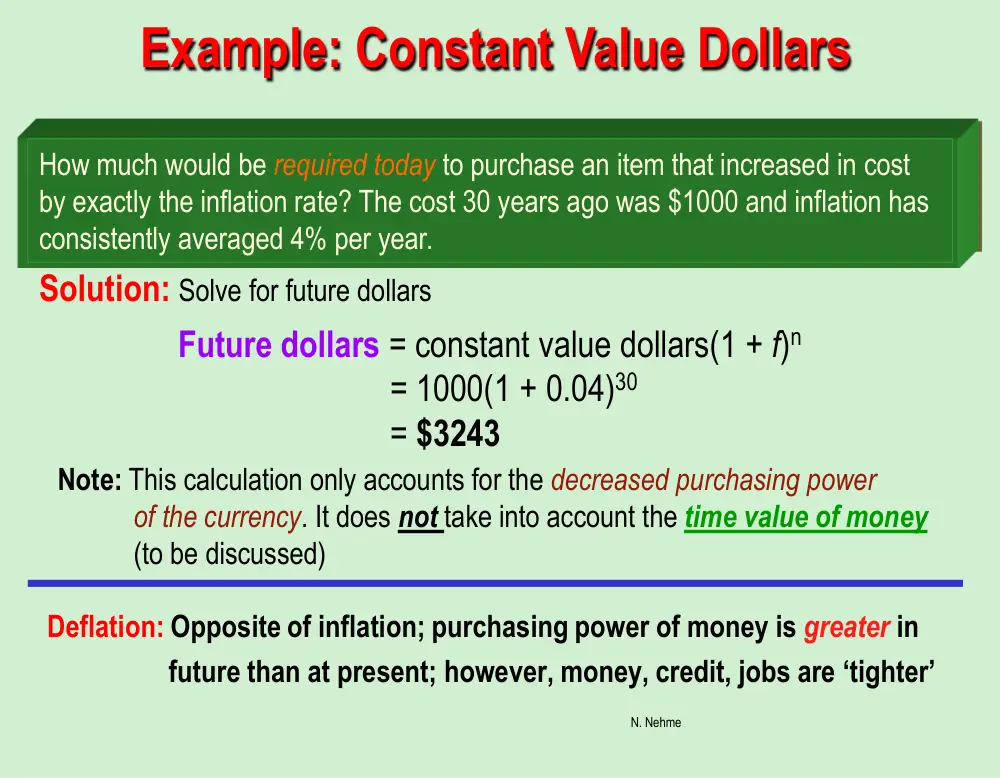
Example: Constant Value Dollars
Solution: Solve for future dollars
How much would be required today to purchase an item that increased in cost
by exactly the inflation rate? The cost 30 years ago was $1000 and inflation has
consistently averaged 4% per year.
Future dollars = constant value dollars(1 + f)n
= 1000(1 + 0.04)30
= $3243
Note: This calculation only accounts for the decreased purchasing power
of the currency. It does not take into account the time value of money
(to be discussed)
Deflation: Opposite of inflation; purchasing power of money is greater in
future than at present; however, money, credit, jobs are ‘tighter’
N. Nehme
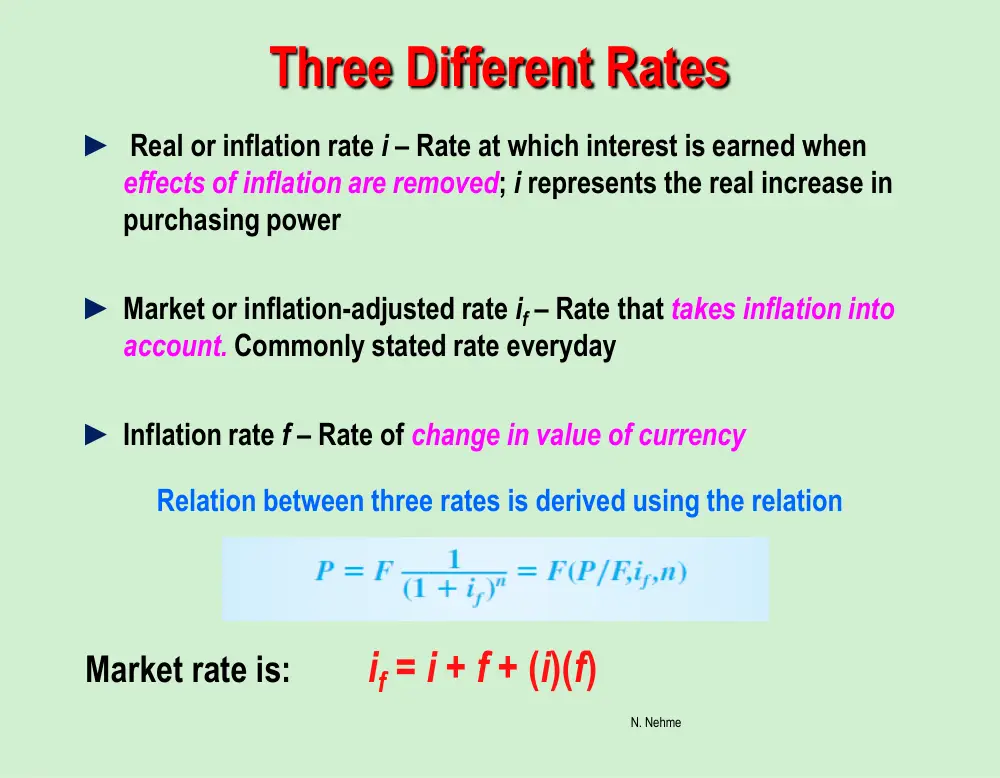
Three Different Rates
► Real or inflation rate i – Rate at which interest is earned when
effects of inflation are removed; i represents the real increase in
purchasing power
► Market or inflation-adjusted rate if – Rate that takes inflation into
account. Commonly stated rate everyday
► Inflation rate f – Rate of change in value of currency
Relation between three rates is derived using the relation
Market rate is: if = i + f + (i)(f)
N. Nehme
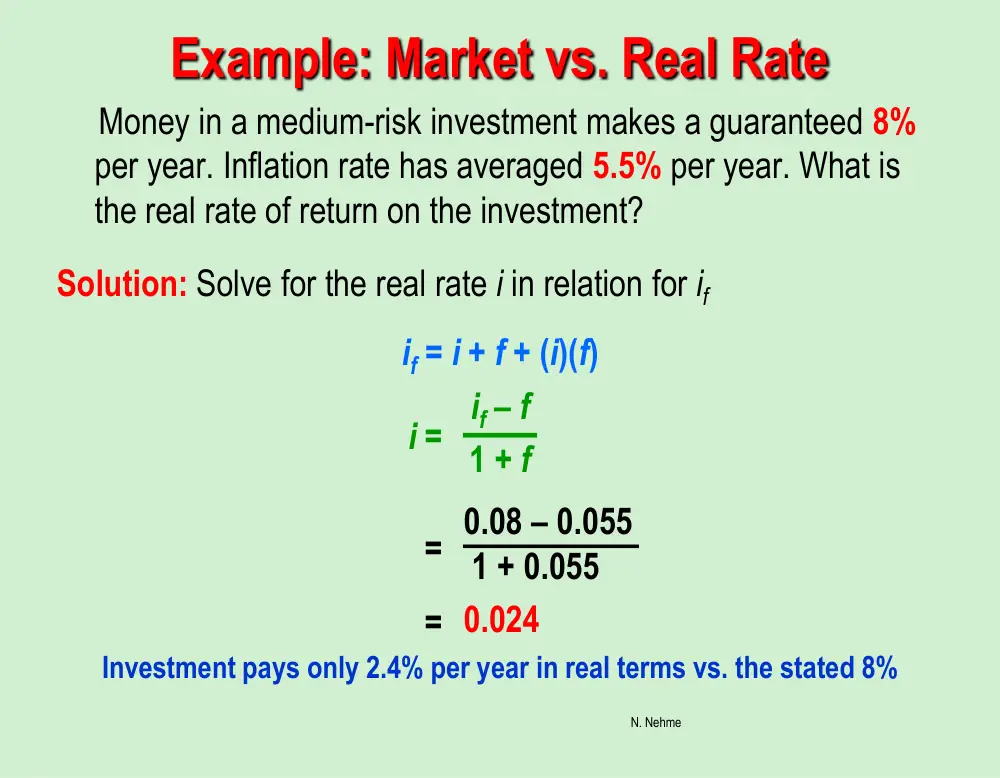
Example: Market vs. Real Rate
Money in a medium-risk investment makes a guaranteed 8%
per year. Inflation rate has averaged 5.5% per year. What is
the real rate of return on the investment?
Solution: Solve for the real rate i in relation for if
if = i + f + (i)(f)
if – f
1 + f
0.08 – 0.055
1 + 0.055
0.024
Investment pays only 2.4% per year in real terms vs. the stated 8%
i =
=
=
N. Nehme
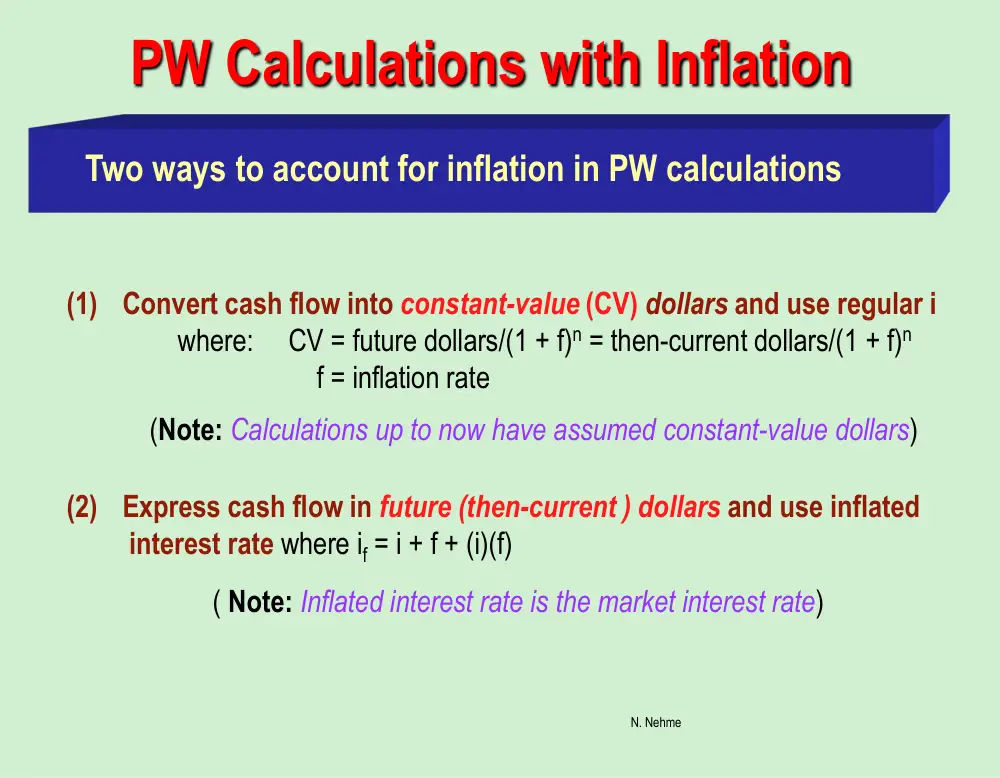
PW Calculations with Inflation
Two ways to account for inflation in PW calculations
(2) Express cash flow in future (then-current ) dollars and use inflated
interest rate where if = i + f + (i)(f)
( Note: Inflated interest rate is the market interest rate)
(1) Convert cash flow into constant-value (CV) dollars and use regular i
where: CV = future dollars/(1 + f)n = then-current dollars/(1 + f)n
f = inflation rate
(Note: Calculations up to now have assumed constant-value dollars)
N. Nehme
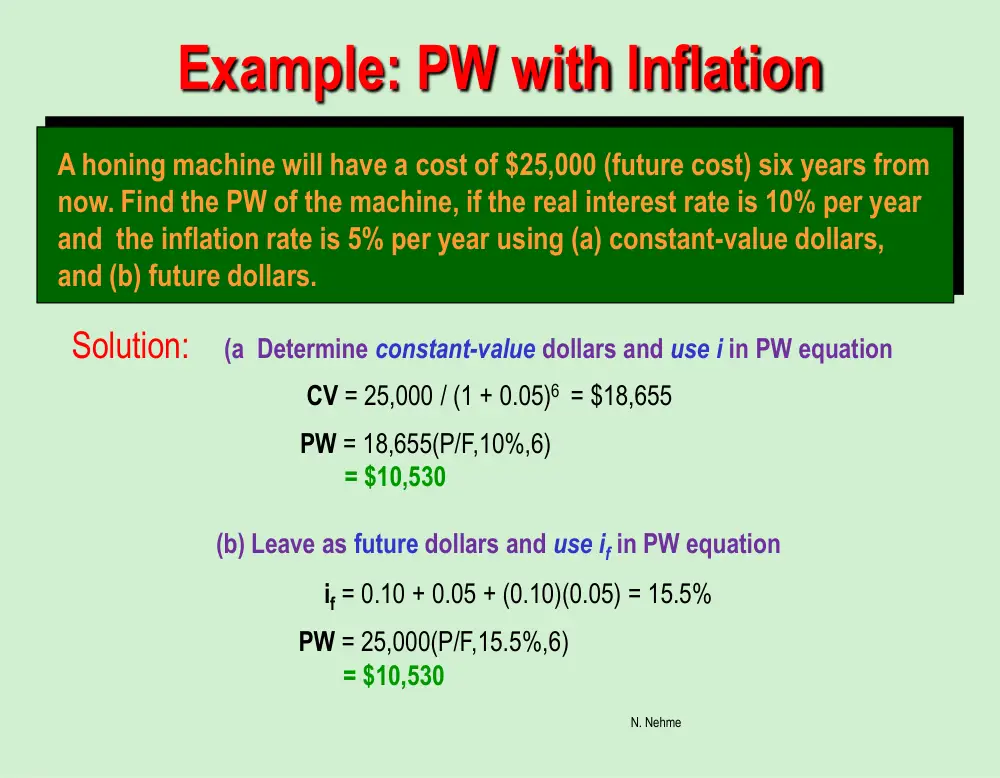
Example: PW with Inflation
A honing machine will have a cost of $25,000 (future cost) six years from
now. Find the PW of the machine, if the real interest rate is 10% per year
and the inflation rate is 5% per year using (a) constant-value dollars,
and (b) future dollars.
CV = 25,000 / (1 + 0.05)6 = $18,655
PW = 18,655(P/F,10%,6)
= $10,530
Solution: (a Determine constant-value dollars and use i in PW equation
(b) Leave as future dollars and use if in PW equation
if = 0.10 + 0.05 + (0.10)(0.05) = 15.5%
PW = 25,000(P/F,15.5%,6)
= $10,530
N. Nehme
FW Calculations with Inflation
FW values can have four different interpretations
(2) The purchasing power in terms of CV dollars of the future amount
Use if in FW equation and divide by (1+f)n or use real i
where real i = (if – f)/(1 + f)
FW = PW(F/P,i,n)
(3) The number of future dollars required to have the same purchasing
power as a dollar today with no time value of money considered
Use f instead of i in F/P factor FW = PW(F/P,f,n)
(1) The actual amount accumulated
Use if in FW equation
FW = PW(F/P, if, n)
(4) The amount required to maintain the purchasing power of the present
sum and earn a stated real rate of return
Use if in FW equation
FW = PW(F/P, if, n)
N. Nehme
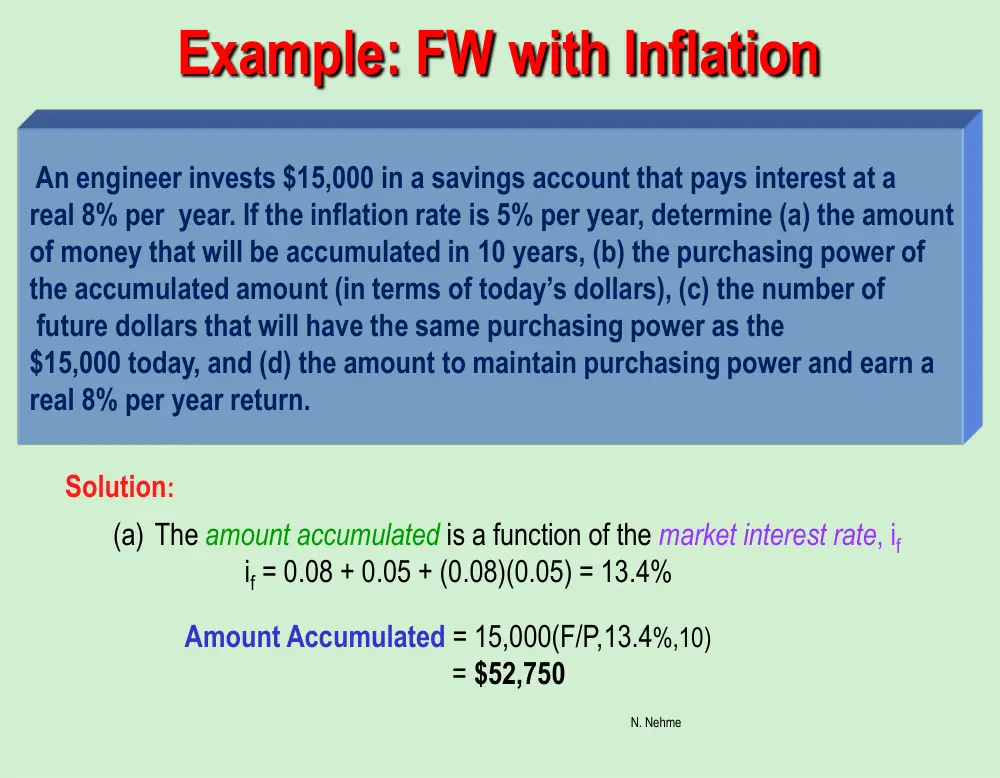
Example: FW with Inflation
An engineer invests $15,000 in a savings account that pays interest at a
real 8% per year. If the inflation rate is 5% per year, determine (a) the amount
of money that will be accumulated in 10 years, (b) the purchasing power of
the accumulated amount (in terms of today’s dollars), (c) the number of
future dollars that will have the same purchasing power as the
$15,000 today, and (d) the amount to maintain purchasing power and earn a
real 8% per year return.
(a) The amount accumulated is a function of the market interest rate, if
if = 0.08 + 0.05 + (0.08)(0.05) = 13.4%
Amount Accumulated = 15,000(F/P,13.4%,10)
= $52,750
Solution:
N. Nehme
Example: FW with Inflation (cont’d)
(c) The number of future dollars required to purchase goods that cost
$15,000 now is the inflated cost of the goods
Number of future dollars = 15,000(F/P,5%,10)
= $24,434
(b) To find the purchasing power of the accumulated amount deflate
the inflated dollars
Purchasing power = 15,000(F/P,13.4%,10) / (1 + 0.05)10
= $32,384
(d) In order to maintain purchasing power and earn a real return, money must
grow by the inflation rate and the interest rate, or if = 13.4%, as in part (a)
FW = 15,000(F/P,13.4%,10)
= $52,750
N. Nehme
Capital Recovery with Inflation
The A/P and A/F factors require the use of if when inflation is considered
If a small company invests $150,000 in a new production line machine,
how much must it receive each year to recover the investment in 5
years? The real interest rate is 10% and the inflation rate is 4% per year.
Solution: Capital recovery (CR) is the AW value
if = 0.10 + 0.04 + (0.10)(0.04) = 14.4%
CR = AW = 150,000(A/P,14.4%,5)
= $44,115 per year
N. Nehme
INDE 301
Engineering Economy
Depreciation Methods
© 2012 by McGraw-Hill, New York, N.Y
Dr. N. Nehme
1. Understand basic terms of asset depreciation
2. Apply straight line method of depreciation
3. Apply DB and DDB methods of depreciation;
switch between DDB and SL methods
4. Explain depletion and apply cost depletion &
percentage depletion methods
© 2012 by McGraw-Hill All Rights Reserved
Dr. N. Nehme
© 2012 by McGraw-Hill All Rights Reserved
Dr. N. Nehme
Depreciation Terminology
Definition: Book (noncash) method to represent decrease in value of
a tangible asset over time
Two types: book depreciation and tax depreciation
Book depreciation: used for internal accounting to track value of assets
Tax depreciation: used to determine taxes due based on tax laws
4
Common Depreciation Terms
© 2012 by McGraw-Hill All Rights Reserved Dr. N. Nehme
First cost P or unadjusted basis B: Total installed cost of asset
Book value BVt: Remaining undepreciated capital investment in year t
Recovery period n: Depreciable life of asset in years
Market value MV: Amount realizable if asset were sold on open market
Salvage value S: Estimated trade-in or MV at end of asset’s useful life
Depreciation rate dt: Fraction of first cost or basis removed each year t
Personal property: Possessions of company used to conduct business
Real property: Real estate and all improvements (land is not depreciable)
Half-year convention: Assumes assets are placed in service in midyear
Straight Line Depreciation
© 2012 by McGraw-Hill All Rights Reserved
Dr. N. Nehme
Book value decreases linearly with time
Dt = B - S
n
Where: Dt = annual depreciation charge
t = year
B = first cost or unadjusted basis
S = salvage value
n = recovery period
BVt = B - tDt
Where: BVt = book value after t years
SL depreciation rate is constant for each year: d = dt = 1/n
6
Example: SL Depreciation
© 2012 by McGraw-Hill All Rights Reserved
Dr. N. Nehme
Solution: (a ) D3 = (B – S)/n
= (20,000 – 5,000)/5
= $3,000
(b) BV3 = B – tDt
= 20,000 – 3(3,000)
= $11,000
An argon gas processor has a first cost of $20,000 with a
$5,000 salvage value after 5 years. Find (a) D3 and (b) BV3
for year three. (c) Plot book value vs. time.
(c) Plot BV vs. time
20,000
11,000
3
5
5,000
0
Year, t
BVt
7
Declining Balance (DB) and
Double Declining Balance (DDB) Depreciation
© 2012 by McGraw-Hill All Rights Reserved
Dr. N. Nehme
Determined by multiplying BV at beginning of year by fixed percentage d
Max rate for d is twice straight line rate, i.e., d ≤ 2/n
Cannot depreciate below salvage value
Depreciation for year t is obtained by either relation:
Dt = dB(1 – d)t-1 = dBVt-1
Where: Dt = depreciation for year t
d = uniform depreciation rate (2/n for DDB)
B = first cost or unadjusted basis
BVt -1 = book value at end of previous year
Book value for year t is given by:
BVt = B(1 – d)t
8
Example: Double Declining Balance
© 2012 by McGraw-Hill All Rights Reserved
Dr. N. Nehme
(b) BV3 = B(1 – d)t
= 20,000(1 – 0.4)3
= $4320
A depreciable construction truck has a first cost of $20,000 with a
$4,000 salvage value after 5 years. Find the (a) depreciation, and
(b) book value after 3 years using DDB depreciation.
Solution: (a) d = 2/n = 2/5 = 0.4
D3 = dB(1 – d)t-1
= 0.4(20,000)(1 – 0.40)3-1
= $2880
9
Spreadsheet Functions for Depreciation
© 2012 by McGraw-Hill All Rights Reserved Dr. N. Nehme
Straight line function: SLN(B,S,n)
Declining balance function: DB(B,S,n,t)
Double declining balance function: DDB(B,S,n,t,d)
Note: It is better to use the DDB function for DB and DDB
depreciation. DDB function checks for BV < S and is more
accurate than the DB function.
10
© 2012 by McGraw-Hill All Rights Reserved
Dr. N. Nehme
Depletion Methods
Depletion: book (noncash) method to represent decreasing
value of natural resources
Two methods: cost depletion (CD) and percentage depletion (PD)
Cost depletion: Based on level of activity to remove a natural resource
Calculation: Multiply factor CDt by amount of resource removed
Where: CDt = first cost / resource capacity
Total depletion can not exceed first cost of the resource
Percentage depletion: Based on gross income (GI) from resource
Calculation: Multiply GI by standardized rate (%) from table
Annual depletion can not exceed 50% of company’s taxable income (TI)
© 2012 by McGraw-Hill All Rights Reserved
Dr. N. Nehme
11
Example: Cost and Percentage Depletion
A mine purchased for $3.5 million has a total expected yield of one
million ounces of silver. Determine the depletion charge in year 4 when
300,000 ounces are mined and sold for $30 per ounce using (a) cost
depletion, and (b) percentage depletion. (c) Which is larger for year 4?
Solution: Let depletion amounts equal CDA4 and PDA4
(a) Factor, CD4 = 3,500,000/ 1,000,000 = $3.50 per ounce
CDA4 = 3.50(300,000) = $1,050,000
(b) Percentage depletion rate for silver mines is 0.15
PDA4 = (0.15)(300,000)(30) = $1,350,000
(c) Claim percentage depletion amount, provided it is ≤ 50% of TI
N. Nehme
Engineering Economy
Page 1 of 13
INDE 301 Engineering Economy
Introduction to Accounting and Setting the MARR1
What is accounting?
Accounting is the act of gathering and reporting the financial
history of an organization (company).
This requires a continuous process of
o Capturing financial data,
o Organizing it,
o Producing financial reports.
Framework for understanding accounting information
Information in accounting reports are determined by
o Economic concepts. Determine what is being actually
reported? E.g., financial value, wealth, income.
o Accounting conventions. Dictate how to report financial
transactions to measure the desired economic criteria.
o Institutional context. This reflects the effect of human
judgment in adopting accounting conventions.
1 Compiled mostly from Antle and Gartska (2004), Financial Accounting, and Chapter 10, text.
N. Nehme
Engineering Economy
Page 2 of 13
Financial Statements: Balance Sheet
An organization’s balance sheet is a list of resources
available (assets), resources committed (liabilities), and their
difference (equity) at a point in time.
The numbers on the balance sheet add up. Assets and
liabilities and stockholders' equity must balance.
This is the fundamental accounting identity,
ASSETS = LIABILITIES + EQUITY .
Equivalently,
ASSETS – LIABILITIES = EQUITY .
N. Nehme
Engineering Economy
Page 3 of 13
Financial Statements: Income Statement
An organization’s income statement lists the economic
resources acquired (revenues) and consumed (expenses)
through operations over a period of time.
The income statement reports success or failure of
company's operations during the period.
Relative to the balance sheet, the income statement explains
the change in retained earnings between the beginning and
end of the period.
N. Nehme
Engineering Economy
Page 4 of 13
Financial Statements: Cash Flow Statement
An organization’s cash flow statement describes flow of cash
into and out of organization during a period.
The cash flows are classified as one of three types
o Operating activities. Intended to generate net income.
o Investing activities. Resulting from acquiring or disposing
of productive company assets.
o Financing activities. Payments to or receipts from
suppliers of money (e.g., shareholders or debt holders).
Relative to the balance sheet, the income statement explains
the change in cash between the beginning and end of period.
N. Nehme
Engineering Economy
Page 5 of 13
Annual Report
The balance sheet, the income statement and the cash flow
statement are part of a comprehensive financial report called
annual report.
The annual report contains other elements such as the
retained earnings statement, management discussion and
analysis, notes to financial statements and auditor’s report.
Balance Sheet Contents
A balance sheet generally contains the following:
o Current assets
o Noncurrent assets
o Current Liabilities
o Noncurrent (long-term) liabilities
o Stockholders' equity
Assets
An asset (i) generates economic benefit, (ii) is owned or
controlled, (iii) is the result of a past transaction.
Current assets are converted to cash or used in business
within one year. E.g., cash, short-term investments, accounts
receivable, and inventories.
N. Nehme
Engineering Economy
Page 6 of 13
Noncurrent assets are converted to cash or used in business
after more than one year. E.g., property, plant and equipment,
long-term investments, and rights.
An asset market value is the value the market assigns to an
asset.
Book value is the value accounting assigns to an asset.
Market value and book value are often different.
Depreciation is the deduction of the book value over time.
Liabilities
A liability (i) requires a future sacrifice, (ii) is an obligation,
and (iii) is the result of a past transaction.
Current liabilities are expected to be paid within one year.
E.g., accounts payable, accrued liabilities, short-term
borrowings, dividends payable, unearned revenues.
Dividends are the part of earnings that a company shares with
its shareholders (owners).
Noncurrent liabilities are debts expected to be paid after
more than one year. E.g., warranties, employee benefits,
lease, bonds payable, long-term borrowings.
N. Nehme
Engineering Economy
Page 7 of 13
Stockholders' Equity
This is the difference between total assets and total
liabilities, which arises from the contributions of owners and
economic income.
Examples include
o Common Stock. Shareholders’ investment in entity
through acquisition of stock. Entitles holder to vote on
major decisions and claim assets in case of liquidation.
o Preferred stock. Similar to common stock. Owners are
typically not allowed to vote on major decisions. They
however have priority in dividend and claim on assets in
case of liquidation.
o Retained Earnings. Net income generated from operations
less what has been returned to shareholders in dividends.
N. Nehme
Engineering Economy
Page 8 of 13
Setting the MARR
As you have seen, the minimum attractive rate of return
(MARR) is essential in engineering economic analysis.
As mentioned previously, the MARR is set above the
company’s cost of capital.
The cost of capital is a weighted average of the cost of debt
and equity financing.
In establishing the MARR, the company’s management adds
increments for (i) additional return and (ii) risk factor.
The MARR may vary from one project to another and over
time because of factors such as risk, investment opportunity,
tax, capital limitation, competition.
N. Nehme
Engineering Economy
Page 9 of 13
Weighted Average Cost of Capital (WACC)
Financing of a project comes from equity and debt sources.
WACC is estimated as follows
WACC = (equity fraction)(cost of equity capital)
+ (debt fraction) (cost of debt capital)
Costs of equity and debt capitals are divided into several
categories as reflected in the company’s balance sheet.
Debt financing is considered risky as it entails strict payment
obligations to the company.
Debt-to-equity-ratio = liabilities/equities is used to assess the
risk of debt financing. (Text refers to this ratio as D-E mix.)
Determining the Cost of Debt Capital
Debt financing is obtained mainly through loans and bonds.
Bond and loans interest payments are tax-deductible.
(For bonds, “interest” includes coupon payment and price
discounts relative to the face value.)
N. Nehme
Engineering Economy
Page 10 of 13
Tax deductible means that the interest payments will be
considered “expenses” on the company’s income statement
leading to a lower net income.
This leads to tax saving as taxes apply to net income.
This is an advantage of debt financing. (Do not forget that
debt financing is risky though.)
The cost of debt capital is then found as the ROR (yield) of
the bond or loan after adjusting down the interest expenses at
the appropriate tax rate.
E.g., let Te be the tax rate, and suppose a company receives P
now and pays Ct in interest in periods t =1, …, n and then
pays P back at time n. (This is like a bond at par.)
Then, the cost of debt capital is id
* that satisfies
*
*
1
(1
)
0
(1
)
(1
)
n
e
t
t
n
t
d
d
T C
P
P
i
i
.
For bonds not at par, the analysis should include tax
deduction from interest in terms of discount on face value,
which is more involved.
Determining the Cost of Equity Capital
Equity financing comes from issuing preferred stock, and
common stock, and from retained earnings.
Tax considerations do not affect equity cost of capital since
stock dividends are not tax-deductible.
N. Nehme
Engineering Economy
Page 11 of 13
Preferred stocks typically guarantee a stated dividend
annually, quoted as a percentage of the par (issuance) value.2
This percentage can be used as the cost of capital for the
preferred stock.
E.g. a 10% dividend preferred stock with a par value of $100,
will pay an annual dividend of $10.
The cost of capital in this case is 10% .
For common stock, no stated rate of return is guaranteed.
One approach is to estimate the dividend growth rate, g.
Letting DV1 be the first year dividend (in dollars) and P the
price of the stock, the cost of equity is
Re = DV1 / P + g .
E.g., if a stock issued at $20 per share pays $1 dividend in the
first year, and an appreciation rate of 4% per year is
anticipated for future dividends.
Then, the corresponding cost of capital is
Re = 1 /20 + 0.04 = 0.09 = 9% .
2 Preferred stock may not generate dividends every year. However, when dividends are paid in a year, they
are cumulative for preferred stock, meaning that unpaid previous years dividends are paid, in addition to the
current year dividend.
N. Nehme
Engineering Economy
Page 12 of 13
CAPM
Another model to estimate the common stock return is the
capital asset pricing model (CAPM).
CAPM is a financial stock valuation model based on an
strategy that involves investing in the whole stock market
(market portfolio) and the risk-free (bond) asset.
This investment strategy can be shown to be optimal under
certain assumptions.3
Investing in the market portfolio typically translates in
investing in an index fund that captures most of the market.
E.g., the S&P 500 index.
CAPM gives the expected stock return as a function of the
risk-free (bond) rate, Rf, the average market (index) rate of
return, Rm, and of the stock.
is a measure of correlation between the stock price and the
market portfolio value.
Specifically, letting M
2 be the variance of market ROR and
sM the covariance between the stock and the market
portfolio RORs
2
sM /
M
.
is estimated from historical data and published.
A high reflects a highly volatile stock with a price that
fluctuates a lot.
3 The most important assumption is market efficiency, which states that past stock values cannot be used to
predict future ones.
N. Nehme
Engineering Economy
Page 13 of 13
Based on CAPM, the cost of capital for a common stock is
estimates as follows.
(
)
e
f
m
f
R
R
R
R
.
That is, the cost of capital of a common stock is equal to the
risk-free rate plus a risk premium.
The security market line gives Re as a function of
N. Nehme
Engineering Economy
Page 1 of 8
INDE 301 Engineering Economy
Chapter 11 Replacement and Retention Decisions
Reasons for Replacing an Asset
Reduced Performance
o Wear and tear
o Decreasing reliability and productivity
o Increasing operating and maintenance costs
Altered Requirements
o New production needs, accuracy, speed, etc.
Obsolescence
o Current assets may be less productive
o Not state of the art – need to meet competition
Terminology
Defender Asset. Currently installed asset.
Challenger Asset. Could replace the defender asset.
Equivalent Uniform Annual Cost (EUAC). AW for costs.
Economic Service Life (ESL). Number of years at which
lowest AW of costs occur.
Defender First Cost. Initial investment in the defender (P).
Market value (MVk) of the defender in year k. Salvage value
of the defender in year k.
Challenger first cost. Initial cost necessary to acquire and
install the challenger.
N. Nehme
Engineering Economy
Page 2 of 8
Example 1
N. Nehme
Engineering Economy
Page 3 of 8
Economic Service Life (ESL)
ESL is the number of years n at which the equivalent annual
worth AW of costs is the minimum considering the most
current cost estimates over all possible years that the asset
may provide a needed service.
Total AW of costs is the sum of capital recovery (CR), which
is the initial investment and any salvage value, and the AW
of the estimated annual operating cost (AOC)
Total AW = CR – AW of AOC
Capital Recovery = -P(A/P, i, n) + S (A/F, i, n)
The salvage value, S, which usually decreases with time, is
the estimated market value (MV) in that year.
The complete equation for total AW of costs over k years (k
= 1, 2, 3,…)
P = initial investment or current market value
Sk = salvage value or market value after k years
AOCj = annual operating cost for year j
Usually, AOC increase with time, k and CR decreases with k.
The ESL, k*, strikes a balance between these two costs.
N. Nehme
Engineering Economy
Page 4 of 8
High CR means that the asset has been utilized long enough
and generated enough value.
N. Nehme
Engineering Economy
Page 5 of 8
Example 2
A 3-year-old backup power system is being considered for early
replacement. Its current market value is $20,000. Estimated future
market values and annual operating costs for the next 5 years are
given in the below table, columns 2 and 3.
What is the economic service life of this defender if the interest
rate is 10 % per year? Solve by hand.
Solution
Calculate capital recovery for the $20,000 current market
value (j = 0) plus 10% return (column 4)
Calculate the equivalent AW of AOC for k years (column 5)
i.e: the computation of total AW for k = 3 is
= -6230-6405= $ -12,635
N. Nehme
Engineering Economy
Page 6 of 8
Special cases for ESL
If AOC are the same for all years, then k*. Then, set k*at the
maximum possible number of years.
If AOC is increasing with time and MV is the same for all
years, then replace in year 1. Then, k* = 1.
Marginal Costs
Marginal costs (MC) are year-by-year estimates of the costs to
own and operate an asset for that year. Three components are
added to determine the marginal cost:
1. Cost of ownership (loss in the market value is the best
estimate of this cost)
2. Forgone interest on the market value at the beginning of
the year
3. AOC for each year
AW of marginal costs = total AW of costs
Replacement with an identical challenger
Suppose an asset is to be replaced with an identical
challenger. Let k0 be the age of the defending asset.
Then, replace the asset if k0 ≥ k*, where k* is the ESL.
Otherwise (if k0 < k*), then keep the asset.
This will minimize the long run cost assuming that
replacement is only possible with identical assets.
For example, an asset with k* = 3 should be replaced if its
age is 3 or more years, and retained, otherwise.
N. Nehme
Engineering Economy
Page 7 of 8
Replacement with a nonidentical asset
Suppose now an asset is to be replaced with a challenger
having different characteristics.
Let kD* and AWDk* be the ESL and corresponding AW of the
defender, and kC* and AWCk* be those of the challenger.
Then, replace the defender immediately if AWCk * < AWDk* .
Otherwise,
o If AWCk* > AWDk*, but AWCk* < AWDk for some year
kD’ > kD*, then replace the defender at year kD’. If no such
kD’ exists, then keep defender.
o If AWCk* > AWDk, for all k, then keep the defender as
long as possible.
k
AWk
AWD
kD’
AWCk* > AWDk, for all k, retain
AWCk* < AWDk, replace
AWCk* < AWD(kD’), replace at kD’
N. Nehme
Engineering Economy
Page 8 of 8
The assumption here is that no other challenger will be
identified in future years.
Generalized replacement models
Sometimes one can expect emergence of future challengers.
In these cases, one should include future alternatives in the
analysis.
This complicates the replacement problem since many
options are now possible.
For example, suppose there is a challenger now and a
challenger next year. The options are:
(i) Replace now with current challenger and retain current
challenger thereafter.
(ii) Retain now and replace with next year’s challenger.
(iii) Retain defender throughout.
N. Nehme
Engineering Economy
Page 1 of 1
INDE 301 Engineering Economy
Chapter 12 Selection from Independent Projects
under Budget Limitation
Basic Problem (Capital Budgeting Problem)
An investor can choose from a set S of n independent
projects.
At year 0, the investor has only b dollars to invest.
Suppose that each project jS requires an initial investment
of NCFj0.
Let NCFjt be the net cash flows of project j at year t.
Suppose that the investor can provide any capital needed
beyond year 0.
The problem is to select the subset of projects, A S that
maximizes the investor’s fortune while meeting the budget
constraint at year 0.
Solution Approach
1. Identify “feasible bundles” that satisfy the budget constraint.
That is, find all A S, such that
0
.
j
j A
NCF
b
2. Find the PW of each of these “feasible” bundles. The PW of
a bundle is the sum of PWs of projects within the bundle.
That is,
A
j
j A
PW
PW
.
N. Nehme
Engineering Economy
Page 2 of 2
3. Select the feasible bundle that gives maximum PW. That is,
select A* such that
*
max
A
A
A S
PW
PW
.
Underlying Assumption
PW of each project is determined on its own life span. No
LCM or equal life approach is needed.
This is equivalent to assuming that positive cash flows of
short life projects in a bundle are reinvested throughout the
life of the longest life project at the MARR.
Solving the capital budgeting problem using ILP
Solving the capital budgeting problem by hand can be tedious
especially when the choice set S has many projects (2n
bundles should be considered).
Integer linear programming (ILP) is an optimization
technique that can be used to solve this problem quickly
using a computer.
In ILP, each project jS is assigned a binary variable xj. The
variable xj can take on two values 0 and 1.
If xj = 0, the project is not selected. If xj = 1, the project is
selected.
N. Nehme
Engineering Economy
Page 3 of 3
The ILP “model” for the capital budgeting problem is as
follows:
0
max
subject to
.
j
j
j S
j
j
j S
Z
PW x
NCF x
b
The ILP problem can be solved using several commercially
available software (e.g., Microsoft Excel Solver).
The solution to the ILP is denoted by x* = (x1*, x2*, …, xn*).
A project j with xj* = 1 is selected. Otherwise, j is not
selected.
Approximate (Heuristic) Capital Budgeting Solutions
Approximate solutions to the capital budgeting ILP is
obtained by ranking projects according to benefit-cost ratio.
This approximation method assumes that each project
involves an initial outlay of cash (first cost) followed by a
series of benefits.
The benefit-cost ratio for each project is the ratio of the
present value of benefits to the initial cost.
The approximate solution is obtained by selecting the project
with the highest benefit-cost ratio, then the project with the
second highest ratio, and so on, until the budget is exhausted.
N. Nehme
Engineering Economy
Page 1 of 5
INDE 301 Engineering Economy
Chapter 14 Effects of Inflation
Definition
Inflation is an increase (over time) in the amount of money
necessary to buy goods.
For example,
o The price of 1 McDonald’s Big Mac was $2.14 in 08/03.
o The price of 1 McDonald’s Big Mac was $2.23 in 08/04.
o Currently, it’s around $3.5.
In simpler terms, “inflation means that your money won’t
buy as much today as it did yesterday.”
Causes of inflation1
Demand for goods exceeds supply. That is, “too much
money chasing too few goods.”
Government prints money more than the economy is worth.
Increases in production costs that when passed to customers
push prices up.
Excessive spending power of consumers.
Impact of international market prices (e.g., oil price).
Unresponsive prices that seldom declines (e.g., prices set by
large firms).
1 Adapted from Riggs et al., Engineering Economy, Mc