
PHYS 210L Lab Spectrometer, Fall 2014
American University of Beirut · Introductory Physics Laboratory II · 2 pages
More PHYS 210L files
- Lab Report · Fall 2017LabView
- Lab Solved Report Standing Waves String · Fall 2012Lab · with solutionView
- Lab Solved Report · Fall 2012Lab · with solutionView
- Lab Sound Waves Report Solution · Fall 2012Lab · with solutionView
- Lab Meq Heat Solved Report · Fall 2012Lab · with solutionView
- Lab Solved Report Interference and Diffraction · Fall 2010Lab · with solutionView
- Lab Solved Report Michelson · Fall 2010Lab · with solutionView
- Lab Solved Report Spectrometer · Fall 2010Lab · with solutionView
Show the text of this lab
PHYS 210 L
The Spectrometer
I. DIFFRACTON GRATING:
A. Incandescent lamp:
Illuminate the slit
a) Describe the spectrum after looking at it.
We see a continuous spectrum containing the whole range of visible colors from
violet to red. Colors appear in the following order as we move the telescope from the
initial position: Violet, Blue, Green, Yellow, Orange and Red.
b) Angles measured in the first order:
Extreme red: 23 degrees and 30 minutes.
Extreme violet: 14 degrees and 42 minutes.
c) Wavelengths:
Using the formula d.sin = m. , with m=1, and d = (1/600) mm, we find the following:
Extreme red: 664.5818 nm
Extreme violet: 422.9299 nm
B. Mercury Lamp:
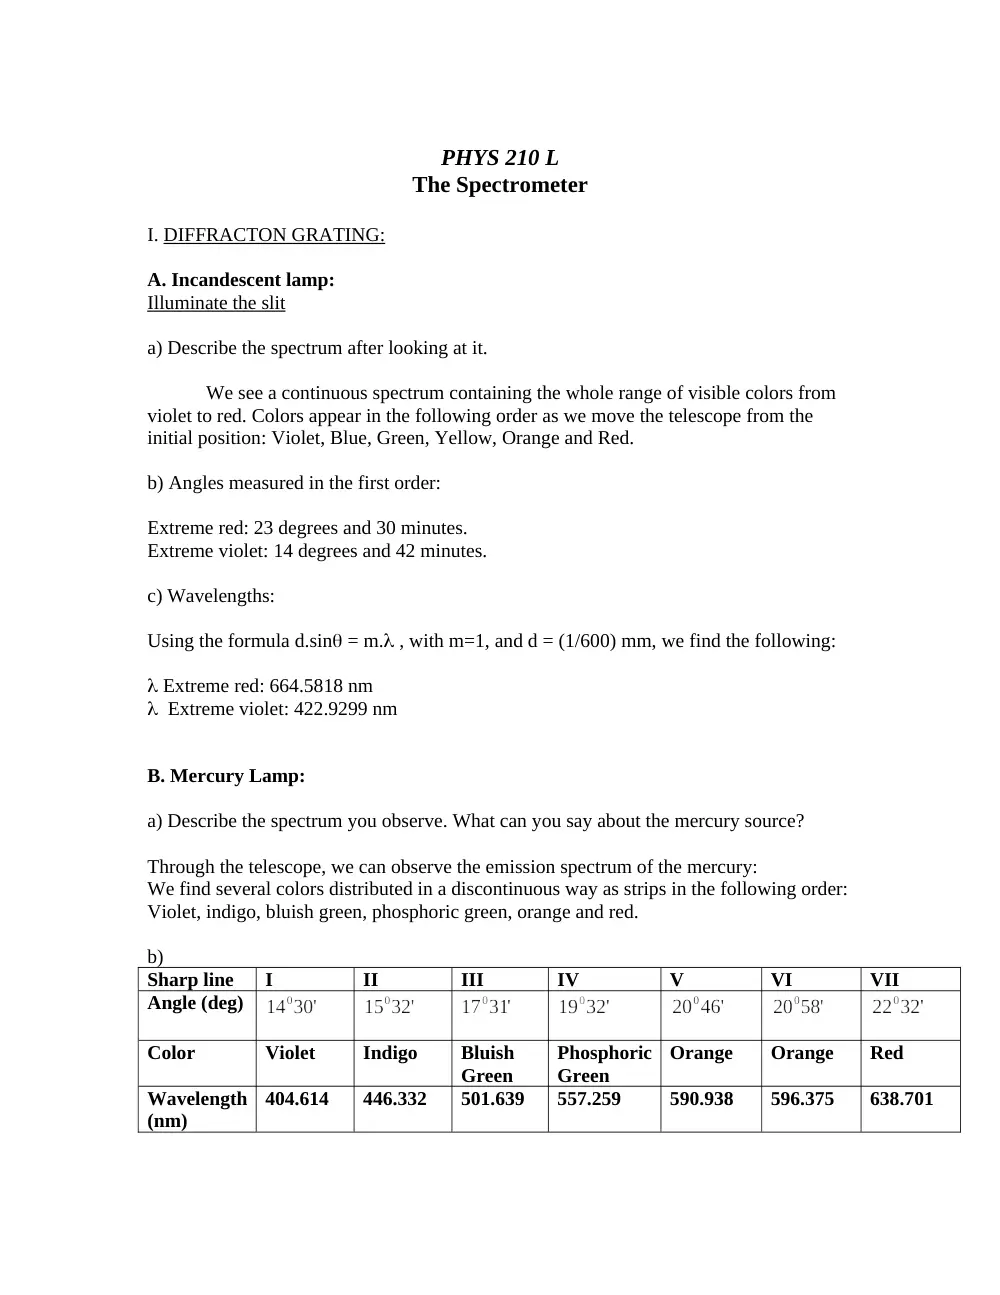
a) Describe the spectrum you observe. What can you say about the mercury source?
Through the telescope, we can observe the emission spectrum of the mercury:
We find several colors distributed in a discontinuous way as strips in the following order:
Violet, indigo, bluish green, phosphoric green, orange and red.
b)
Sharp line
I
II
III
IV
V
VI
VII
Angle (deg)
Color
Violet
Indigo
Bluish
Green
Phosphoric
Green
Orange
Orange
Red
Wavelength
(nm)
404.614
446.332
501.639
557.259
590.938
596.375
638.701
II. Prism:
Mercury spectrum
Number of orders per color: 1
The most deviated color: Violet.
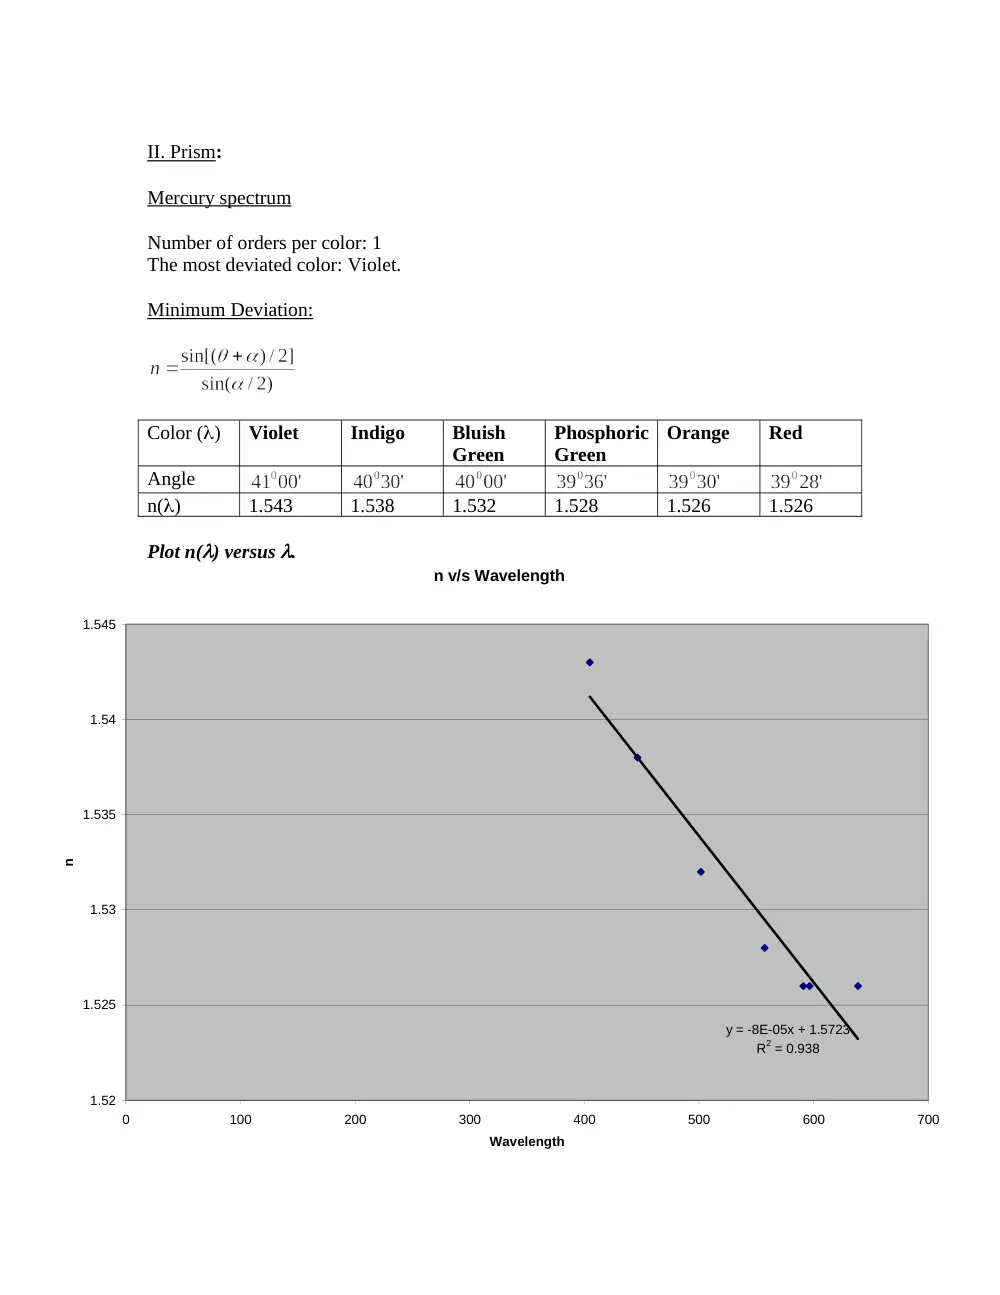
Minimum Deviation:
Color ()
Violet
Indigo
Bluish
Green
Phosphoric
Green
Orange
Red
Angle
n()
1.543
1.538
1.532
1.528
1.526
1.526
Plot n() versus .
n v/s Wavelength
y = -8E-05x + 1.5723
R2 = 0.938
1.52
1.525
1.53
1.535
1.54
1.545
0
100
200
300
400
500
600
700
Wavelength
n