
PHYS 211 Final, Fall 2005
American University of Beirut · Electricity and Magnetism · 5 pages


More PHYS 211 files
Show the text of this final exam
1
Physics 211L
Final Exam January 2006
Name:________________________________ID__________________
Section: M-1
M-3 T-1
T-3
W-1 W-3 Th-1 Th-3 F-1
F-3
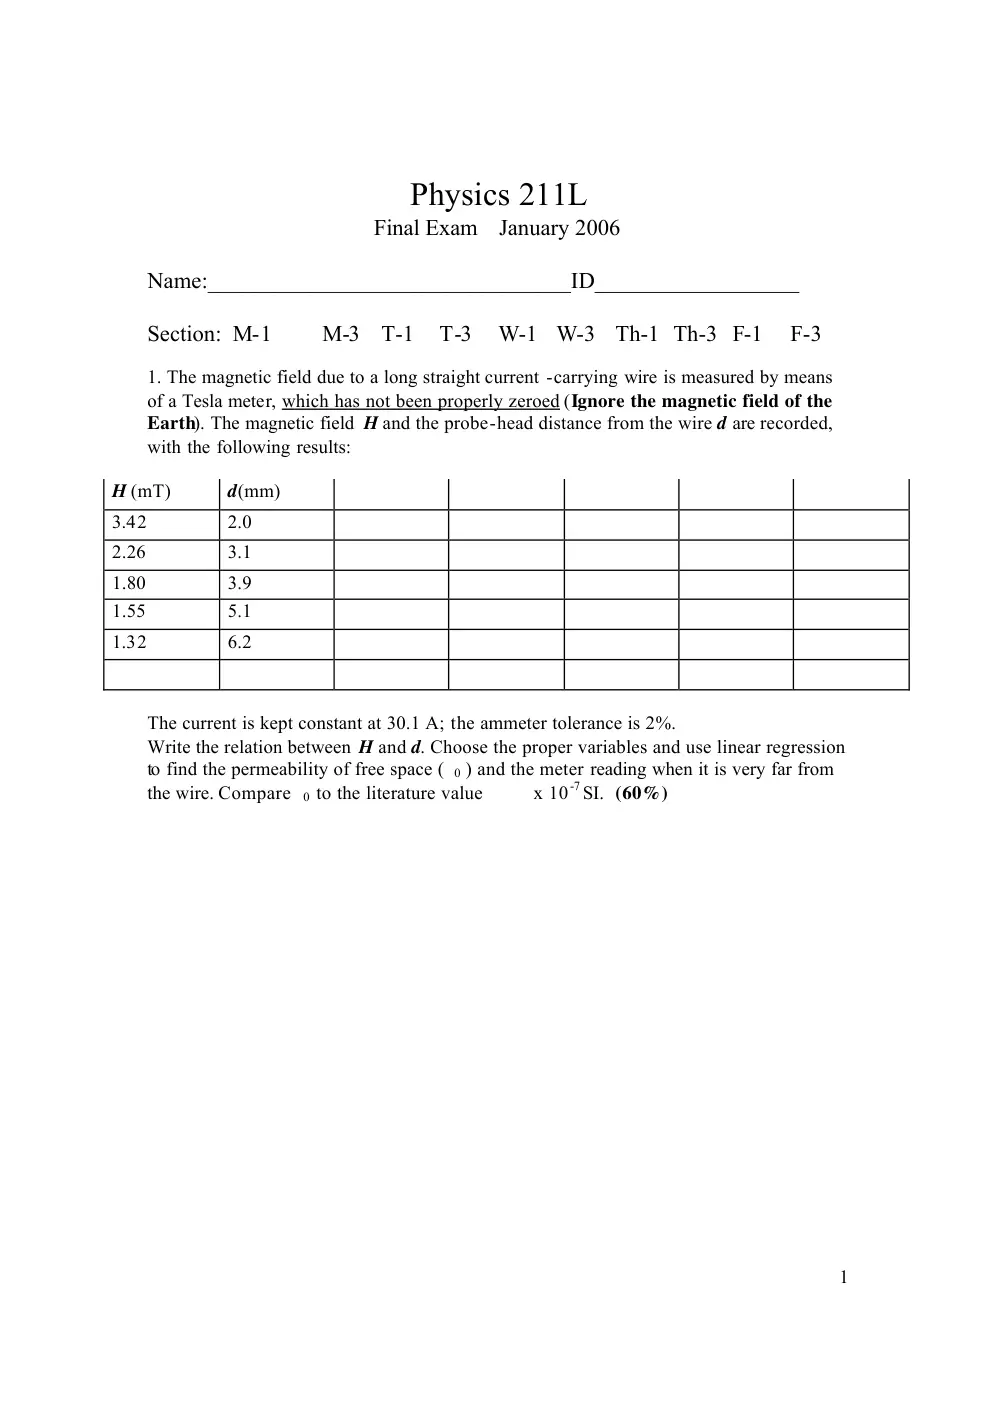
1. The magnetic field due to a long straight current -carrying wire is measured by means
of a Tesla meter, which has not been properly zeroed (Ignore the magnetic field of the
Earth). The magnetic field H and the probe-head distance from the wire d are recorded,
with the following results:
H (mT)
d(mm)
3.42
2.0
2.26
3.1
1.80
3.9
1.55
5.1
1.32
6.2
The current is kept constant at 30.1 A; the ammeter tolerance is 2%.
Write the relation between H and d. Choose the proper variables and use linear regression
to find the permeability of free space (
0 ) and the meter reading when it is very far from
the wire. Compare 0 to the literature value
x 10 -7 SI. (60%)
2
3
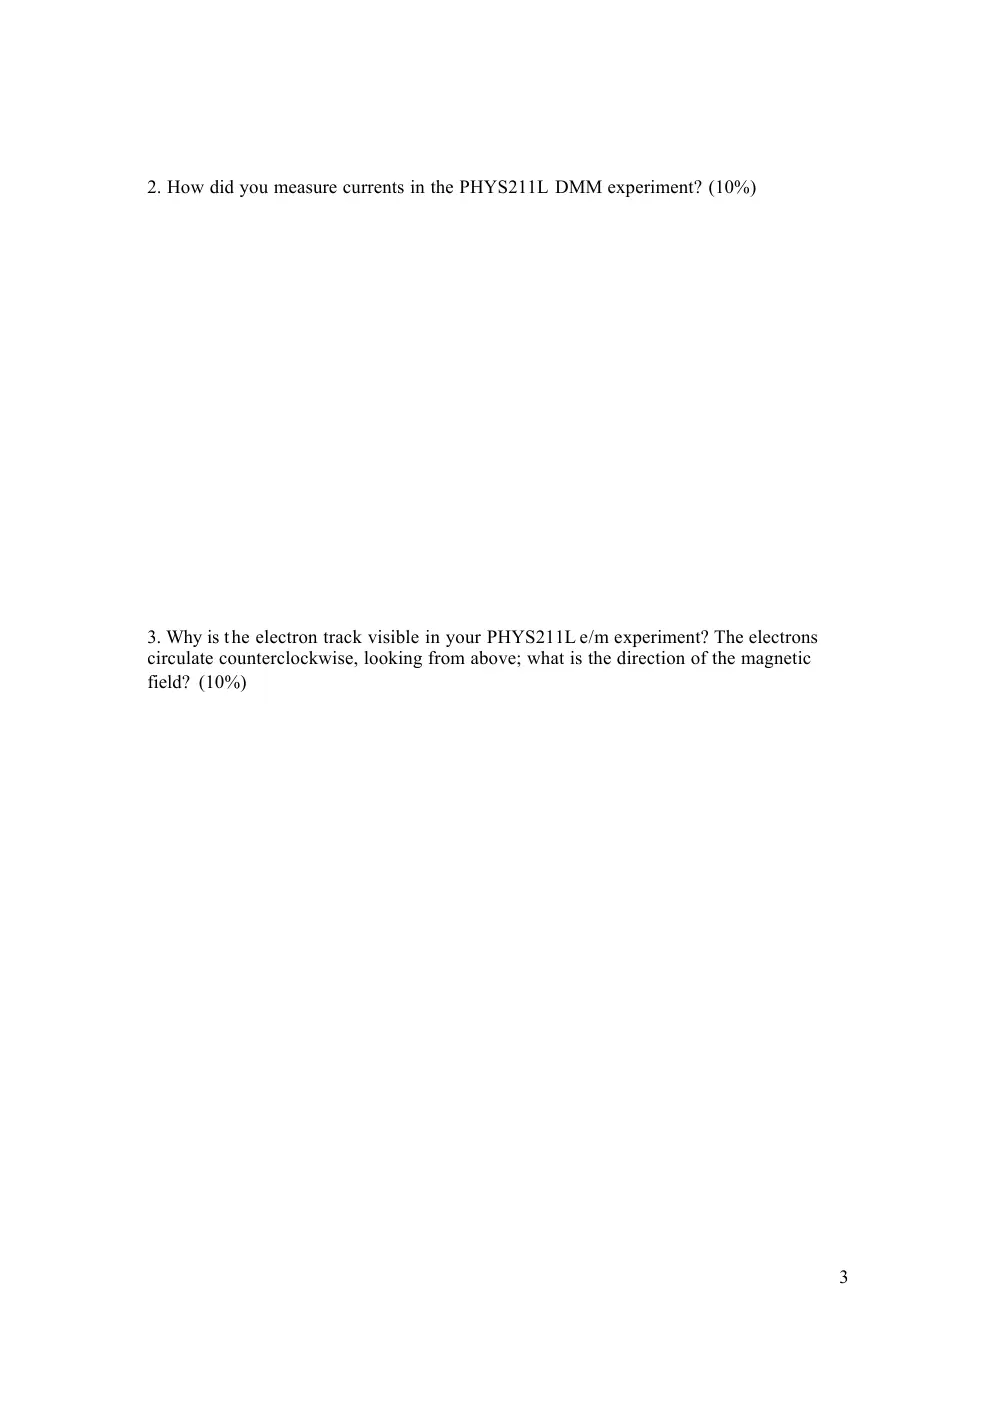
2. How did you measure currents in the PHYS211L DMM experiment? (10%)
3. Why is the electron track visible in your PHYS211L e/m experiment? The electrons
circulate counterclockwise, looking from above; what is the direction of the magnetic
field? (10%)
4
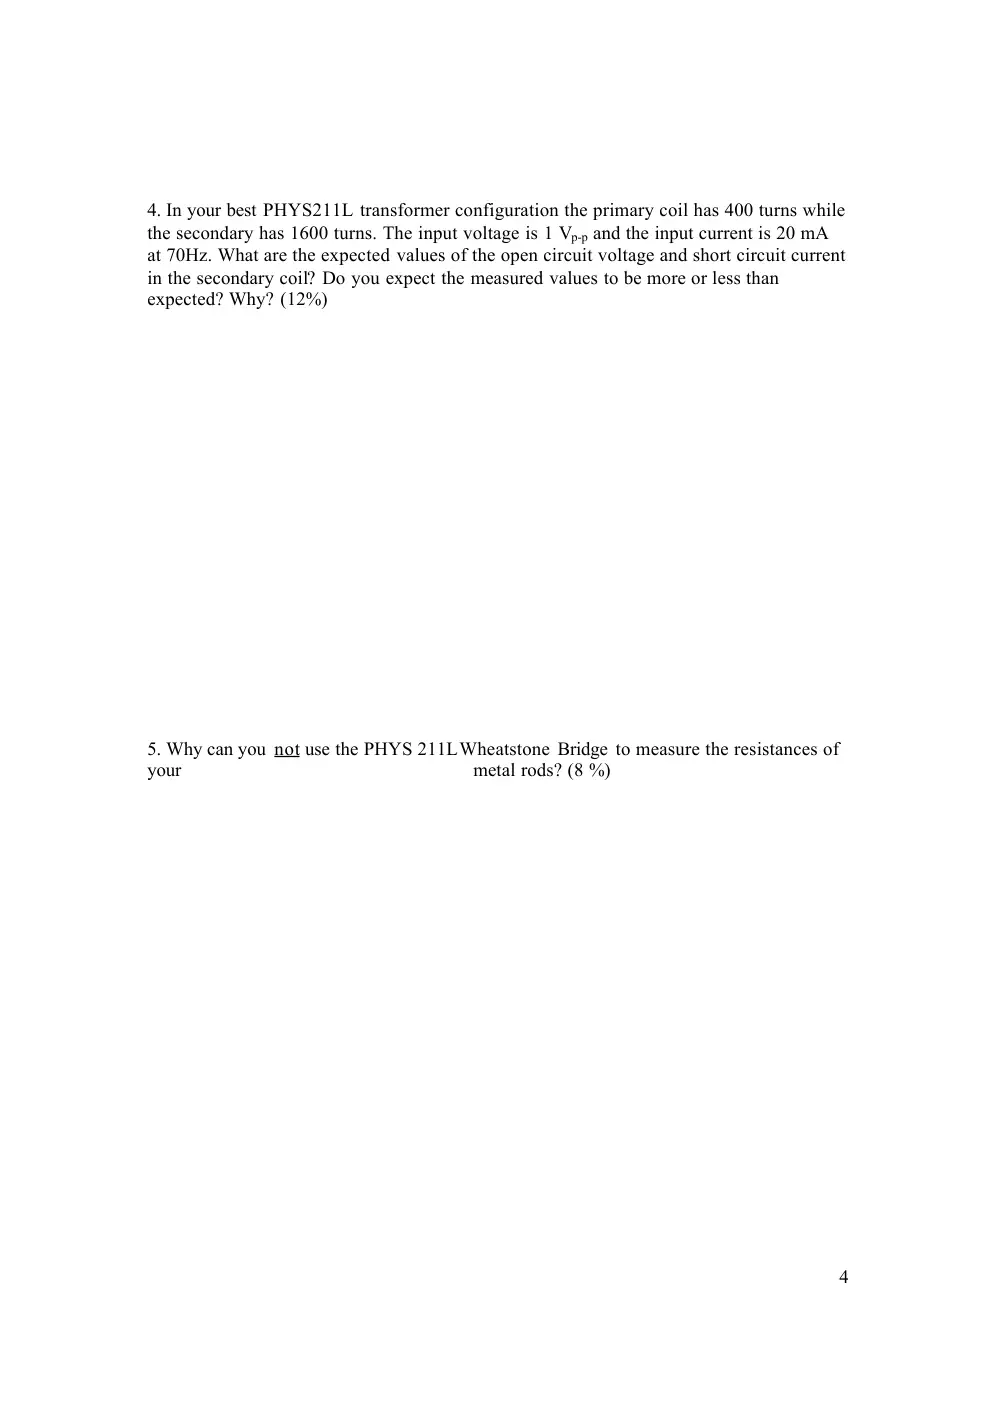
4. In your best PHYS211L transformer configuration the primary coil has 400 turns while
the secondary has 1600 turns. The input voltage is 1 Vp-p and the input current is 20 mA
at 70Hz. What are the expected values of the open circuit voltage and short circuit current
in the secondary coil? Do you expect the measured values to be more or less than
expected? Why? (12%)
5. Why can you not use the PHYS 211LWheatstone Bridge to measure the resistances of
your
metal rods? (8 %)
5
LINEAR REGRESSION
Many experiments yield a series of pairs of data values. Usually the xi values are selected
and the yi values are measured.
The method of least squares is used to fit a curve (find a theoretical equation) to a set of
experimental data. First assume that a linear relation exists between y and x
y = Ax + B (1)
Substitution of x = xi will in general not give the value of yi
ei = y yi = Axi + B yi (2)
To determine the best straight line that fits the N, sets of data, A and B have to be chosen
simultaneous equations, obtained by equating the partial derivatives of (y
yi)2 with
respect to A and B to zero, should be solved. This condition leads then to the following
results
∆
−
=
∑
∑ ∑
i
i
i i
y
x
x y
N
A
)
(
(3)
and
∆
−
= ∑ ∑
∑ ∑
)
(
i
i
i
i
i
x y
x
y
x
B
2
(4)
where
2
2
(∑ )
∑
−
∆ =
i
i
x
x
N
(5)
The correlation coefficient r provides an indicator of how good a fit the best straight line
is. This coefficient is defined as
∑
∑
∑
−
−
−
−
=
2
2
)
(
)
(
)
)(
(
y
y
x
x
y
y
x
x
r
i
i
i
i
(6)
For r = 0, the values of x and y are independent of one another and there is no linear
correlation. The closer r is to +1 or to 1, the better the linear correlation is.
Finally, the errors in A and B are given by:
∆
−
=
∑
2
2
2
i
A
e
N
N
σ
N
xi
A
B
2
2
2
= σ Σ
σ
(7)