
STAT 201 Final, Fall 2001
American University of Beirut · Elementary Statistics for the Social Sciences · 2 pages
More STAT 201 files
Show the text of this final exam
Not Ts Be laken Ow
: Reserve Reading Room
Time: 2 hours 6/2/02
‘'. MATH 207
isk Semester,01-02
FINAL EXAM
Instructions: 1) Show your work in all the problems. Justify your answers.
2) Give answers correct to 2 decimal places.
1.A normally distributed sample of3000 observations has a mean X = 82 and a
standard deviation s = 16. Find the approximate number of observations that fall in
the intervals X+ 1s, ¥42s and x 43s.
2. At a city high school, past records indicate that the MSAT scores of students have
a mean of 510 and a standard deviation of 90. One hundred students in the high
school are to take the test. What is the probability that their mean score will be
(a) Less than 500?
(b) Between 485 and 520?
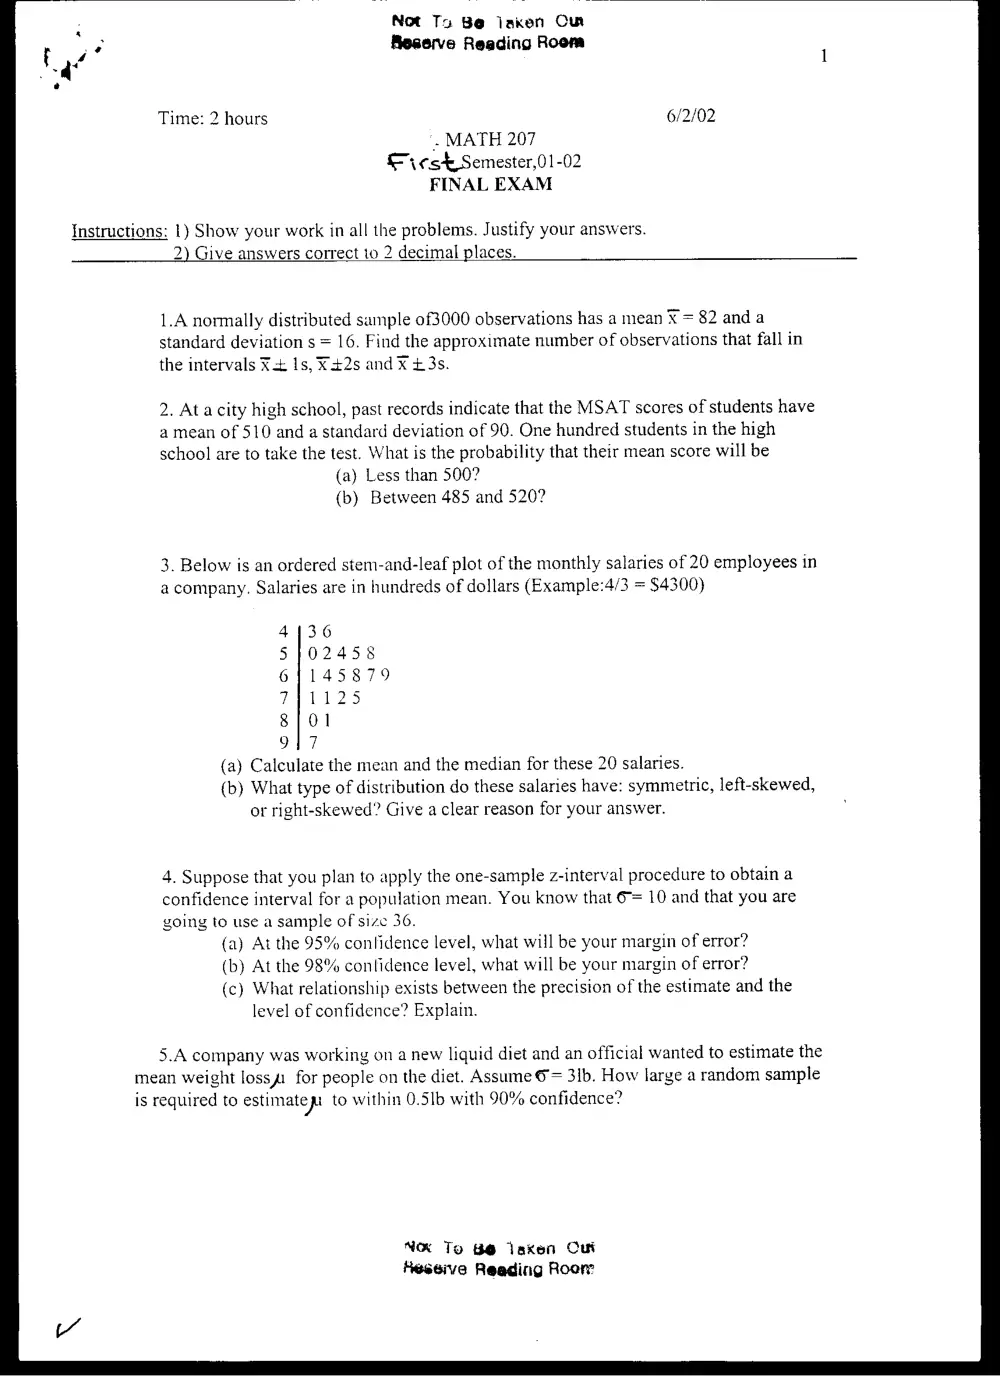
3. Below is an ordered stem-and-leaf plot of the monthly salaries of 20 employees in
a company. Salaries are in hundreds of dollars (Example:4/3 = $4300)
4136
5}02458
61145879
7471125
8] 01
947
(a) Calculate the mean and the median for these 20 salaries.
(b) What type of distribution do these salaries have: symmetric, left-skewed,
or right-skewed? Give a clear reason for your answer.
4. Suppose that you plan to apply the one-sample z-interval procedure to obtain a
confidence interval for a population mean. You know that 6= 10 and that you are
going to use a sample of size 36.
(a) At the 95% confidence level, what will be your margin of error?
(b) At the 98% confidence level, what will be your margin of error?
(c) What relationship exists between the precision of the estimate and the
level of confidence? Explain.
5.A company was working on a new liquid diet and an official wanted to estimate the
mean weight losssi for people on the diet. Assume © = 31b. How large a random sample
is required to estimate pt to within 0.5lb with 90% confidence?
No To #@ Laken Cut
Heseive Reading Room
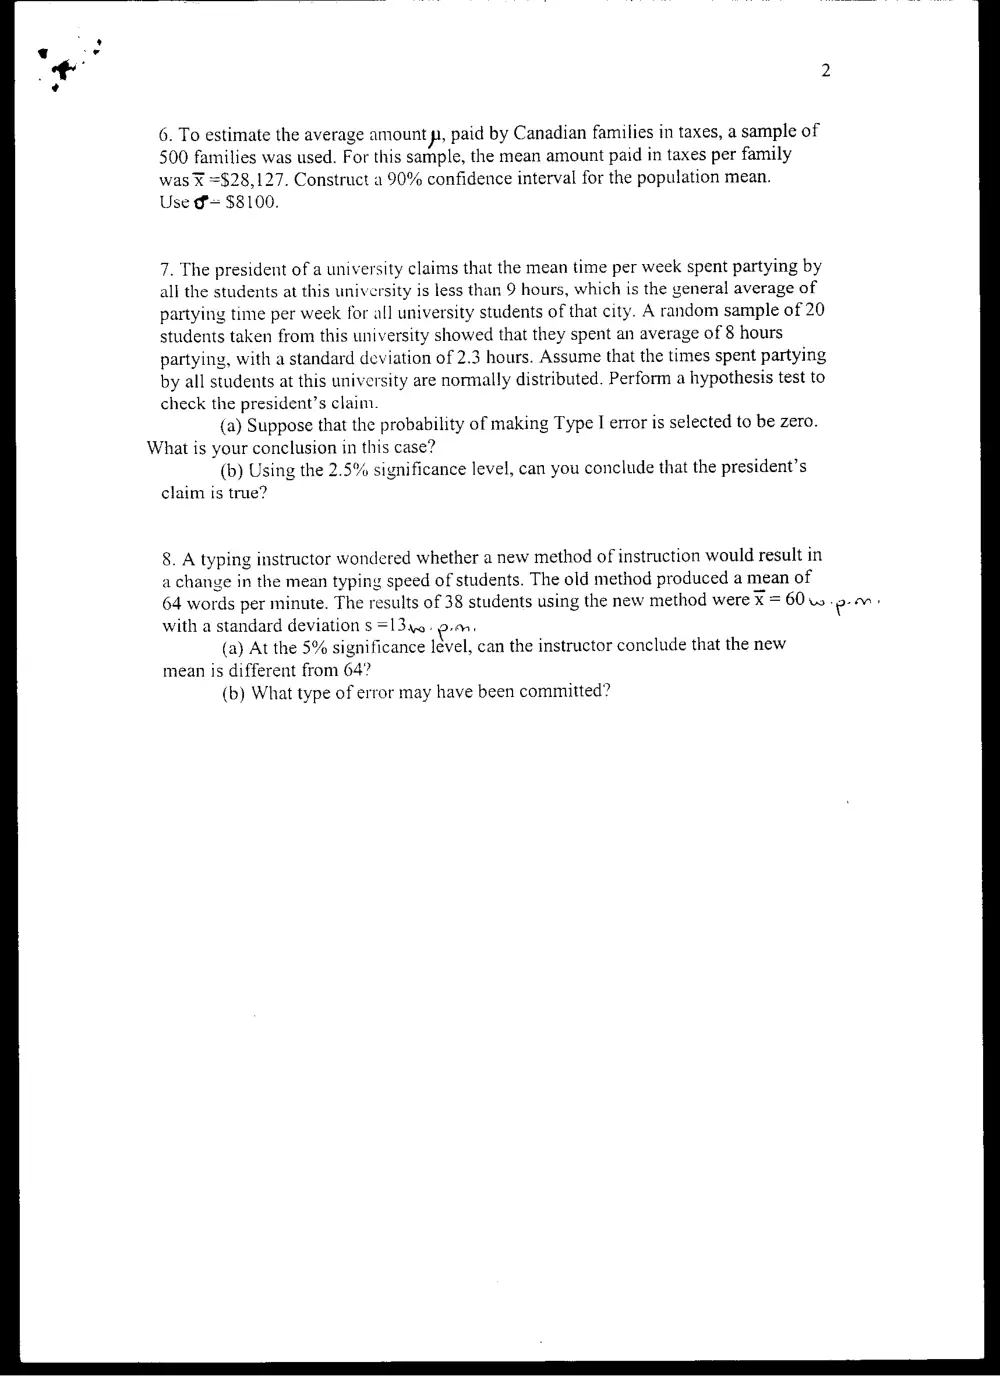
6. To estimate the average amount p, paid by Canadian families in taxes, a sample of
500 families was used. For this sample, the mean amount paid in taxes per family
was X =$28,127. Construct a 90% confidence interval for the population mean.
Use &= $8100.
7. The president of a university claims that the mean time per week spent partying by
all the students at this university is less than 9 hours, which is the general average of
partying time per week for all university students of that city. A random sample of 20
students taken from this university showed that they spent an average of 8 hours
partying, with a standard deviation of 2.3 hours. Assume that the times spent partying
by all students at this university are normally distributed. Perform a hypothesis test to
check the president’s claim.
(a) Suppose that the probability of making Type I error is selected to be zero.
What is your conclusion in this case?
(b) Using the 2.5% significance level, can you conclude that the president’s
claim is true?
8. A typing instructor wondered whether a new method of instruction would result in
a change in the mean typing speed of students. The old method produced a mean of
64 words per minute. The results of 38 students using the new method were X=60w “po
with a standard deviation s =l3y0. 9m,
(a) At the 5% significance level, can the instructor conclude that the new
mean is different from 64?
(b) What type of error may have been committed?