
STAT 201 Final, Fall 2002
American University of Beirut · Elementary Statistics for the Social Sciences · 2 pages
More STAT 201 files
Show the text of this final exam
MERIO\S ONIVERSIT
LIBRARY
OF BEIROT
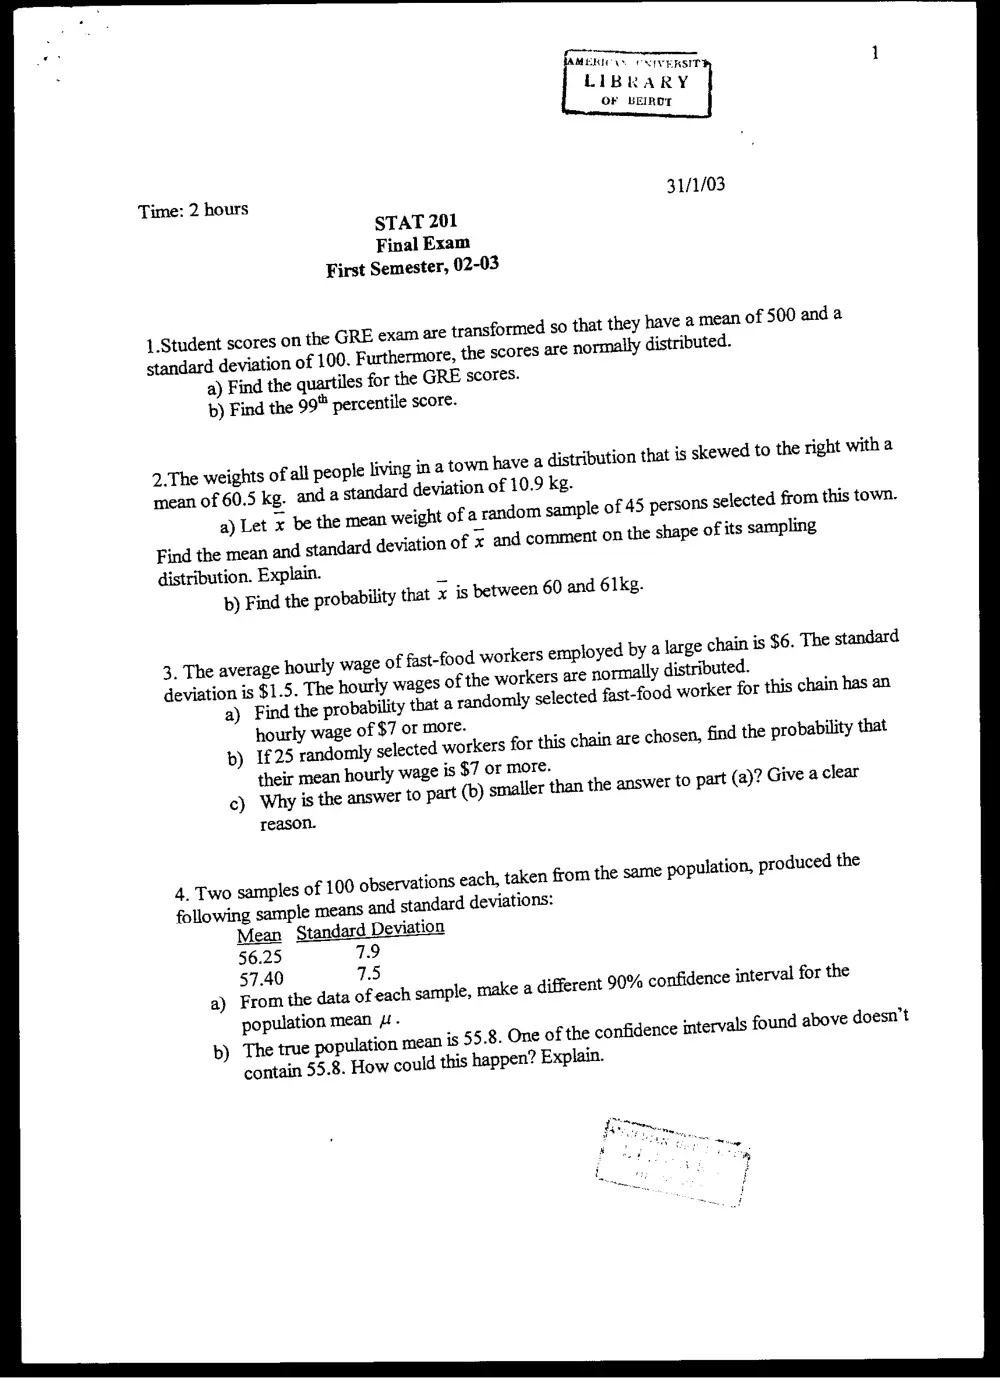
Time: 2 hours
STAT 201
Final Exam
First Semester, 02-03
transformed so that they have a mean of 500 anda
e GRE exam are t
normally distributed.
1.Student scores on th
standard deviation of 100. Furthermore, the scores are
a) Find the quartiles for the GRE scores.
b) Find the 99% percentile score.
eople living in a town have a distribution that is skewed to the right with a
a standard deviation of 10.9 kg.
ght of a random sample
of x and comment on
2. The weights of all p
mean of 60.5 kg. and
a) Let x be the mean wel
Find the mean and standard deviation
distribution. Explain.
b) Find the probability that x is between 60 and 61kg.
of 45 persons selected from this town.
the shape of its sampling
od workers employed by a large chain is 56. The standard
deviation is $1.5. The hourly wages of the workers are normally distributed.
a) Find the probability that a randomly selected fast-food worker for this chain has an
hourly wage of $7 or more.
b) £25 randomly selected workers for this chain are chosen, find the probability that
their mean hourly w
c) Why is the answer to part (b)
reason.
3. The average hourly wage of fast-fo
age is $7 or more.
smaller than the answer to part (a)? Give a clear
the
taken from the same population, produced
le means and standard deviations:
Mean Standard Deviation
56.25 79
57.40 75
nt 90% confidence interval for the
4. Two samples of 100 observations each,
following samp
a) From the data of each sample, make a differe
population mean Ht.
8. One of the confidence intervals found
b) The true population mean is 55.
n? Explain.
contain 55.8. How could this happe'
above doesn’t
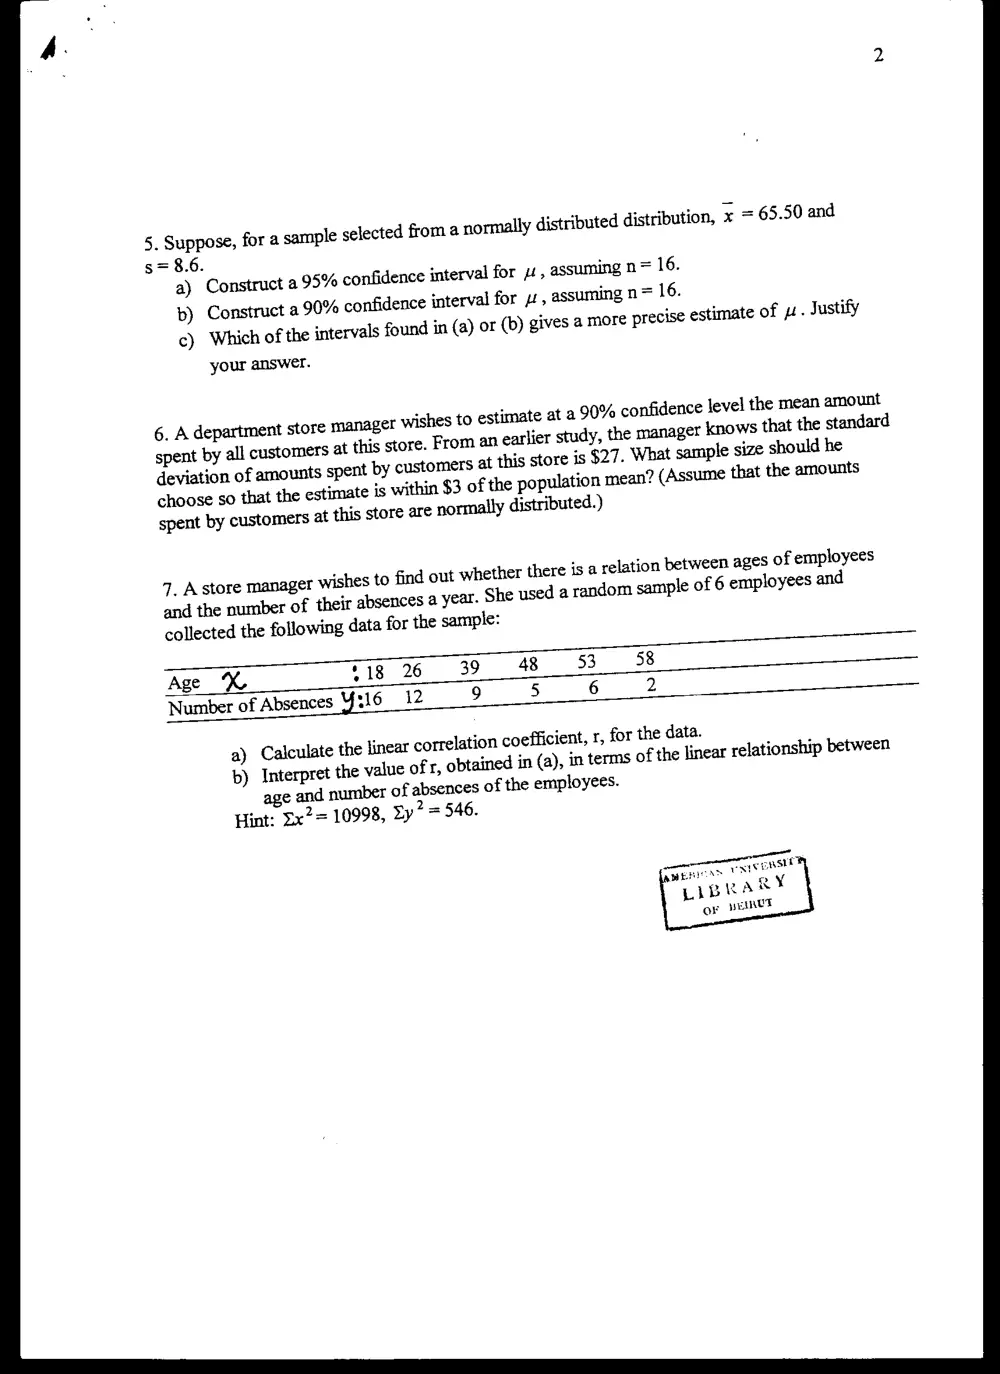
5. Suppose, for a sample selected from a normally distributed distribution, x = 65.50 and
s= 8.6.
a) Construct a 95% confidence interval for 4s, assuming n= 16.
b) Construct a 90% confidence interval for z:, assuming n= 16.
c) Which of the intervals found in (a) or (b) gives a more precise estimate of p. Justify
your answer.
6. A department store manager wishes to estimate at a 90% confidence level the mean amount
spent by all customers at this store. From an earlier study, the manager knows that the standard
deviation of amounts spent by customers at this store is $27. What sample size should he
choose so that the estimate is within $3 of the population mean? (Assume that the amounts
spent by customers at this store are normally distributed.)
7. A store manager wishes to find out whether there is a relation between ages of employees
and the number of their absences a year. She used a random sample of 6 employees and
collected the following data for the sample:
Age % 418 26 39 48 53 58
Number of Absences Yf316 42 9 5 6 2
a) Calculate the linear correlation coefficient, r, for the data.
b) Interpret the value of r, obtained in (a), in terms of the linear relationship between
age and number of absences of the employees.
Hint: Ex2= 10998, Zy? = 546.
BERTON Tx este
LIBRA Ry
OF yEInUy