
STAT 201 Final, Spring 2003
American University of Beirut · Elementary Statistics for the Social Sciences · 2 pages

More STAT 201 files
Show the text of this final exam
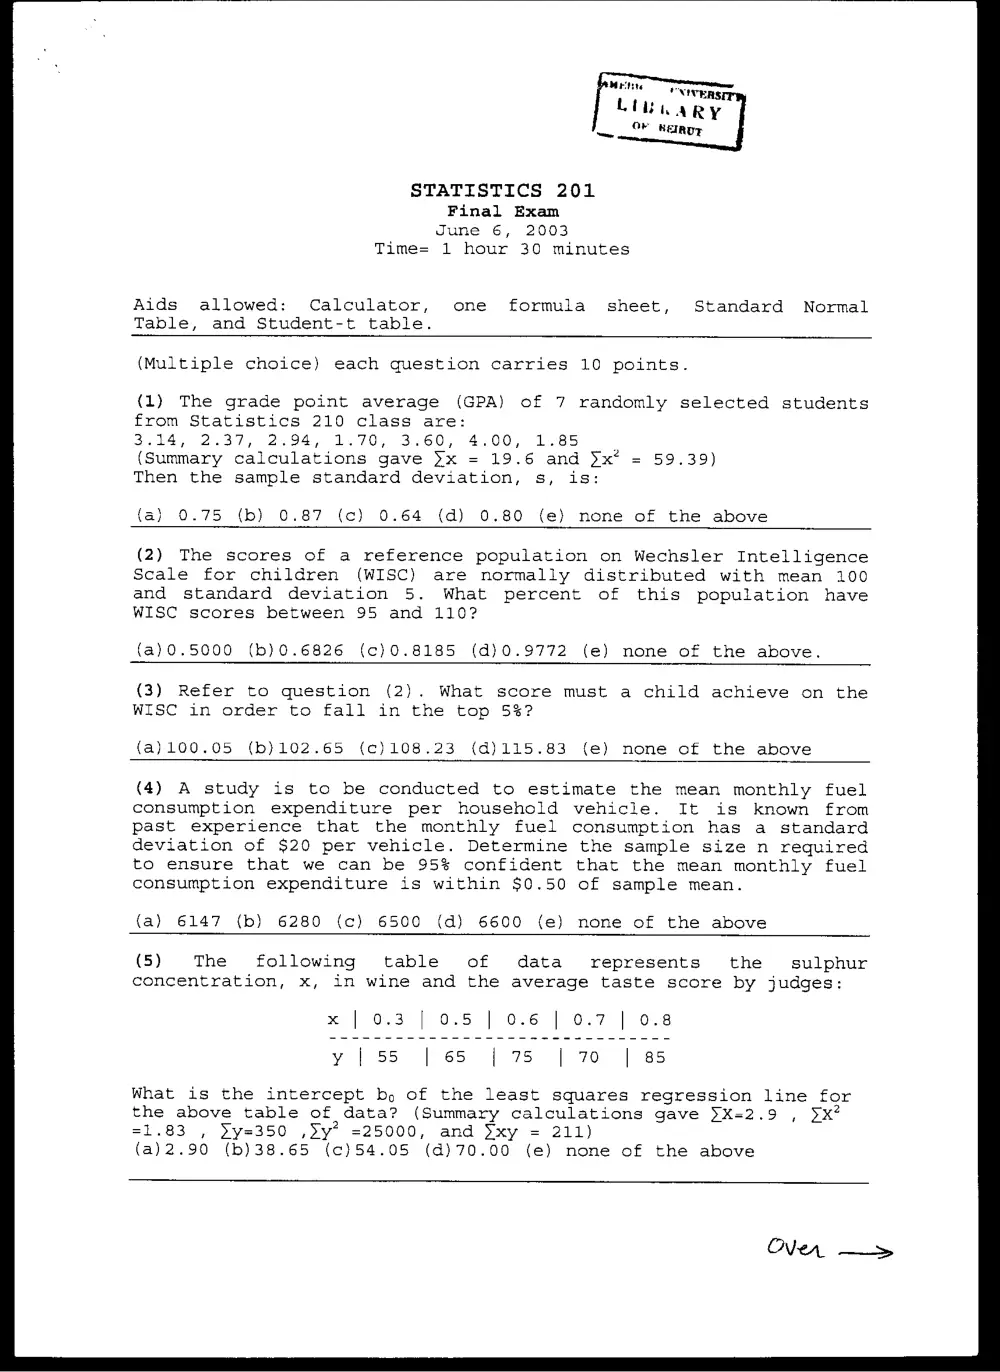
STATISTICS 201
Final Exam
June 6, 2003
Time= 1 hour 30 minutes
Aids allowed: Calculator, one formula sheet, Standard Normal
Table, and Student-t table.
(Multiple choice) each question carries 10 points.
(1) The grade point average (GPA) of 7 randomly selected students
from Statistics 210 class are:
3.14, 2.37, 2.94, 1.70, 3.60, 4.00, 1.85
(Summary calculations gave }x = 19.6 and >x* = 59.39)
Then the sample standard deviation, s, is:
(a) 0.75 (b) 0.87 (c) 0.64 (d) 0.80 (e) none of the above
(2) The scores of a reference population on Wechsler Intelligence
Scale for children (WISC) are normally distributed with mean 100
and standard deviation 5. What percent of this population have
WISC scores between 95 and 110?
(a)0.5000 (b)0.6826 (c)0.8185 (d)0.9772 (e) none of the above.
(3) Refer to question (2). What score must a child achieve on the
WISC in order to fall in the top 5%?
(a) 100.05 (b)102.65 (c)108.23 (d)115.83 (e) none of the above
(4) A study is to be conducted to estimate the mean monthly fuel
consumption expenditure per household vehicle. It is known from
past experience that the monthly fuel consumption has a standard
deviation of $20 per vehicle. Determine the sample size n required
to ensure that we can be 95% confident that the mean monthly fuel
consumption expenditure is within $0.50 of sample mean.
{a) 6147 (b) 6280 (c) 6500 (d) 6600 (e) none of the above
(5) The following table of data represents the sulphur
concentration, x, in wine and the average taste score by judges:
What is the intercept bp of the least squares regression line for
the above table of data? (Summary calculations gave >X=2.9 , Yx?
=1.83 , Yy=350 ,dy* =25000, and Sxy = 211)
(a)2.90 (b)38.65 (c)54.05 (d)70.00 (e) none of the above
en >
(6) Refer to previous question. What percentage of variation in
the y variable has been explained by the linear relationship?
(a) 55% (b) 68% (c) 87% (d) 93% (e) none of the above
(7) The scores of 18 females who have taken a qualifying test are:
101, 103, 109, 115, 126, 126, 129, 137, 137, 140, 148, 152, 154,
154, 165, 165, 178, 200
Which of the following statements is true?
(a) There are no outliers in the above data
(bo) 101 is the only outlying observation
{c) 200 is the only outlying observation
(d) 101 and 200 are both outliers
(8) Acid rain appears to be a growing problem in the North-Western
section of Lebanon. Pure rain falling through clean air registers
a pH value of 5.7 (pH is a measure of acidity; 0 is acid, 14 is
alkaline). Suppose samples of rainfall were collected from 4
different locations in the northwest of Lebanon and analyzed for
pH level. The results gave a mean of 3.7 and a sample standard
deviation s = 0.5. Assume the pH level follow the normal
distribution. Determine the margin of error for 99% confidence
level.
(a)0.32 (b)0.64 (c)0.73 (d)1.46 (e) none of the above
(9) Refer to previous question (8). An environmentalist is
convinced that he has got evidence to show that acid rain has
become significantly lower than the pure rain in the North-Western
part of Lebanon. He formulates a hypothesis to test his claim at
the a = 1% significance level. Then the hypothesis that asserts
his claim is
(a) Ho : : vs Hg
(b) Ho : : vs Ha
(c) Ho : . vs Ha,
(d) Hy : . vs Ha
(e) none of the above
(10) A 95% confidence interval for the mean reading achievement
scores for a population of third grade students is (44.2, 54.2).
Then the margin of error of this interval is
(a) 95% (b) 5 (c) 10 (da) 54.2 (e) none of the above