
STAT 230 Problems, Summer 2011
American University of Beirut · Introduction to Probability and Random Variables · 181 pages



Showing the first 10 of 181 pages. Download the PDF to see all of it.
More STAT 230 files
- Problems Set 1 · Fall 2012ProblemsView
- Problems Set 2 · Fall 2012ProblemsView
- Chapter 2 · Spring 2020ChapterView
- Chapter 2 · Spring 2020ChapterView
- Syllabus · Spring 2020LabView
- Lecture 4- Examples About Chapters 2.4 · Spring 2019LabView
- Useful File Solution Manual · Spring 2019File · with solutionView
- Lecture 1- Chapter 1 · Spring 2019LabView
Show the text of this problems
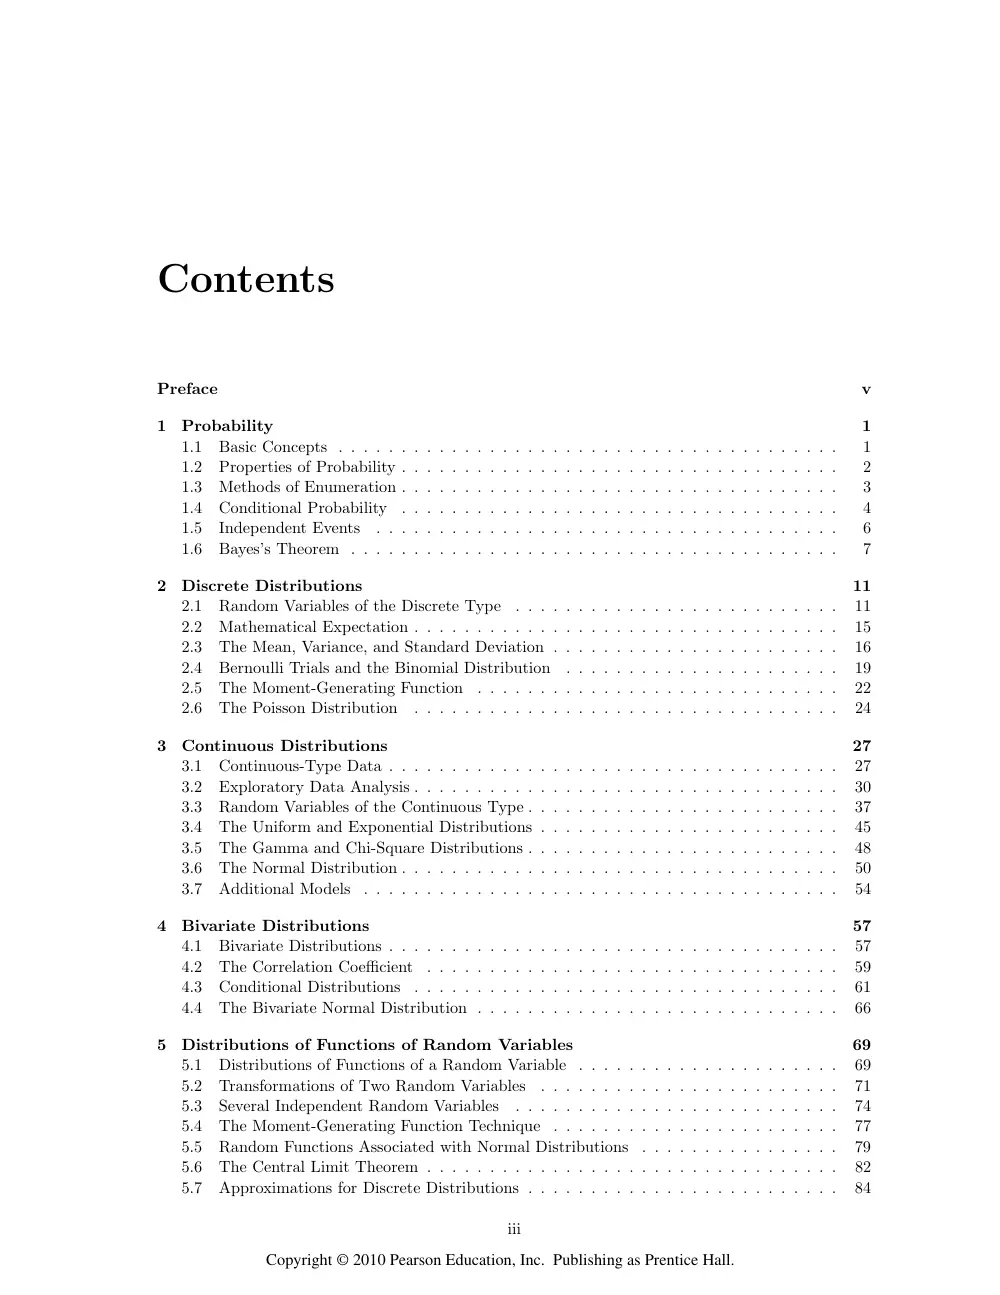
Contents
Preface
v
1
Probability
1
1.1
Basic Concepts . . . . . . . . . . . . . . . . . . . . . . . . . . . . . . . . . . . . . . . .
1
1.2
Properties of Probability . . . . . . . . . . . . . . . . . . . . . . . . . . . . . . . . . . .
2
1.3
Methods of Enumeration . . . . . . . . . . . . . . . . . . . . . . . . . . . . . . . . . . .
3
1.4
Conditional Probability
. . . . . . . . . . . . . . . . . . . . . . . . . . . . . . . . . . .
4
1.5
Independent Events
. . . . . . . . . . . . . . . . . . . . . . . . . . . . . . . . . . . . .
6
1.6
Bayes’s Theorem . . . . . . . . . . . . . . . . . . . . . . . . . . . . . . . . . . . . . . .
7
2
Discrete Distributions
11
2.1
Random Variables of the Discrete Type
. . . . . . . . . . . . . . . . . . . . . . . . . .
11
2.2
Mathematical Expectation . . . . . . . . . . . . . . . . . . . . . . . . . . . . . . . . . .
15
2.3
The Mean, Variance, and Standard Deviation . . . . . . . . . . . . . . . . . . . . . . .
16
2.4
Bernoulli Trials and the Binomial Distribution
. . . . . . . . . . . . . . . . . . . . . .
19
2.5
The Moment-Generating Function
. . . . . . . . . . . . . . . . . . . . . . . . . . . . .
22
2.6
The Poisson Distribution
. . . . . . . . . . . . . . . . . . . . . . . . . . . . . . . . . .
24
3
Continuous Distributions
27
3.1
Continuous-Type Data . . . . . . . . . . . . . . . . . . . . . . . . . . . . . . . . . . . .
27
3.2
Exploratory Data Analysis . . . . . . . . . . . . . . . . . . . . . . . . . . . . . . . . . .
30
3.3
Random Variables of the Continuous Type . . . . . . . . . . . . . . . . . . . . . . . . .
37
3.4
The Uniform and Exponential Distributions . . . . . . . . . . . . . . . . . . . . . . . .
45
3.5
The Gamma and Chi-Square Distributions . . . . . . . . . . . . . . . . . . . . . . . . .
48
3.6
The Normal Distribution . . . . . . . . . . . . . . . . . . . . . . . . . . . . . . . . . . .
50
3.7
Additional Models
. . . . . . . . . . . . . . . . . . . . . . . . . . . . . . . . . . . . . .
54
4
Bivariate Distributions
57
4.1
Bivariate Distributions . . . . . . . . . . . . . . . . . . . . . . . . . . . . . . . . . . . .
57
4.2
The Correlation Coefficient
. . . . . . . . . . . . . . . . . . . . . . . . . . . . . . . . .
59
4.3
Conditional Distributions
. . . . . . . . . . . . . . . . . . . . . . . . . . . . . . . . . .
61
4.4
The Bivariate Normal Distribution . . . . . . . . . . . . . . . . . . . . . . . . . . . . .
66
5
Distributions of Functions of Random Variables
69
5.1
Distributions of Functions of a Random Variable . . . . . . . . . . . . . . . . . . . . .
69
5.2
Transformations of Two Random Variables
. . . . . . . . . . . . . . . . . . . . . . . .
71
5.3
Several Independent Random Variables
. . . . . . . . . . . . . . . . . . . . . . . . . .
74
5.4
The Moment-Generating Function Technique . . . . . . . . . . . . . . . . . . . . . . .
77
5.5
Random Functions Associated with Normal Distributions
. . . . . . . . . . . . . . . .
79
5.6
The Central Limit Theorem . . . . . . . . . . . . . . . . . . . . . . . . . . . . . . . . .
82
5.7
Approximations for Discrete Distributions . . . . . . . . . . . . . . . . . . . . . . . . .
84
iii
Copyright © 2010 Pearson Education, Inc. Publishing as Prentice Hall.
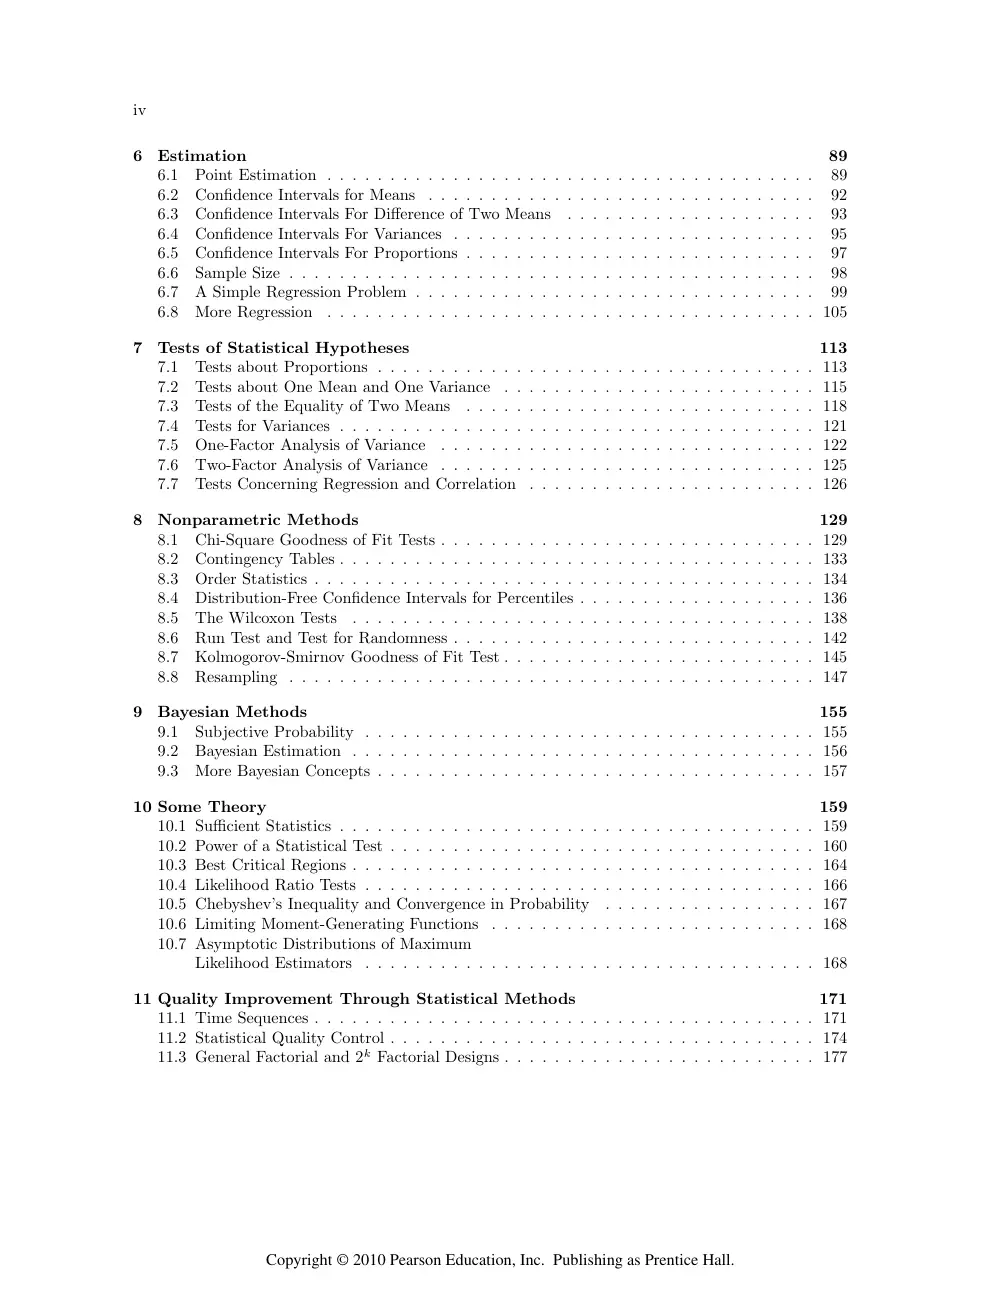
iv
6
Estimation
89
6.1
Point Estimation . . . . . . . . . . . . . . . . . . . . . . . . . . . . . . . . . . . . . . .
89
6.2
Confidence Intervals for Means . . . . . . . . . . . . . . . . . . . . . . . . . . . . . . .
92
6.3
Confidence Intervals For Difference of Two Means
. . . . . . . . . . . . . . . . . . . .
93
6.4
Confidence Intervals For Variances . . . . . . . . . . . . . . . . . . . . . . . . . . . . .
95
6.5
Confidence Intervals For Proportions . . . . . . . . . . . . . . . . . . . . . . . . . . . .
97
6.6
Sample Size . . . . . . . . . . . . . . . . . . . . . . . . . . . . . . . . . . . . . . . . . .
98
6.7
A Simple Regression Problem . . . . . . . . . . . . . . . . . . . . . . . . . . . . . . . .
99
6.8
More Regression
. . . . . . . . . . . . . . . . . . . . . . . . . . . . . . . . . . . . . . . 105
7
Tests of Statistical Hypotheses
113
7.1
Tests about Proportions . . . . . . . . . . . . . . . . . . . . . . . . . . . . . . . . . . . 113
7.2
Tests about One Mean and One Variance
. . . . . . . . . . . . . . . . . . . . . . . . . 115
7.3
Tests of the Equality of Two Means
. . . . . . . . . . . . . . . . . . . . . . . . . . . . 118
7.4
Tests for Variances . . . . . . . . . . . . . . . . . . . . . . . . . . . . . . . . . . . . . . 121
7.5
One-Factor Analysis of Variance
. . . . . . . . . . . . . . . . . . . . . . . . . . . . . . 122
7.6
Two-Factor Analysis of Variance
. . . . . . . . . . . . . . . . . . . . . . . . . . . . . . 125
7.7
Tests Concerning Regression and Correlation
. . . . . . . . . . . . . . . . . . . . . . . 126
8
Nonparametric Methods
129
8.1
Chi-Square Goodness of Fit Tests . . . . . . . . . . . . . . . . . . . . . . . . . . . . . . 129
8.2
Contingency Tables . . . . . . . . . . . . . . . . . . . . . . . . . . . . . . . . . . . . . . 133
8.3
Order Statistics . . . . . . . . . . . . . . . . . . . . . . . . . . . . . . . . . . . . . . . . 134
8.4
Distribution-Free Confidence Intervals for Percentiles . . . . . . . . . . . . . . . . . . . 136
8.5
The Wilcoxon Tests
. . . . . . . . . . . . . . . . . . . . . . . . . . . . . . . . . . . . . 138
8.6
Run Test and Test for Randomness . . . . . . . . . . . . . . . . . . . . . . . . . . . . . 142
8.7
Kolmogorov-Smirnov Goodness of Fit Test . . . . . . . . . . . . . . . . . . . . . . . . . 145
8.8
Resampling . . . . . . . . . . . . . . . . . . . . . . . . . . . . . . . . . . . . . . . . . . 147
9
Bayesian Methods
155
9.1
Subjective Probability . . . . . . . . . . . . . . . . . . . . . . . . . . . . . . . . . . . . 155
9.2
Bayesian Estimation . . . . . . . . . . . . . . . . . . . . . . . . . . . . . . . . . . . . . 156
9.3
More Bayesian Concepts . . . . . . . . . . . . . . . . . . . . . . . . . . . . . . . . . . . 157
10 Some Theory
159
10.1 Sufficient Statistics . . . . . . . . . . . . . . . . . . . . . . . . . . . . . . . . . . . . . . 159
10.2 Power of a Statistical Test . . . . . . . . . . . . . . . . . . . . . . . . . . . . . . . . . . 160
10.3 Best Critical Regions . . . . . . . . . . . . . . . . . . . . . . . . . . . . . . . . . . . . . 164
10.4 Likelihood Ratio Tests . . . . . . . . . . . . . . . . . . . . . . . . . . . . . . . . . . . . 166
10.5 Chebyshev’s Inequality and Convergence in Probability
. . . . . . . . . . . . . . . . . 167
10.6 Limiting Moment-Generating Functions . . . . . . . . . . . . . . . . . . . . . . . . . . 168
10.7 Asymptotic Distributions of Maximum
Likelihood Estimators . . . . . . . . . . . . . . . . . . . . . . . . . . . . . . . . . . . . 168
11 Quality Improvement Through Statistical Methods
171
11.1 Time Sequences . . . . . . . . . . . . . . . . . . . . . . . . . . . . . . . . . . . . . . . . 171
11.2 Statistical Quality Control . . . . . . . . . . . . . . . . . . . . . . . . . . . . . . . . . . 174
11.3 General Factorial and 2k Factorial Designs . . . . . . . . . . . . . . . . . . . . . . . . . 177
Copyright © 2010 Pearson Education, Inc. Publishing as Prentice Hall.
Preface
This solutions manual provides answers for the even-numbered exercises in Probability and Statistical
Inference, 8th edition, by Robert V. Hogg and Elliot A. Tanis. Complete solutions are given for most
of these exercises. You, the instructor, may decide how many of these answers you want to make
available to your students. Note that the answers for the odd-numbered exercises are given in the
textbook.
All of the figures in this manual were generated using Maple, a computer algebra system. Most
of the figures were generated and many of the solutions, especially those involving data, were solved
using procedures that were written by Zaven Karian from Denison University. We thank him for
providing these. These procedures are available free of charge for your use. They are available on the
CD-ROM in the textbook. Short descriptions of these procedures are provided on the “Maple Card”
on the CD-ROM. Complete descriptions of these procedures are given in Probability and Statistics:
Explorations with MAPLE, second edition, 1999, written by Zaven Karian and Elliot Tanis, published
by Prentice Hall (ISBN 0-13-021536-8).
Our hope is that this solutions manual will be helpful to each of you in your teaching.
If you find an error or wish to make a suggestion, send these to Elliot Tanis at tanis@hope.edu
and he will post corrections on his web page, http://www.math.hope.edu/tanis/.
R.V.H.
E.A.T.
v
Copyright © 2010 Pearson Education, Inc. Publishing as Prentice Hall.
Chapter 1
Probability
1.1
Basic Concepts
1.1-2 (a) S = {bbb, gbb, bgb, bbg, bgg, gbg, ggb, ggg};
(b) S = {female, male};
(c) S = {000, 001, 002, 003, . . . , 999}.
1.1-4 (a)
Clutch size:
4
5
6
7
8
9
10
11
12
13
14
Frequency:
3
5
7
27
26
37
8
2
0
1
1
(b)
x
h(x)
0.05
0.10
0.15
0.20
0.25
0.30
2
4
6
8
10
12
14
Figure 1.1–4: Clutch sizes for the common gallinule
(c) 9.
1
Copyright © 2010 Pearson Education, Inc. Publishing as Prentice Hall.
2
Chapter 1
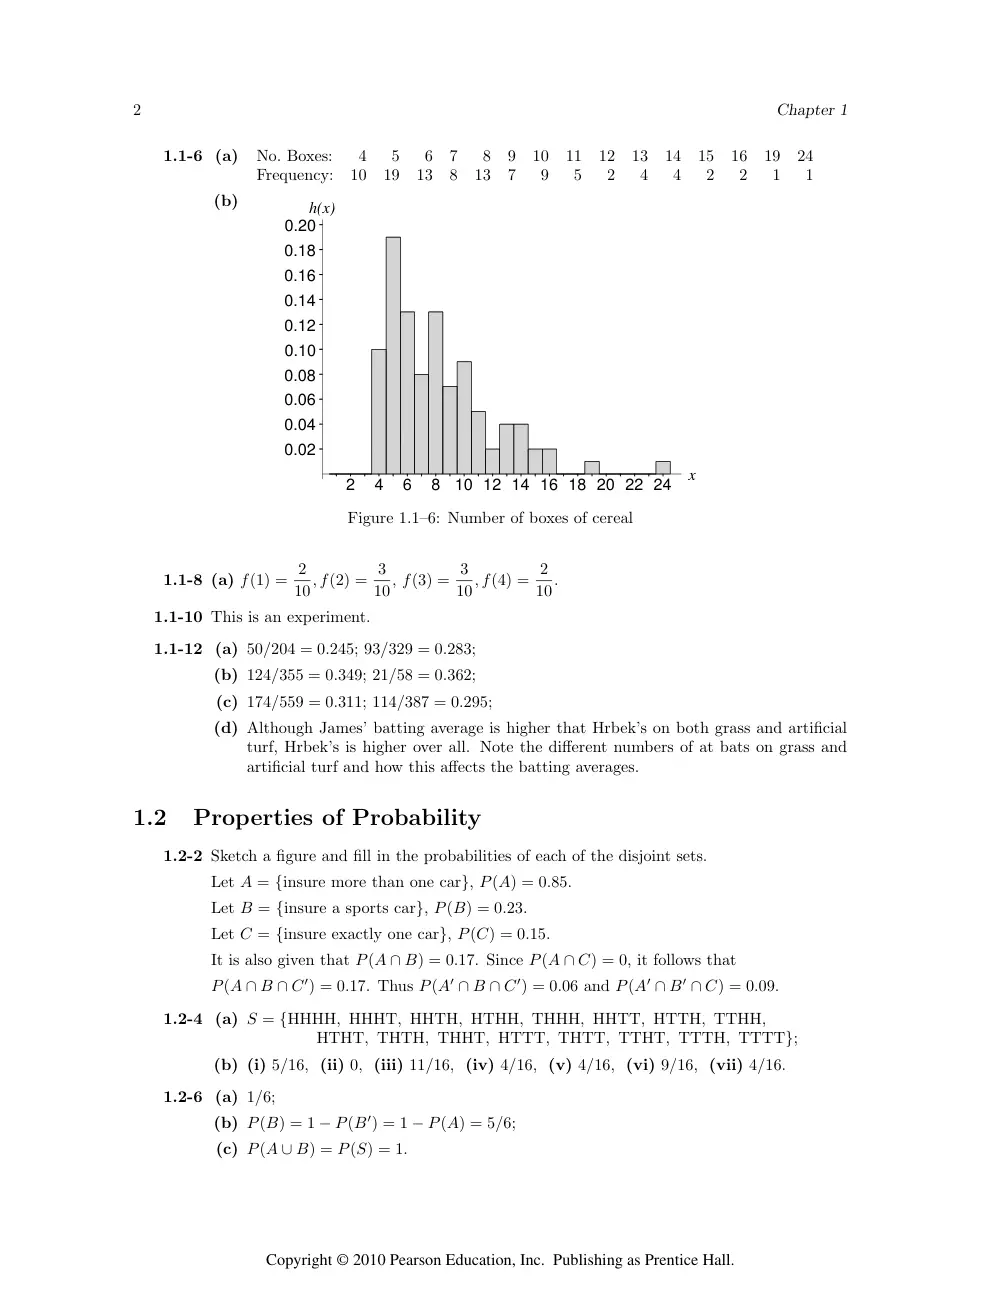
1.1-6 (a)
No. Boxes:
4
5
6
7
8
9
10
11
12
13
14
15
16
19
24
Frequency:
10
19
13
8
13
7
9
5
2
4
4
2
2
1
1
(b)
x
h(x)
0.02
0.04
0.06
0.08
0.10
0.12
0.14
0.16
0.18
0.20
2
4
6
8
10 12 14 16 18 20 22 24
Figure 1.1–6: Number of boxes of cereal
1.1-8 (a) f(1) = 2
10, f(2) = 3
10, f(3) = 3
10, f(4) = 2
10.
1.1-10 This is an experiment.
1.1-12 (a) 50/204 = 0.245; 93/329 = 0.283;
(b) 124/355 = 0.349; 21/58 = 0.362;
(c) 174/559 = 0.311; 114/387 = 0.295;
(d) Although James’ batting average is higher that Hrbek’s on both grass and artificial
turf, Hrbek’s is higher over all. Note the different numbers of at bats on grass and
artificial turf and how this affects the batting averages.
1.2
Properties of Probability
1.2-2 Sketch a figure and fill in the probabilities of each of the disjoint sets.
Let A = {insure more than one car}, P(A) = 0.85.
Let B = {insure a sports car}, P(B) = 0.23.
Let C = {insure exactly one car}, P(C) = 0.15.
It is also given that P(A ∩ B) = 0.17. Since P(A ∩ C) = 0, it follows that
P(A ∩ B ∩ C′) = 0.17. Thus P(A′ ∩ B ∩ C′) = 0.06 and P(A′ ∩ B′ ∩ C) = 0.09.
1.2-4 (a) S = {HHHH, HHHT, HHTH, HTHH, THHH, HHTT, HTTH, TTHH,
HTHT, THTH, THHT, HTTT, THTT, TTHT, TTTH, TTTT};
(b) (i) 5/16, (ii) 0, (iii) 11/16, (iv) 4/16, (v) 4/16, (vi) 9/16, (vii) 4/16.
1.2-6 (a) 1/6;
(b) P(B) = 1 − P(B′) = 1 − P(A) = 5/6;
(c) P(A ∪ B) = P(S) = 1.
Copyright © 2010 Pearson Education, Inc. Publishing as Prentice Hall.
Probability
3
1.2-8 (a) P(A ∪ B) = 0.4 + 0.5 − 0.3 = 0.6;
(b)
A
=
(A ∩ B′) ∪ (A ∩ B)
P(A)
=
P(A ∩ B′) + P(A ∩ B)
0.4
=
P(A ∩ B′) + 0.3
P(A ∩ B)
=
0.1;
(c) P(A′ ∪ B′) = P[(A ∩ B)′] = 1 − P(A ∩ B) = 1 − 0.3 = 0.7.
1.2-10 Let A ={lab work done}, B ={referral to a specialist},
P(A) = 0.41, P(B) = 0.53, P([A ∪ B]′) = 0.21.
P(A ∪ B)
=
P(A) + P(B) − P(A ∩ B)
0.79
=
0.41 + 0.53 − P(A ∩ B)
P(A ∩ B)
=
0.41 + 0.53 − 0.79 = 0.15.
1.2-12
A ∪ B ∪ C
=
A ∪ (B ∪ C)
P(A ∪ B ∪ C)
=
P(A) + P(B ∪ C) − P[A ∩ (B ∪ C)]
=
P(A) + P(B) + P(C) − P(B ∩ C) − P[(A ∩ B) ∪ (A ∩ C)]
=
P(A) + P(B) + P(C) − P(B ∩ C) − P(A ∩ B) − P(A ∩ C)
+ P(A ∩ B ∩ C).
1.2-14 (a) 1/3; (b) 2/3; (c) 0; (d) 1/2.
1.2-16 (a) S = {(1, 2), (1, 3), (1, 4), (1, 5), (2, 3), (2, 4), (2, 5), (3, 4), (3, 5), (4, 5)};
(b) (i) 1/10; (ii) 5/10.
1.2-18 P(A) = 2[r − r(
√
3/2)]
2r
= 1 −
√
3
2 .
1.2-20 Note that the respective probabilities are p0, p1 = p0/4, p2 = p0/42, . . ..
∞
�
k=0
p0
4k
=
1
p0
1 − 1/4
=
1
p0
=
3
4
1 − p0 − p1 = 1 − 15
16 = 1
16.
1.3
Methods of Enumeration
1.3-2 (4)(3)(2) = 24.
1.3-4 (a) (4)(5)(2) = 40; (b) (2)(2)(2) = 8.
1.3-6 (a) 4
�6
3
�
= 80;
(b) 4(26) = 256;
(c) (4 − 1 + 3)!
(4 − 1)!3!
= 20.
1.3-8
9P4 = 9!
5! = 3024.
Copyright © 2010 Pearson Education, Inc. Publishing as Prentice Hall.
4
Chapter 1
1.3-10 S ={ HHH, HHCH, HCHH, CHHH, HHCCH, HCHCH, CHHCH, HCCHH,
CHCHH, CCHHH, CCC, CCHC, CHCC, HCCC, CCHHC, CHCHC,
HCCHC, CHHCC, HCHCC, HHCCC }
so there are 20 possibilities.
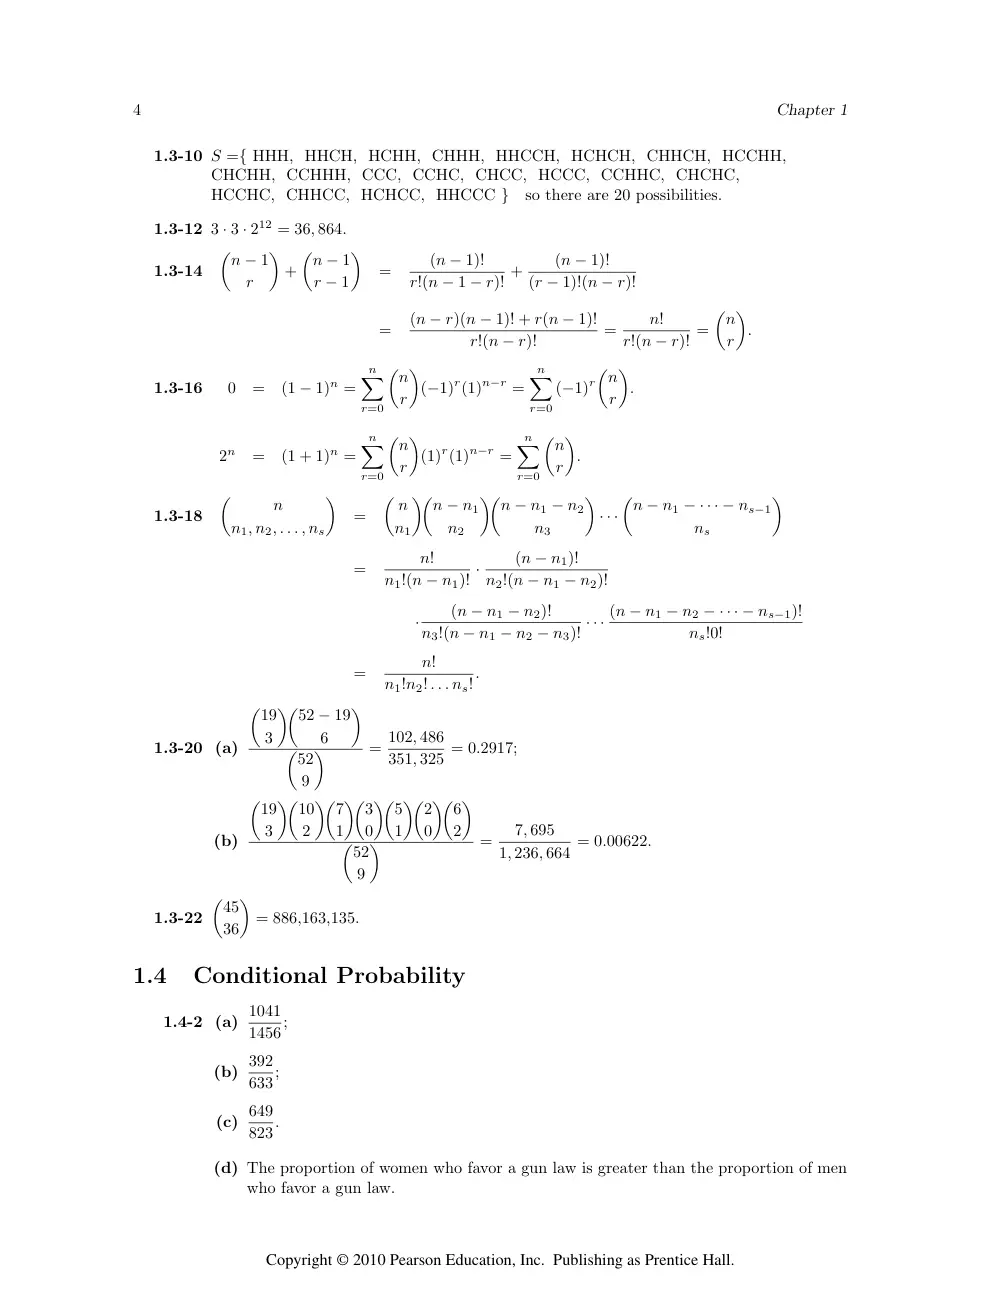
1.3-12 3 · 3 · 212 = 36, 864.
1.3-14
�n − 1
r
�
+
�n − 1
r − 1
�
=
(n − 1)!
r!(n − 1 − r)! +
(n − 1)!
(r − 1)!(n − r)!
=
(n − r)(n − 1)! + r(n − 1)!
r!(n − r)!
=
n!
r!(n − r)! =
�n
r
�
.
1.3-16
0
=
(1 − 1)n =
n
�
r=0
�n
r
�
(−1)r(1)n−r =
n
�
r=0
(−1)r
�n
r
�
.
2n
=
(1 + 1)n =
n
�
r=0
�n
r
�
(1)r(1)n−r =
n
�
r=0
�n
r
�
.
1.3-18
�
n
n1, n2, . . . , ns
�
=
� n
n1
��n − n1
n2
��n − n1 − n2
n3
�
· · ·
�n − n1 − · · · − ns−1
ns
�
=
n!
n1!(n − n1)! ·
(n − n1)!
n2!(n − n1 − n2)!
·
(n − n1 − n2)!
n3!(n − n1 − n2 − n3)! · · · (n − n1 − n2 − · · · − ns−1)!
ns!0!
=
n!
n1!n2! . . . ns!.
1.3-20 (a)
�19
3
��52 − 19
6
�
�52
9
�
= 102, 486
351, 325 = 0.2917;
(b)
�19
3
��10
2
��7
1
��3
0
��5
1
��2
0
��6
2
�
�52
9
�
=
7, 695
1, 236, 664 = 0.00622.
1.3-22
�45
36
�
= 886,163,135.
1.4
Conditional Probability
1.4-2 (a) 1041
1456;
(b) 392
633;
(c) 649
823.
(d) The proportion of women who favor a gun law is greater than the proportion of men
who favor a gun law.
Copyright © 2010 Pearson Education, Inc. Publishing as Prentice Hall.
Probability
5
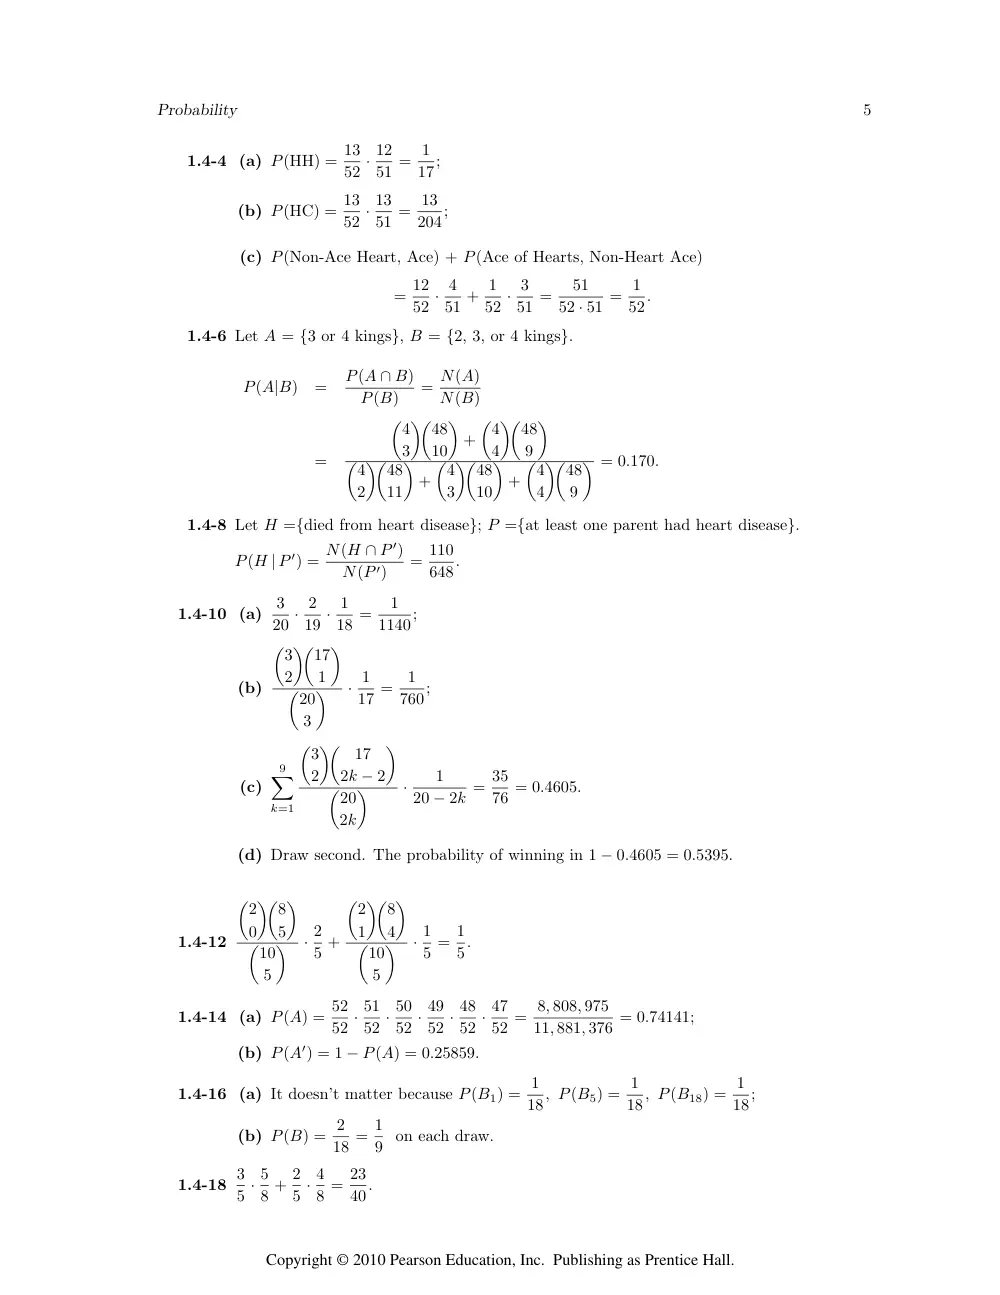
1.4-4 (a) P(HH) = 13
52 · 12
51 = 1
17;
(b) P(HC) = 13
52 · 13
51 = 13
204;
(c) P(Non-Ace Heart, Ace) + P(Ace of Hearts, Non-Heart Ace)
= 12
52 · 4
51 + 1
52 · 3
51 =
51
52 · 51 = 1
52.
1.4-6 Let A = {3 or 4 kings}, B = {2, 3, or 4 kings}.
P(A|B)
=
P(A ∩ B)
P(B)
= N(A)
N(B)
=
�4
3
��48
10
�
+
�4
4
��48
9
�
�4
2
��48
11
�
+
�4
3
��48
10
�
+
�4
4
��48
9
� = 0.170.
1.4-8 Let H ={died from heart disease}; P ={at least one parent had heart disease}.
P(H | P ′) = N(H ∩ P ′)
N(P ′)
= 110
648.
1.4-10 (a)
3
20 · 2
19 · 1
18 =
1
1140;
(b)
�3
2
��17
1
�
�20
3
�
· 1
17 =
1
760;
(c)
9
�
k=1
�3
2
��
17
2k − 2
�
�20
2k
�
·
1
20 − 2k = 35
76 = 0.4605.
(d) Draw second. The probability of winning in 1 − 0.4605 = 0.5395.
1.4-12
�2
0
��8
5
�
�10
5
�
· 2
5 +
�2
1
��8
4
�
�10
5
�
· 1
5 = 1
5.
1.4-14 (a) P(A) = 52
52 · 51
52 · 50
52 · 49
52 · 48
52 · 47
52 = 8, 808, 975
11, 881, 376 = 0.74141;
(b) P(A′) = 1 − P(A) = 0.25859.
1.4-16 (a) It doesn’t matter because P(B1) = 1
18, P(B5) = 1
18, P(B18) = 1
18;
(b) P(B) = 2
18 = 1
9 on each draw.
1.4-18 3
5 · 5
8 + 2
5 · 4
8 = 23
40.
Copyright © 2010 Pearson Education, Inc. Publishing as Prentice Hall.
6
Chapter 1
1.4-20 (a) P(A1) = 30/100;
(b) P(A3 ∩ B2) = 9/100;
(c) P(A2 ∪ B3) = 41/100 + 28/100 − 9/100 = 60/100;
(d) P(A1 | B2) = 11/41;
(e) P(B1 | A3) = 13/29.
1.5
Independent Events
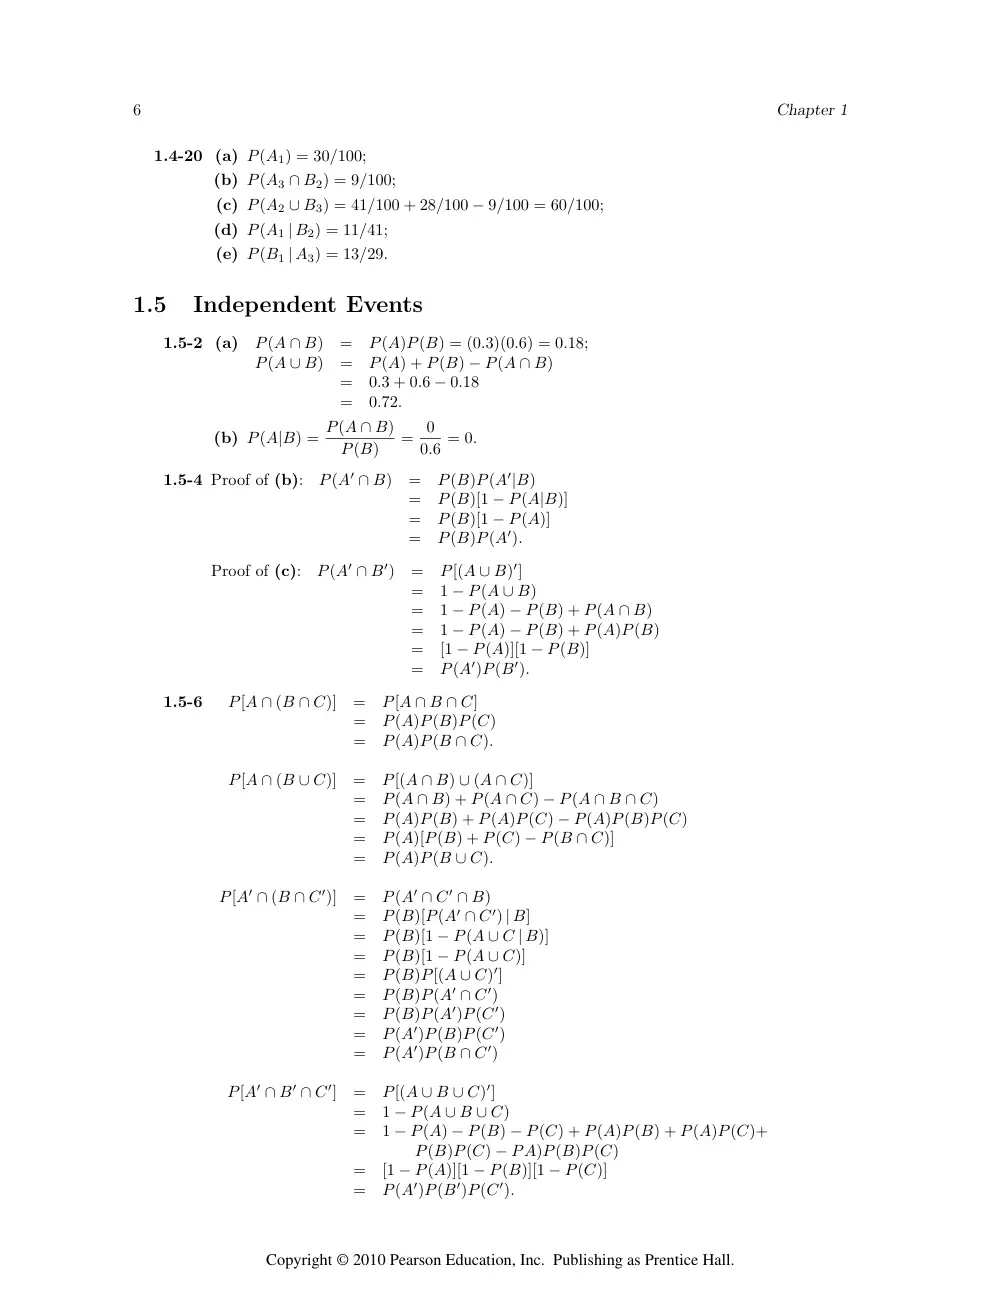
1.5-2 (a)
P(A ∩ B)
=
P(A)P(B) = (0.3)(0.6) = 0.18;
P(A ∪ B)
=
P(A) + P(B) − P(A ∩ B)
=
0.3 + 0.6 − 0.18
=
0.72.
(b) P(A|B) = P(A ∩ B)
P(B)
= 0
0.6 = 0.
1.5-4 Proof of (b):
P(A′ ∩ B)
=
P(B)P(A′|B)
=
P(B)[1 − P(A|B)]
=
P(B)[1 − P(A)]
=
P(B)P(A′).
Proof of (c):
P(A′ ∩ B′)
=
P[(A ∪ B)′]
=
1 − P(A ∪ B)
=
1 − P(A) − P(B) + P(A ∩ B)
=
1 − P(A) − P(B) + P(A)P(B)
=
[1 − P(A)][1 − P(B)]
=
P(A′)P(B′).
1.5-6
P[A ∩ (B ∩ C)]
=
P[A ∩ B ∩ C]
=
P(A)P(B)P(C)
=
P(A)P(B ∩ C).
P[A ∩ (B ∪ C)]
=
P[(A ∩ B) ∪ (A ∩ C)]
=
P(A ∩ B) + P(A ∩ C) − P(A ∩ B ∩ C)
=
P(A)P(B) + P(A)P(C) − P(A)P(B)P(C)
=
P(A)[P(B) + P(C) − P(B ∩ C)]
=
P(A)P(B ∪ C).
P[A′ ∩ (B ∩ C′)]
=
P(A′ ∩ C′ ∩ B)
=
P(B)[P(A′ ∩ C′) | B]
=
P(B)[1 − P(A ∪ C | B)]
=
P(B)[1 − P(A ∪ C)]
=
P(B)P[(A ∪ C)′]
=
P(B)P(A′ ∩ C′)
=
P(B)P(A′)P(C′)
=
P(A′)P(B)P(C′)
=
P(A′)P(B ∩ C′)
P[A′ ∩ B′ ∩ C′]
=
P[(A ∪ B ∪ C)′]
=
1 − P(A ∪ B ∪ C)
=
1 − P(A) − P(B) − P(C) + P(A)P(B) + P(A)P(C)+
P(B)P(C) − PA)P(B)P(C)
=
[1 − P(A)][1 − P(B)][1 − P(C)]
=
P(A′)P(B′)P(C′).
Copyright © 2010 Pearson Education, Inc. Publishing as Prentice Hall.
Probability
7
1.5-8
1
6 · 2
6 · 3
6 + 1
6 · 4
6 · 3
6 + 5
6 · 2
6 · 3
6 = 2
9.
1.5-10 (a) 3
4 · 3
4 = 9
16;
(b) 1
4 · 3
4 + 3
4 · 2
4 = 9
16;
(c) 2
4 · 1
4 + 2
4 · 4
4 = 10
16.
1.5-12 (a)
�1
2
�3�1
2
�2
;
(b)
�1
2
�3�1
2
�2
;
(c)
�1
2
�3�1
2
�2
;
(d)
5!
3! 2!
�1
2
�3�1
2
�2
.
1.5-14 (a) 1 − (0.4)3 = 1 − 0.064 = 0.936;
(b) 1 − (0.4)8 = 1 − 0.00065536 = 0.99934464.
1.5-16 (a)
∞
�
k=0
1
5
�4
5
�2k
= 5
9;
(b) 1
5 + 4
5 · 3
4 · 1
3 + 4
5 · 3
4 · 2
3 · 1
2 · 1
1 = 3
5.
1.5-18 (a) 7; (b) (1/2)7; (c) 63; (d) No! (1/2)63 = 1/9,223,372,036,854,775,808.
1.5-20
n
3
6
9
12
15
(a)
0.7037
0.6651
0.6536
0.6480
0.6447
(b)
0.6667
0.6319
0.6321
0.6321
0.6321
(c) Very little when n > 15, sampling with replacement
Very little when n > 10, sampling without replacement.
(d) Convergence is faster when sampling with replacement.
1.6
Bayes’s Theorem
1.6-2 (a)
P(G)
=
P(A ∩ G) + P(B ∩ G)
=
P(A)P(G | A) + P(B)P(G | B)
=
(0.40)(0.85) + (0.60)(0.75) = 0.79;
(b)
P(A | G)
=
P(A ∩ G)
P(G)
=
(0.40)(0.85)
0.79
= 0.43.
Copyright © 2010 Pearson Education, Inc. Publishing as Prentice Hall.
8
Chapter 1
1.6-4 Let event B denote an accident and let A1 be the event that age of the driver is 16–25.
Then
P(A1 | B)
=
(0.1)(0.05)
(0.1)(0.05) + (0.55)(0.02) + (0.20)(0.03) + (0.15)(0.04)
=
50
50 + 110 + 60 + 60 = 50
280 = 0.179.
1.6-6 Let B be the event that the policyholder dies.
Let A1, A2, A3 be the events that the
deceased is standard, preferred and ultra-preferred, respectively. Then
P(A1 | B)
=
(0.60)(0.01)
(0.60)(0.01) + (0.30)(0.008) + (0.10)(0.007)
=
60
60 + 24 + 7 = 60
91 = 0.659;
P(A2 | B)
=
24
91 = 0.264;
P(A3 | B)
=
7
91 = 0.077.
1.6-8 Let A be the event that the DVD player is under warranty.
P(B1 | A)
=
(0.40)(0.10)
(0.40)(0.10) + (0.30)(0.05) + (0.20)(0.03) + (0.10)(0.02)
=
40
40 + 15 + 6 + 2 = 40
63 = 0.635;
P(B2 | A)
=
15
63 = 0.238;
P(B3 | A)
=
6
63 = 0.095;
P(B4 | A)
=
2
63 = 0.032.
1.6-10 (a) P(AD) = (0.02)(0.92) + (0.98)(0.05) = 0.0184 + 0.0490 = 0.0674;
(b) P(N | AD) = 0.0490
0.0674 = 0.727; P(A | AD) = 0.0184
0.0674 = 0.273;
(c) P(N | ND) =
(0.98)(0.95)
(0.02)(0.08) + (0.98)(0.95) =
9310
16 + 9310 = 0.998; P(A | ND) = 0.002.
(d) Yes, particularly those in part (b).
1.6-12 Let D = {has the disease}, DP ={detects presence of disease}. Then
P(D | DP)
=
P(D ∩ DP)
P(DP)
=
P(D) · P(DP | D)
P(D) · P(DP | D) + P(D′) · P(DP | D′)
=
(0.005)(0.90)
(0.005)(0.90) + (0.995)(0.02)
=
0.0045
0.0045 + 0.199 = 0.0045
0.0244 = 0.1844.
Copyright © 2010 Pearson Education, Inc. Publishing as Prentice Hall.
Probability
9
1.6-14 Let D = {defective roll} Then
P(I | D)
=
P(I ∩ D)
P(D)
=
P(I) · P(D | I)
P(I) · P(D | I) + P(II) · P(D | II)
=
(0.60)(0.03)
(0.60)(0.03) + (0.40)(0.01)
=
0.018
0.018 + 0.004 = 0.018
0.022 = 0.818.
Copyright © 2010 Pearson Education, Inc. Publishing as Prentice Hall.
Chapter 2
Discrete Distributions
2.1
Random Variables of the Discrete Type
2.1-2 (a)
f(x) =
0.6,
x = 1,
0.3,
x = 5,
0.1,
x = 10,
(b)
f(x)
x
0.1
0.2
0.3
0.4
0.5
0.6
1
2
3
4
5
6
7
8
9
10
Figure 2.1–2: A probability histogram
2.1-4 (a) f(x) = 1
10 , x = 0, 1, 2, · · · , 10;
(b)
N({0})/150 = 11/150 = 0.073;
N({5})/150 = 13/150 = 0.087;
N({1})/150 = 14/150 = 0.093;
N({6})/150 = 22/150 = 0.147;
N({2})/150 = 13/150 = 0.087;
N({7})/150 = 16/150 = 0.107;
N({3})/150 = 12/150 = 0.080;
N({8})/150 = 18/150 = 0.120;
N({4})/150 = 16/150 = 0.107;
N({9})/150 = 15/150 = 0.100.
11
Copyright © 2010 Pearson Education, Inc. Publishing as Prentice Hall.
12
Chapter 2
(c)
x
f(x), h(x)
0.02
0.04
0.06
0.08
0.10
0.12
0.14
1
2
3
4
5
6
7
8
9
Figure 2.1–4: Michigan daily lottery digits
2.1-6 (a) f(x) = 6 − | 7 − x |
36
, x = 2, 3, 4, 5, 6, 7, 8, 9, 10, 11, 12.
(b)
x
f(x)
0.02
0.04
0.06
0.08
0.10
0.12
0.14
0.16
1
2
3
4
5
6
7
8
9
10
11 12
Figure 2.1–6: Probability histogram for the sum of a pair of dice
Copyright © 2010 Pearson Education, Inc. Publishing as Prentice Hall.
Discrete Distributions
13
2.1-8 (a) The space of W is S = {0, 1, 2, 3, 4, 5, 6, 7}.
P(W = 0) = P(X = 0, Y = 0) = 1
2 · 1
4 = 1
8, assuming independence.
P(W = 1) = P(X = 0, Y = 1) = 1
2 · 1
4 = 1
8,
P(W = 2) = P(X = 2, Y = 0) = 1
2 · 1
4 = 1
8,
P(W = 3) = P(X = 2, Y = 1) = 1
2 · 1
4 = 1
8,
P(W = 4) = P(X = 0, Y = 4) = 1
2 · 1
4 = 1
8,
P(W = 5) = P(X = 0, Y = 5) = 1
2 · 1
4 = 1
8,
P(W = 6) = P(X = 2, Y = 4) = 1
2 · 1
4 = 1
8,
P(W = 7) = P(X = 2, Y = 5) = 1
2 · 1
4 = 1
8.
That is, f(w) = P(W = w) = 1
8,
w ∈ S.
(b)
x
( )
f x
0.02
0.04
0.06
0.08
0.10
0.12
1
2
3
4
5
6
7
Figure 2.1–8: Probability histogram of sum of two special dice
2.1-10 (a)
�3
1
��47
9
�
�50
10
�
= 39
98;
(b)
1
�
x=0
�3
x
��
47
10 − x
�
�50
10
�
= 221
245.
Copyright © 2010 Pearson Education, Inc. Publishing as Prentice Hall.
14
Chapter 2
2.1-12
OC(0.04)
=
�1
0
��24
5
�
�25
5
�
+
�1
1
��24
4
�
�25
5
�
= 1.000;
OC(0.08)
=
�2
0
��23
5
�
�25
5
�
+
�2
1
��23
4
�
�25
5
�
= 0.967;
OC(0.12)
=
�3
0
��22
5
�
�25
5
�
+
�3
1
��22
4
�
�25
5
�
= 0.909;
OC(0.16)
=
�4
0
��21
5
�
�25
5
�
+
�4
1
��21
4
�
�25
5
�
= 0.834.
2.1-14 P(X ≥ 1) = 1 − P(X = 0) = 1 −
�3
0
��17
5
�
�20
5
�
= 1 − 91
228 = 137
228 = 0.60.
2.1-16 (a) Let Y equal the number of H chips that are selected. Then
X = |Y − (10 − Y )| = |2Y − 10| and the p.m.f. of Y is
g(y) =
�10
y
��
10
10 − y
�
�20
10
�
,
y = 0, 1, . . . , 10.
The p.m.f. of X is as follows:
f(0) = g(5)
f(2) = 2g(6)
f(4) = 2g(7)
f(6) = 2g(8)
f(8) = 2g(9)
f(10) = 2g(10)
1
184,756
2025
92,378
22,050
46,189
22,050
46,189
2025
92,378
1
92,378
(b) The mode is equal to 2.
2.1-18 (a) P(2, 1, 6, 10) means that 2 is in position 1 so 1 cannot be selected. Thus
P(2, 1, 6, 10) =
�1
0
��1
1
��8
5
�
�10
6
�
= 56
210 = 4
15;
(b) P(i, r, k, n) =
�i − 1
r − 1
��1
1
��n − i
k − r
�
�n
k
�
.
Copyright © 2010 Pearson Education, Inc. Publishing as Prentice Hall.
Discrete Distributions
15
2.2
Mathematical Expectation
2.2-2 E(X) = (−1)
�4
9
�
+ (0)
�1
9
�
+ (1)
�4
9
�
= 0;
E(X2) = (−1)2
�4
9
�
+ (0)2
�1
9
�
+ (1)2
�4
9
�
= 8
9;
E(3X2 − 2X + 4) = 3
�8
9
�
− 2(0) + 4 = 20
3 .
2.2-4 E(X) = $ 499(0.001) − $ 1(0.999) = −$ 0.50.
2.2-6
1
=
6
�
x=0
f(x) = 9
10 + c
�1
1 + 1
2 + 1
3 + 1
4 + 1
5 + 1
6
�
c
=
2
49;
E(Payment)
=
2
49
�
1 · 1
2 + 2 · 1
3 + 3 · 1
4 + 4 · 1
5 + 5 · 1
6
�
= 71
490 units.
2.2-8 Note that
∞
�
x=1
6
π2x2 = 6
π2
∞
�
x=1
1
x2 = 6
π2
π2
6 = 1, so this is a p.d.f.
E(X) =
∞
�
x=1
x
6
π2x2 = 6
π2
∞
�
x=1
1
x
and it is well known that the sum of this harmonic series is not finite.
2.2-10 E(|X − c|) = 1
7
�
x∈S
|x − c|, where S = {1, 2, 3, 5, 15, 25, 50}.
When c = 5,
E(|X − 5|) = 1
7 [(5 − 1) + (5 − 2) + (5 − 3) + (5 − 5) + (15 − 5) + (25 − 5) + (50 − 5)] .
If c is either increased or decreased by 1, this expectation is increased by 1/7.
Thus
c = 5, the median, minimizes this expectation while b = E(X) = µ, the mean, minimizes
E[(X − b)2]. You could also let h(c) = E( | X − c | ) and show that h′(c) = 0 when c = 5.
2.2-12 (1) · 15
36 + (−1) · 21
36 = −6
36 = −1
6 ;
(1) · 15
36 + (−1) · 21
36 = −6
36 = −1
6 ;
(4) · 6
36 + (−1) · 30
36 = −6
36 = −1
6 .
2.2-14 (a) The average class size is
(16)(25) + (3)(100) + (1)(300)
20
= 50;
(b)
f(x) =
0.4,
x = 25,
0.3,
x = 100,
0.3,
x = 300,
(c) E(X) = 25(0.4) + 100(0.3) + 300(0.3) = 130.
Copyright © 2010 Pearson Education, Inc. Publishing as Prentice Hall.
16
Chapter 2
2.3
The Mean, Variance, and Standard Deviation
2.3-2 (a)
µ
=
E(X)
=
3
�
x=1
x
3!
x! (3 − x)!
�1
4
�x�3
4
�3−x
=
3
�1
4
�
2
�
k=0
2!
k! (2 − k)!
�1
4
�k�3
4
�2−k
=
3
�1
4
��1
4 + 3
4
�2
= 3
4;
E[X(X − 1)]
=
3
�
x=2
x(x − 1)
3!
x! (3 − x)!
�1
4
�x�3
4
�3−x
=
2(3)
�1
4
�2 3
4 + 6
�1
4
�3
=
6
�1
4
�2
= 2
�1
4
��3
4
�
;
σ2
=
E[X(X − 1)] + E(X) − µ2
=
(2)
�3
4
��1
4
�
+
�3
4
�
−
�3
4
�2
=
(2)
�3
4
��1
4
�
+
�3
4
��1
4
�
= 3
�1
4
��3
4
�
;
(b)
µ
=
E(X)
=
4
�
x=1
x
4!
x! (4 − x)!
�1
2
�x�1
2
�4−x
=
4
�1
2
�
3
�
k=0
3!
k! (3 − k)!
�1
2
�k�1
2
�3−k
=
4
�1
2
��1
2 + 1
2
�3
= 2;
E[X(X − 1)]
=
4
�
x=2
x(x − 1)
4!
x! (4 − x)!
�1
2
�x�1
2
�4−x
=
2(6)
�1
2
�4
+ (6)(4)
�1
2
�4
+ (12)
�1
2
�4
=
48
�1
2
�4
= 12
�1
2
�2
;
σ2
=
(12)
�1
2
�2
+ 4
2 −
�4
2
�2
= 1.
2.3-4 E[(X − µ)/σ] = (1/σ)[E(X) − µ] = (1/σ)(µ − µ) = 0;
E{[(X − µ)/σ]2} = (1/σ2)E[(X − µ)2] = (1/σ2)(σ2) = 1.
Copyright © 2010 Pearson Education, Inc. Publishing as Prentice Hall.
Discrete Distributions
17
2.3-6 f(1) = 3
8, f(2) = 2
8, f(3) = 3
8
µ = 1 · 3
8 + 2 · 2
8 + 3 · 3
8 = 2,
σ2 = 12 · 3
8 + 22 · 2
8 + 32 · 3
8 − 22 = 3
4.
2.3-8 (a) x = 4
3 = 1.333;
(b) s2 = 88
69 = 1.275.
2.3-10 (a) [3, 19, 16, 9];
(b) x = 125
47 = 2.66, s = 0.87;
(c)
h(x)
x
0.05
0.10
0.15
0.20
0.25
0.30
0.35
0.40
1
2
3
4
Figure 2.3–10: Number of pets
2.3-12 x = 409
50 = 8.18.
2.3-14 (a) f(x) = P(X = x) =
�6
x
�� 43
6 − x
�
�49
6
�
,
x = 0, 1, 2, 3, 4, 5, 6;
(b)
µX
=
6
�
x=0
xf(x) = 36
49 = 0.7347,
σ2
X
=
6
�
x=0
(x − µ)2f(x) = 5,547
9,604 = 0.5776;
σX
=
43
98
√
3 = 0.7600;
(c) f(0) = 435,461
998,844 > 412,542
998,844 = f(1);
X = 0 is most likely to occur.
Copyright © 2010 Pearson Education, Inc. Publishing as Prentice Hall.
18
Chapter 2
(d) The numbers are reasonable because
(25,000,000)f(6)
=
1.79;
(25,000,000)f(5)
=
461.25;
(25,000,000)f(4)
=
24,215.49;
(e) The respective expected values, (138)f(x), for x = 0, 1, 2, 3, are 60.16, 57.00, 18.27,
and 2.44, so the results are reasonable. See Figure 2.3-14 for a comparison of the
theoretical probability histogram and the histogram of the data.
f(x), h(x)
x
0.1
0.2
0.3
0.4
1
2
3
4
5
6
Figure 2.3–14: Empirical (shaded) and theoretical histograms for LOTTO
2.3-16 (a) Out of the 75 numbers, first select x − 1 of which 23 are selected out of the 24
good numbers on your card and the remaining x − 1 − 23 are selected out of the 51
bad numbers. There is now one good number to be selected out of the remaining
75 − (x − 1).
(b) The mode is 75.
(c) µ = 1824
25
= 72.96.
(d) E[X(X + 1)] = 70,224
13
= 5,401.846154.
(e) σ2 = 46,512
8,125 = 5.724554; σ = 2.3926.
(f) (i) x = 72.78, (ii) s2 = 8.7187879, (iii) s = 2.9528, (iv) 5378.34.
Copyright © 2010 Pearson Education, Inc. Publishing as Prentice Hall.
Discrete Distributions
19
(g)
x
f(x), h(x)
0.05
0.10
0.15
0.20
0.25
0.30
0.35
61
63
65
67
69
71
73
75
Figure 2.3–16: Bingo “cover-up” comparisons
2.3-18 (a) P(X ≥ 1) =
21
�3
1
� = 2
3;
(b)
5
�
k=1
P(X ≥ k) = P(X = 1) + 2P(X = 2) + · · · + 5P(X = 5) = µ;
(c) µ = 5,168
3,465 = 1.49149;
(d) In the limit, µ = π
2 .
2.4
Bernoulli Trials and the Binomial Distribution
2.4-2 f(−1) = 11
18, f(1) = 7
18;
µ = (−1)11
18 + (1) 7
18 = − 4
18;
σ2 =
�
−1 + 4
18
�2�11
18
�
+
�
1 + 4
18
�2� 7
18
�
= 77
81.
2.4-4 (a) P(X ≤ 5) = 0.6652;
(b) P(X ≥ 6) = 1 − P(X ≤ 5) = 0.3348;
(c) P(X ≤ 7) − P(X ≤ 6) = 0.9427 − 0.8418 = 0.1009;
(d) µ = (12)(0.40) = 4.8, σ2 = (12)(0.40)(0.60) = 2.88,
σ =
√
2.88 = 1.697.
2.4-6 (a) X is b(7, 0.15);
(b)
(i)
P(X ≥ 2)
=
1 − P(X ≤ 1) = 1 − 0.7166 = 0.2834;
(ii)
P(X = 1)
=
P(X ≤ 1) − P(X ≤ 0) = 0.7166 − 0.3206 = 0.3960;
(iii)
P(X ≤ 3)
=
0.9879.
Copyright © 2010 Pearson Education, Inc. Publishing as Prentice Hall.
20
Chapter 2
2.4-8 (a) P(X ≥ 10) = P(15 − X ≤ 5) = 0.5643;
(b) P(X ≤ 10) = P(15 − X ≥ 5) = 1 − P(15 − X ≤ 4) = 1 − 0.3519 = 0.6481;
(c) P(X = 10) = P(X ≥ 10) − P(X ≥ 11)
= P(15 − X ≤ 5) − P(15 − X ≤ 4) = 0.5643 − 0.3519 = 0.2124;
(d) X is b(15, 0.65), 15 − X) is b(15, 0.35);
(e) µ = (15)(0.65) = 9.75, σ2 = (15)(0.65)(0.35) = 3.4125; σ =
√
3.4125 = 1.847.
2.4-10 (a) 1 − 0.014 = 0.99999999; (b) 0.994 = 0.960596.
2.4-12 (a) X is b(8, 0.90);
(b)
(i)
P(X = 8)
=
P(8 − X = 0) = 0.4305;
(ii)
P(X ≤ 6)
=
P(8 − X ≥ 2)
=
1 − P(8 − X ≤ 1) = 1 − 0.8131 = 0.1869;
(iii)
P(X ≥ 6)
=
P(8 − X ≤ 2) = 0.9619.
2.4-14 (a)
f(x) =
125/216,
x = −1,
75/216,
x = 1,
15/216,
x = 2,
1/216,
x = 3;
(b)
µ
=
(−1) · 125
216 + (1) · 75
216 + (2) · 15
216 + (3) ·
1
216 = − 17
216;
σ2
=
E(X2) − µ2 = 269
216 −
�
− 17
216
�2
= 1.2392;
σ
=
1.11;
(c) See Figure 2.4-14.
(d)
x
=
−1
100 = −0.01;
s2
=
100(129) − (−1)2
100(99)
= 1.3029;
s
=
1.14.
Copyright © 2010 Pearson Education, Inc. Publishing as Prentice Hall.
Discrete Distributions
21
(e)
f(x), h(x)
x
0.1
0.2
0.3
0.4
0.5
–1
1
2
3
Figure 2.4–14: Losses in chuck-a-luck
2.4-16 Let X equal the number of winning tickets when n tickets are purchased. Then
P(X ≥ 1)
=
1 − P(X = 0)
=
1 −
� 9
10
�n
.
(a)
1 − (0.9)n
=
0.50
(0.9)n
=
0.50
n ln 0.9
=
ln 0.5
n
=
ln 0.5
ln 0.9 = 6.58
so n = 7.
(b)
1 − (0.9)n
=
0.95
(0.9)n
=
0.05
n
=
ln 0.05
ln 0.09 = 28.43
so n = 29.
2.4-18
(0.1)(1 − 0.955)
(0.4)(1 − 0.975) + (0.5)(1 − 0.985) + (0.1)(1 − 0.955) = 0.178.
2.4-20 It is given that X is b(10, 0.10). We are to find M so that
P(1000X ≤ M) ≥ 0.99) or P(X ≤ M/1000) ≥ 0.99. From Appendix Table II,
P(X ≤ 4) = 0.9984 > 0.99. Thus M/1000 = 4 or M = 4000 dollars.
2.4-22 X is b(5, 0.05). The expected number of tests is
1 P(X = 0) + 6 P(X > 0) = 1 (0.7738) + 6 (1 − 0.7738) = 2.131.
Copyright © 2010 Pearson Education, Inc. Publishing as Prentice Hall.
22
Chapter 2
2.5
The Moment-Generating Function
2.5-2 (a) (i) b(5, 0.7); (ii) µ = 3.5, σ2 = 1.05; (iii) 0.1607;
(b) (i) geometric, p = 0.3; (ii) µ = 10/3, σ2 = 70/9; (iii) 0.51;
(c) (i) Bernoulli, p = 0.55; (ii) µ = 0.55, σ2 = 0.2475; (iii) 0.55;
(d) (ii) µ = 2.1, σ2 = 0.89; (iii) 0.7;
(e) (i) negative binomial, p = 0.6, r = 2; (ii) 10/3, σ2 = 20/9; (iii) 0.36;
(f) (i) discrete uniform on 1, 2, . . . , 10; (ii) 5.5, 8.25; (iii) 0.2.
2.5-4 (a) f(x) =
�364
365
�x−1� 1
365
�
,
x = 1, 2, 3, . . . ,
(b)
µ
=
1
1
365
= 365,
σ2
=
364
365
� 1
365
�2 = 132,860,
σ
=
364.500;
(c)
P(X > 400)
=
�364
365
�400
= 0.3337,
P(X < 300)
=
1 −
�364
365
�299
= 0.5597.
2.5-6 P(X ≥ 100) = P(X > 99) = (0.99)99 = 0.3697.
2.5-8
�10 − 1
5 − 1
��1
2
�5�1
2
�5
= 126
1024 = 63
512.
2.5-10 (a) Negative binomial with r = 10, p = 0.6 so
µ = 10
0.60 = 16.667, σ2 = 10(0.40)
(0.60)2 = 11.111, σ = 3.333;
(b) P(X = 16) =
�15
9
�
(0.60)10(0.40)6 = 0.1240.
2.5-12
P(X > k + j | X > k)
=
P(X > k + j)
P(X > k)
=
qk+j
qk
= qj = P(X > j).
2.5-14 (b)
∞
�
x=2
f(x)
=
∞
�
x=2
1
√
5
�
1 +
√
5
2
�x−1
−
�
1 −
√
5
2
�x−1
� 1
2x
�
=
2
√
5(1 +
√
5)
∞
�
x=2
(1 +
√
5)x
4x
−
2
√
5(1 −
√
5)
∞
�
x=2
(1 −
√
5)x
4x
=
(you fill in missing steps)
=
1;
Copyright © 2010 Pearson Education, Inc. Publishing as Prentice Hall.
Discrete Distributions
23
(c)
E(X)
=
∞
�
x=2
x
√
5
�
1 +
√
5
2
�x−1
−
�
1 −
√
5
2
�x−1
� 1
2x
�
=
1
2
√
5
∞
�
x=1
x
�
1 +
√
5
4
�x−1
− x
�
1 −
√
5
4
�x−1
=
1
2
√
5
�
1
(1 − (1 +
√
5)/4)2 −
1
(1 − (1 −
√
5/4)2
�
=
(you fill in missing steps)
=
6;
(d) E[X(X − 1)]
=
∞
�
x=2
x(x − 1) 1
√
5
�
1 +
√
5
2
�x−1
−
�
1 −
√
5
2
�x−1
� 1
2x
�
=
1
2
√
5
∞
�
x=2
x(x − 1)
�
1 +
√
5
4
�x−1
−
�
1 −
√
5
4
�x−1
=
1
2
√
5
1 +
√
5
4
∞
�
x=2
x(x − 1)
�
1 +
√
5
4
�x−2
−
1 −
√
5
4
∞
�
x=2
x(x − 1)
�
1 −
√
5
4
�x−2
=
1
2
√
5
2
�
1 +
√
5
4
�
�
1 − 1 +
√
5
4
�3 −
2
�
1 −
√
5
4
�
�
1 − 1 −
√
5
4
�3
=
(you fill in missing steps)