
ECN 212 Chapter 19, Spring 2007
Notre Dame University–Louaize · Principles of Macroeconomics · 98 pages · Mr. Hrair Hovivian


Showing the first 10 of 98 pages. Download the PDF to see all of it.
More ECN 212 files
- Problems Quest.&Answ. Chapter 5 Introduction to Macroeconomics · Spring 2012ChapterView
- Chapter 17 · Spring 2007ChapterView
- Chapter 20 · Spring 2007ChapterView
- Chapter 21 · Spring 2007ChapterView
- Chapter 22 · Spring 2007ChapterView
- Chapter 25 · Spring 2007ChapterView
- Chapter 1 · Spring 2007ChapterView
- Problems with Some Answers · Fall 2008Problems · with solutionView
Show the text of this chapter
Introduction to Macroeconomics
The Business Cycle
1
Two Key Features of GDP:
It grows over time
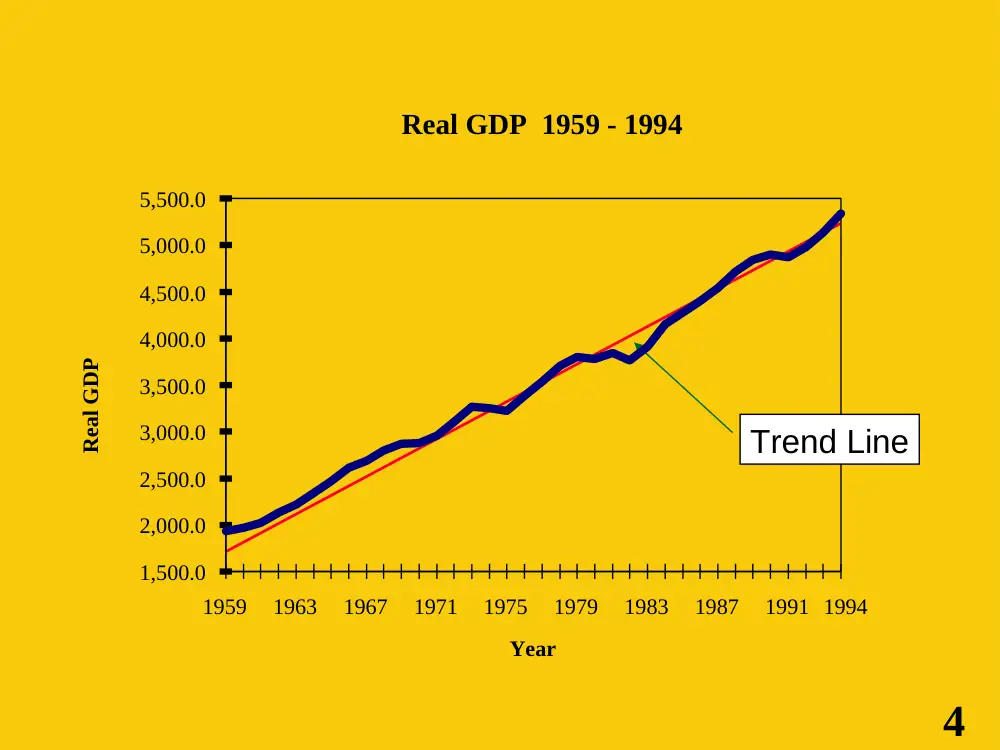
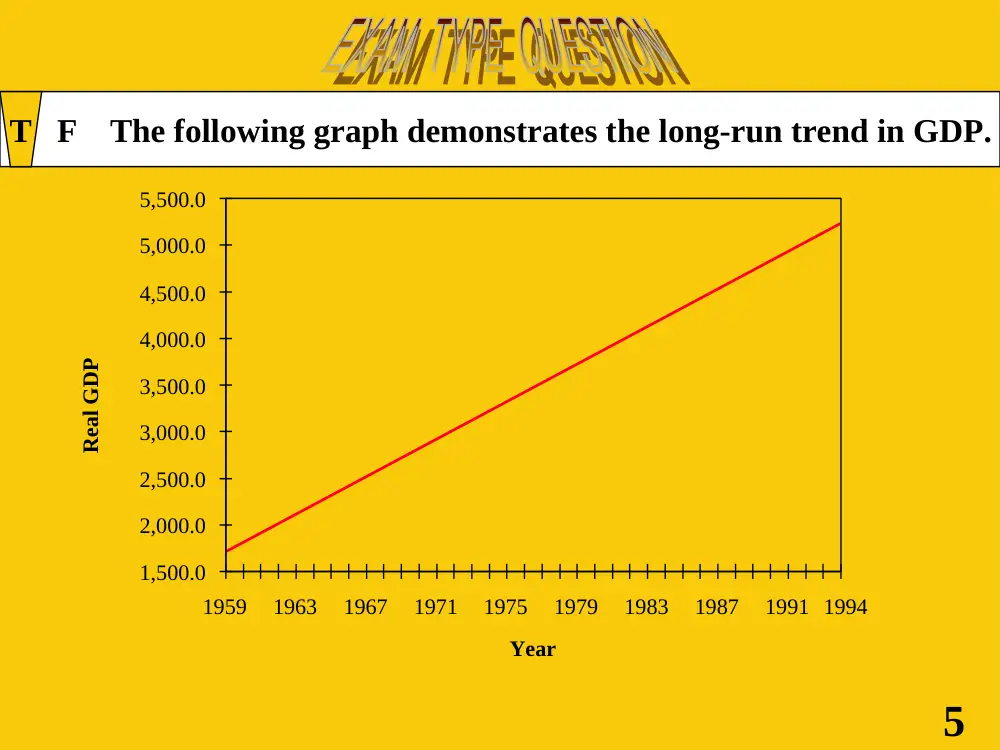
The long run trend in GDP is positive
2
Two Key Features of GDP:
It grows over time
The long run trend in GDP is positive
It fluctuates as it grows
GDP exhibits business cycle movements
3
Real GDP 1959 - 1994
1,500.0
2,000.0
2,500.0
3,000.0
3,500.0
4,000.0
4,500.0
5,000.0
5,500.0
1959
1963
1967
1971
1975
1979
1983
1987
1991
Year
Real GDP
Trend Line
1994
4
1,500.0
2,000.0
2,500.0
3,000.0
3,500.0
4,000.0
4,500.0
5,000.0
5,500.0
1959
1963
1967
1971
1975
1979
1983
1987
1991
Year
Real GDP
1994
5
T F
The following graph demonstrates the long-run trend in GDP.
T
Business Cycle
Periodic movements in output, prices, and
employment
Business cycles are not created equal.
Duration
Severity
6
Recessions, Depressions, and
Unemployment
7
Macroeconomic Problems
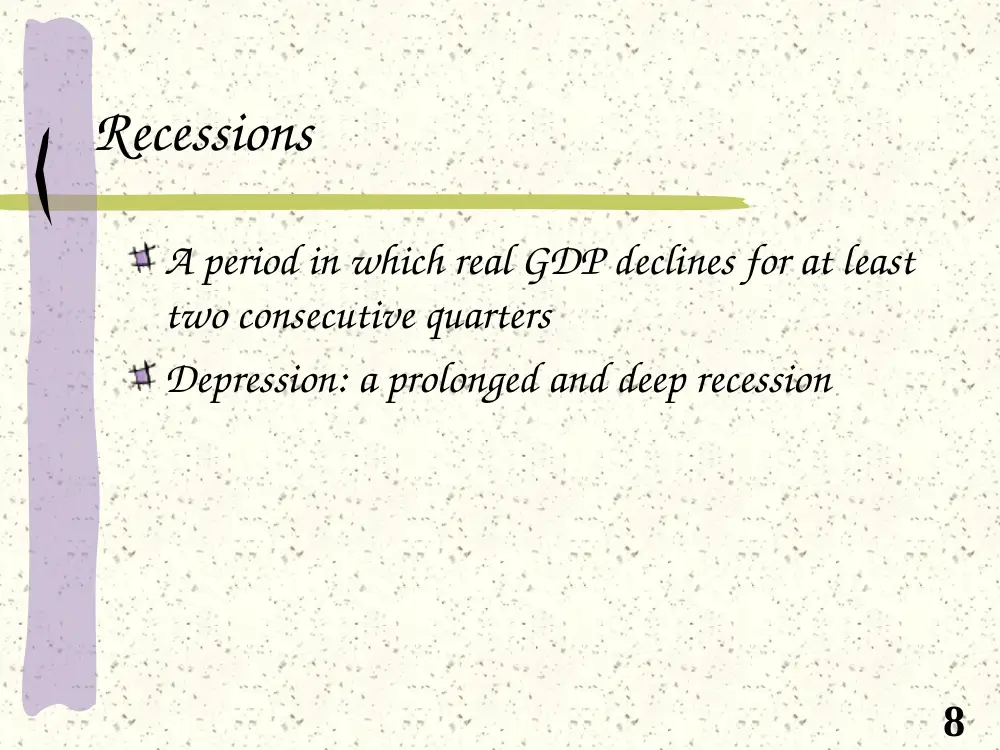
Recessions
A period in which real GDP declines for at least
two consecutive quarters
Depression: a prolonged and deep recession
8
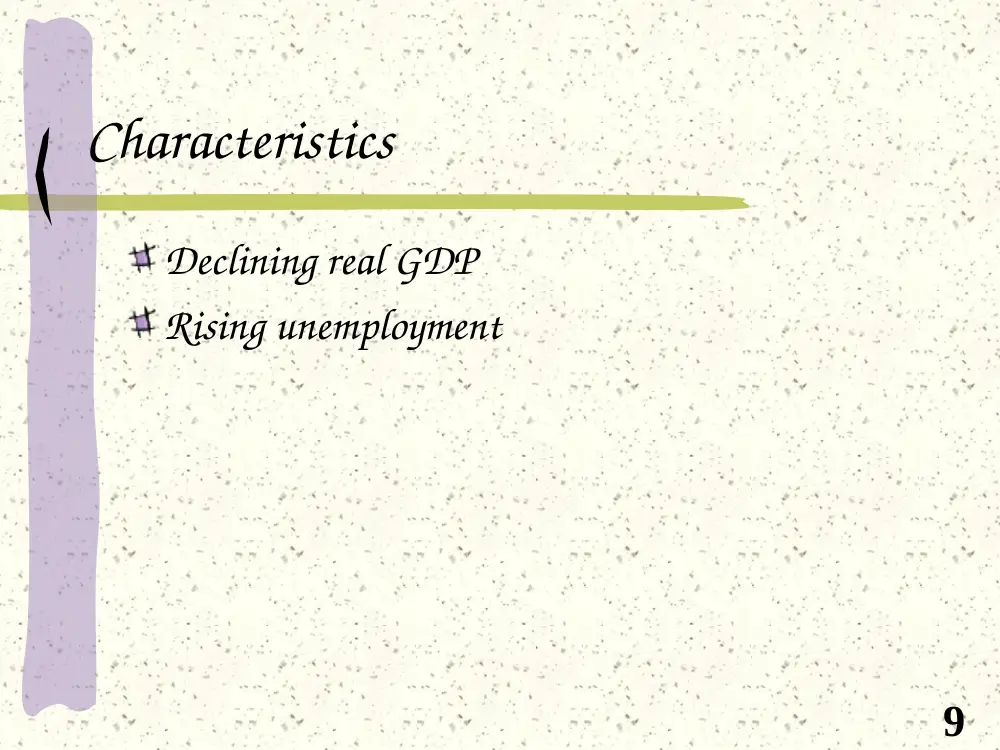
Characteristics
Declining real GDP
Rising unemployment
9
Types of Unemployment
Cyclical
due to business cycle movements in GDP
Frictional
due to job search activities
Structural
due to changes in economic institutions
geographic displacement, technological change, discrimination
10
CYCLICAL UNEMPLOYMENT
DUE TO BUSINESS CYCLE, AD MIGHT
FALL
AS AD FALLS, THE DEMAND FOR
LABOR FALLS
AS THE DEMAND FOR LABOR FALLS,
UNEMPLOYMENT RISES
11
FALL IN AGGREGATE DEMAND
PL
AS
AD
AD’
0
Y2 Y1
GDP
12
RISE IN UNEMPLOYMENT
EMPLOYMENT
WAGE
0
DL
SL
E1
DL’
E2
13
FRICTIONAL UNEMPLOYMENT
VOLUNTARY “BETWEEN JOB”
WORKERS
MOVING FROM LOW-PAY TO HIGH-PAY
JOBS
INCOME RISES
DESIRABLE
14
STRUCTURAL UNEMPLOYMENT
TECHNOLOGY
DEMAND FOR LABOR FALLS
15
DEFINING FULL-EMPLOYMENT
FRICTIONAL AND STRUCTURAL
UNEMPLOYMENTS ARE
UNAVOIDABLE
100% FULL-EMPLOYMENT IS
IMPOSSIBLE
A GIVEN UNEMPLOYMENT IS
CONSIDERED TO BE FULL-
EMPLOYMENT
16
Full employment does not mean ……. Unemployment.
0%
17
Economists regard frictional and …………………….
Unemployment unavoidable; hence “full employment” is
defined as something ………….. than employment of 100%
of the labor force
structural
less
Defining Unemployment
Labor Force = Employed + Unemployed
Population = Labor Force + Not in Labor
Force
Unemployment Rate =
Unemployed
Labor Force
18
NOT IN LABOR FORCE
NOT CAPABLE OF BEING EMPLOYED
- UNDER 16 YEARS
- ARMED FORCES
- INSTITUTIONALIZED
CAPABLE BUT NOT WILLING TO BE
EMPLOYED
- ADULTS IN SCHOOLS
- RETIRED PEOPLE
- NOT LOOKING FOR EMPLOYMENT
19
Unemployment
Unemployment rate: the percentage of people in the
labor force who can’t find a job
Labor Force: people
who are actively
seeking
or are currently
holding
a job
Labor Force: people
who are actively
seeking
or are currently
holding
a job
20
Unemployment
Pool
Entrants
7% Unemployment
1. Job Finders
2. Discouraged
Workers
3. Labor Force
Leavers
1. New Entrants
2. Re-entrants
3. Job Leavers
4. Job Losers
21
CRITICISMS
PART-TIME EMPLOYMENT
DISCOURAGED WORKERS
FALSE INFORMATION
22
PART-TIME EMPLOYMENT
SOME ARE EMPLOYED PART-TIME
BECAUSE THEY DO NOT FIND
FULL-TIME JOBS, BUT THEY ARE
COUNTED AS EMPLOYED
UNEMPLOYMENT RATE IS
UNDERSTATED
23
EXAMPLE
LABOR FORCE = 1,000 WORKERS
DAILY WORKING TIME = 8 HOURS
FULL-TIME WORKERS = 500 WORKERS
HALF-TIME WORKERS = 300 WORKERS
REQUIRED FULL-TIME JOB-HOURS = 1,000 x 8 = 8,000 HR
TIME EMPLOYED = ( 500 x 8 ) + ( 300 x 4 ) = 5,200 HR
TRUE UNEMPLOYMENT RATE = 8,000-5,200 = 35%
8,000
CALCULATED UNEMPLOYMENT RATE
=
1,000-(500+300) = 20% < 35%
1,000
24
DISCOURAGED WORKERS
SOME WORKERS SEEK EMPLOYMENT
FOR A LONG PERIOD
STOP SEEKING
ARE COUNTED AS NOT IN LABOR
FORCE
UNEMPLOYMENT RATE
UNDERSTATED
25
EXAMPLE
LABOR FORCE = 800 WORKERS
FULL-TIME WORKERS = 600 WORKERS
DISCOURAGED WORKERS = 200 W.
TRUE UNEMPLOYMENT RATE
= 1,000-600 = 40%
1,000
CALCULATED UNEMPLOYMENT RATE
= 800-600 = 25% < 40%
800
26
Which of the following will lead to a decrease in the unemployment
rate?
a.
Discouraged workers drop out of the labor force.
b.
More women enter the labor force and seek jobs.
c.
Young people leave summer jobs and return to college.
d.
The practice of not counting military personnel as part of the labor
force.
The correct answer is
“a”
27
FALSE INFORMATION
PEOPLE NOT IN LABOR FORCE MIGHT
CLAIM THEY ARE SEEKING FOR
EMPLOYMENT TO GET
UNEMPLOYMENT COMPENSATION
UNEMPLOYMENT RATE OVERSTATED
28
EXAMPLE
LABOR FORCE = 1,000 WORKERS
FULL-TIME WORKERS = 600 WORKERS
FALSE LABOR = 200 WORKERS
TRUE UNEMPLOYMENT RATE
= 800-600 = 25%
800
CALCULATED UNEMPLOYMENT RATE
= 1,000-600 = 40% > 25%
1,000
29
Costs of Unemployment
Personal costs
Social costs
Economic costs
Why is 0%
unemployment
undesirable?
Why is 0%
unemployment
undesirable?
30
SOCIAL COSTS OF UNEMPLOYMENT
UNEMPLOYMENT IS A SOCIAL
CATASTROPHE
DEPRESSION MEANS IDLENESS
IDLENESS MEANS LOSS OF SKILLS,
SELF RESPECT, MORALE, FAMILY
DISINTEGRATION AND
SOCIOPOLITICAL UNREST
31
ECONOMIC COSTS OF UNEMPLOYMENT
GNP GAP
UNEQUAL BURDENS
32
GNP GAP
WHEN THE ECONOMY FAILS TO GENERATE
ENOUGH JOBS FOR ALL WHO ARE WILLING
AND ABLE TO WORK, POTENTIAL
PRODUCTION OF GOODS AND SERVICES IS
LOST
OKUN’S LAW: FOR EVERY 1% ABOVE
NORMAL UNEMPLOYMENT RATE, THERE
SHALL BE A 2.5% GNP GAP
33
EXAMPLE
ASSUME THE FOLLOWING:
FULL-EMPLOYMENT UNEMPLOYMENT RATE =
9%
UNEMPLOYMENT RATE = 18%
POTENTIAL OUTPUT = $5,000,000
ABOVE NORMAL UNEMPLOYMENT RATE =
18% - 9% = 9%
GNP GAP = 9% x 2.5% = 22.5%
GNP = 5,000,000 ( 1 - 0.225 )
=
$3,875,000
34
EXPENDITURES
0
GNP
($MILLION)
45º LINE
AD
E
3.875
5
GNP GAP
35
a.
If full employment output is $4 million, and
equilibrium national output is $3 million, what
shall be the GNP gap?
GNP gap = 4 - 3 = $1 million
b.
What is the rate of GNP gap?
Rate of GNP gap = 1/4 = 25%
c.
If the natural rate of unemployment is 9%, what is
the actual unemployment rate in the economy?
Above normal unemployment rate = 25 ÷ 2.5 = 10
Unemployment rate = 10 + 9 = 19%
d. If the actual unemployment rate falls by 4% in
the coming year, what shall be the rate of GNP gap?
New unemployment rate = 19 - 4 = 15%
Above normal unemployment rate = 15 - 9 = 6%
Rate of GNP gap = 6 x 2.5 = 15%
UNEQUAL BURDENS
IF AS UNEMPLOYMENT RISES,
WORKING HOURS OF ALL LABOR
FALLS EQUAL BURDEN
BUT AS UNEMPLOYMENT RISES,
GROUPS OF PEOPLE ARE ENTIRELY
UNEMPLOYED UNEQUAL BURDEN
38
EXAMPLE
LABOR FORCE = 1,000 WORKERS
DAILY WORKING TIME = 8 HOURS
UNEMPLOYMENT RATE = 25%
SHARING THE BURDEN OF UNEMPLOYMENT WOULD MEAN
ALL 1,000 WORKERS HAD TO BE EMPLOYED 6 HOURS EACH
BUT THE REAL LIFE PRACTICE IS NOT SO, RATHER 250
WORKERS WOULD BE 100% UNEMPLOYED, AND 750
WORKERS WOULD BE 100% EMPLOYED
39
Macroeconomic Problems
Inflation
40
How Do We Measure the Price Level?
GDP deflator: a measure of the prices of all goods
produced
CPI: Consumer Price Index: a measure of the price of a
market basket of goods
41
The Price Level in Cicely
In Cicely, three goods are produced:
meat
Coffee
shoes
A market basket is 2 meats, 5 Coffees, and 1 pair of shoes.
42
Production in Cicely
Meat
Coffee
Shoes
1992
Price Quantity
$4
20
$4
10
$20
15
What is the price level in Cicely?
43
1991
Price Quantity
$3
10
$5
15
$7
20
CPI
Multiply the price of the good by the quantity in
the market basket and add over all goods.
In 1991: $3(2) + $5(5) + $7(1) = $38
In 1992: $4(2) + $4(5) + $20(1) = $48
Rate of Inflation
(48_-_38) = 26%.
38
44
GDP Deflator
Nominal GDP: GDP measured in current year
prices
Real GDP: GDP measured in constant prices
(prices derived from a base year)
45
T
F
GNP in constant dollars refers
to the value of all goods and
services
produced in an
economy per year
deflated
for price changes.
The statement is TRUE.
46
GDP in Cicely
Nominal GDP
Real GDP
GDP deflator
1991
$245
1992
$245 = $3(10) + $5(15) + $7(20)
47
GDP in Cicely
Nominal GDP
Real GDP
GDP deflator
1991
$245
1992
$420
$420 = $4(20) + $4(10) + $20(15)
48
GDP in Cicely
Nominal GDP
Real GDP
GDP deflator
1991
$245
$245
1992
$420
$245 = $3(10) + $5(15) + $7(20)
49
GDP in Cicely
Nominal GDP
Real GDP
GDP deflator
1991
$245
$245
1992
$420
$215
$215 = $3(20) + $5(10) + $7(15)
Note that we have used 1991 prices.
50
GDP in Cicely
Nominal GDP
Real GDP
GDP deflator
1991
$245
$245
100
1992
$420
$215
100 = 100 * $245/$245
51
GDP in Cicely
Nominal GDP
Real GDP
GDP deflator
1991
$245
$245
100
1992
$420
$215
195
195 = 100*$420/$215
52
GDP in Cicely
Nominal GDP
Real GDP
GDP deflator
1991
$245
$245
100
1992
$420
$215
195
Rate of Inflation = (195 - 100)/100
= 95%
53
Real GDP =
Nominal GDP
Price Level/100
54
Inflation and Prices
Price level: a measure of the behavior of all prices in the
economy
A tool for comparison of prices over time
Inflation: the rate of change in the price level
55
If GNP increased from $80 billion in 1996 to $133.12
billion in 2000,
a. Find the average annual increase.
56
Increase = 133.12 - 80 = $53.12 billion
Average annual increase = 53.12 ÷ 4
= $13.28 billion
If GNP increased from $80 billion in 1996 to
$133.12 billion in 2000,
Increase = 133.12 - 80 = $53.12 billion
Average annual rate of increase
= 66.4 ÷ 4 = 16.6%
b. What was the annual rate of increase?
57
Rate of increase = 53.12 ÷ 80 = 66.4%
Total increase in the price level
= (1 + 0.07)4 - 1 = 31%
c. Suppose that between 1996 and 2000 the average price level rose by 7% per year.
Find the total increase in the price level along the four-year period.
58
d. What was the price index in 2000, assuming 1996 to be the base year?
Price index = 1 + 0.31 = 1.31
e. What was the real GNP in 2000?
Real GNP = 133.12 ÷ 1.31 = $101.62
If GNP increased from $80 billion in 1996 to
$133.12 billion in 2000,
RULE OF 70
PRICES DOUBLE IN
____________70_____________ YEARS ANNUAL
RATE OF INFLATION
EXAMPLE: IF THE ANNUAL RATE OF
INFLATION IS 14%, THEN PRICES WILL
DOUBLE IN 70 = 5 YEARS
14
59
TYPES OF INFLATION
DEMAND PULL INFLATION
COST PUSH INFLATION
WAGE PUSH VARIANT
PROFIT PUSH VARIANT
COMMODITY VARIANT
STRUCTURAL INFLATION
60