
ECN 212 Chapter 25, Spring 2007
Notre Dame University–Louaize · Principles of Macroeconomics · 65 pages · Mr. Hrair Hovivian
Showing the first 10 of 65 pages. Download the PDF to see all of it.
More ECN 212 files
- Problems Quest.&Answ. Chapter 5 Introduction to Macroeconomics · Spring 2012ChapterView
- Chapter 17 · Spring 2007ChapterView
- Chapter 19 · Spring 2007ChapterView
- Chapter 20 · Spring 2007ChapterView
- Chapter 21 · Spring 2007ChapterView
- Chapter 22 · Spring 2007ChapterView
- Chapter 1 · Spring 2007ChapterView
- Problems with Some Answers · Fall 2008Problems · with solutionView
Show the text of this chapter
Aggregate Demand, Aggregate
Supply, and Inflation
1
CHAPTER 25
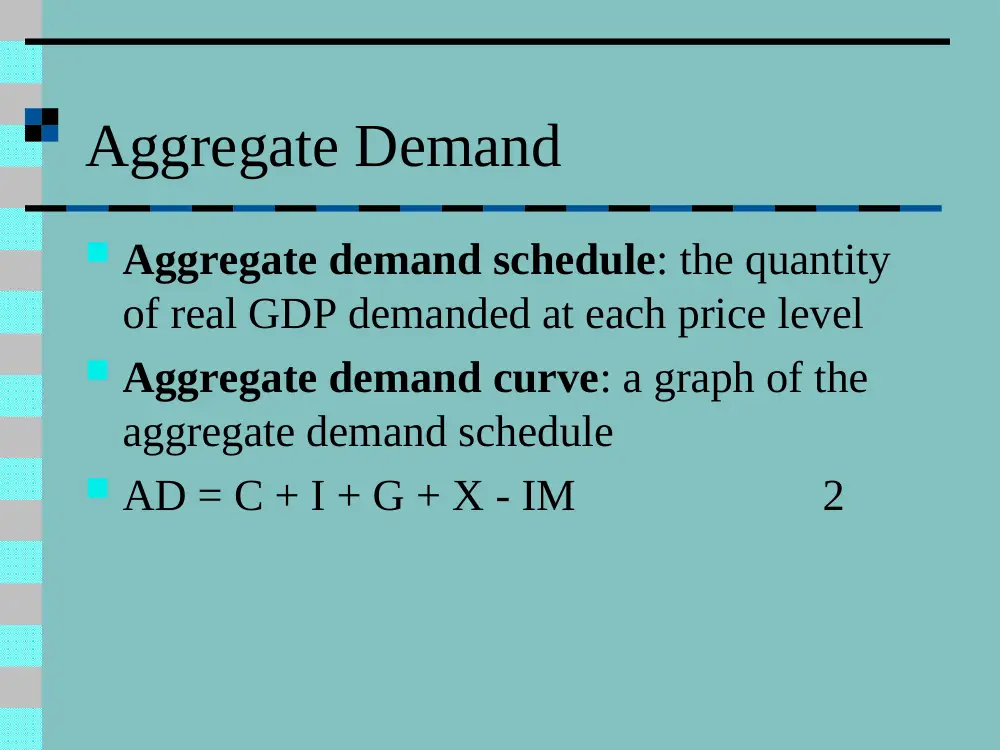
Aggregate Demand
Aggregate Demand
Aggregate demand schedule: the quantity
of real GDP demanded at each price level
Aggregate demand curve: a graph of the
aggregate demand schedule
AD = C + I + G + X - IM
2
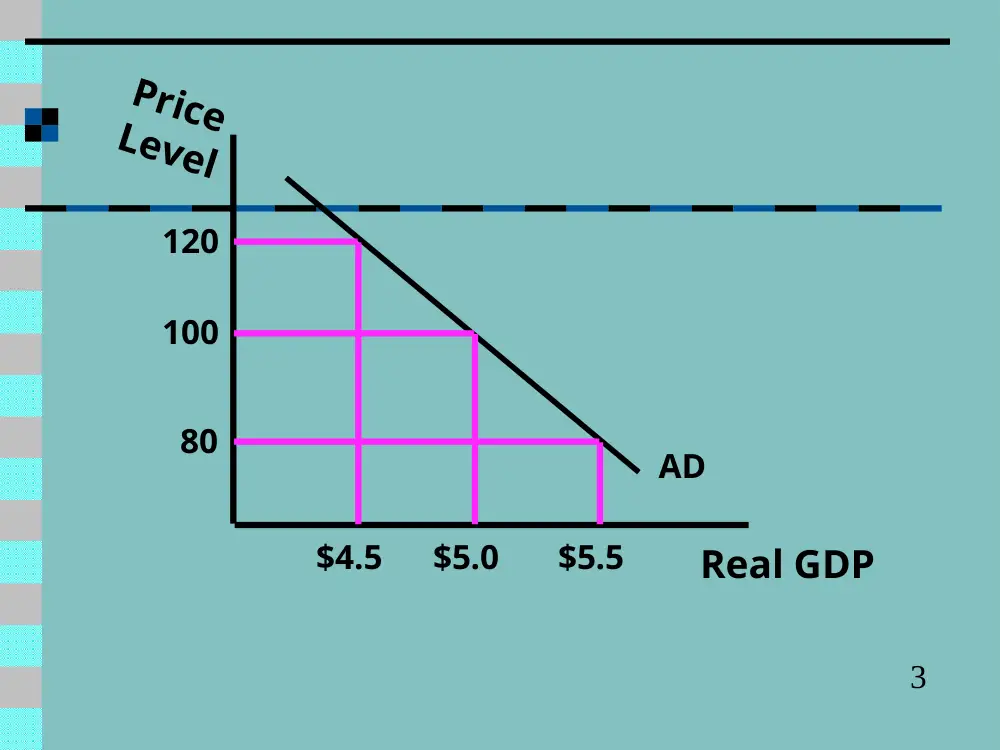
Price
Level
Real GDP
120
100
80
$4.5
$5.0
$5.5
AD
3
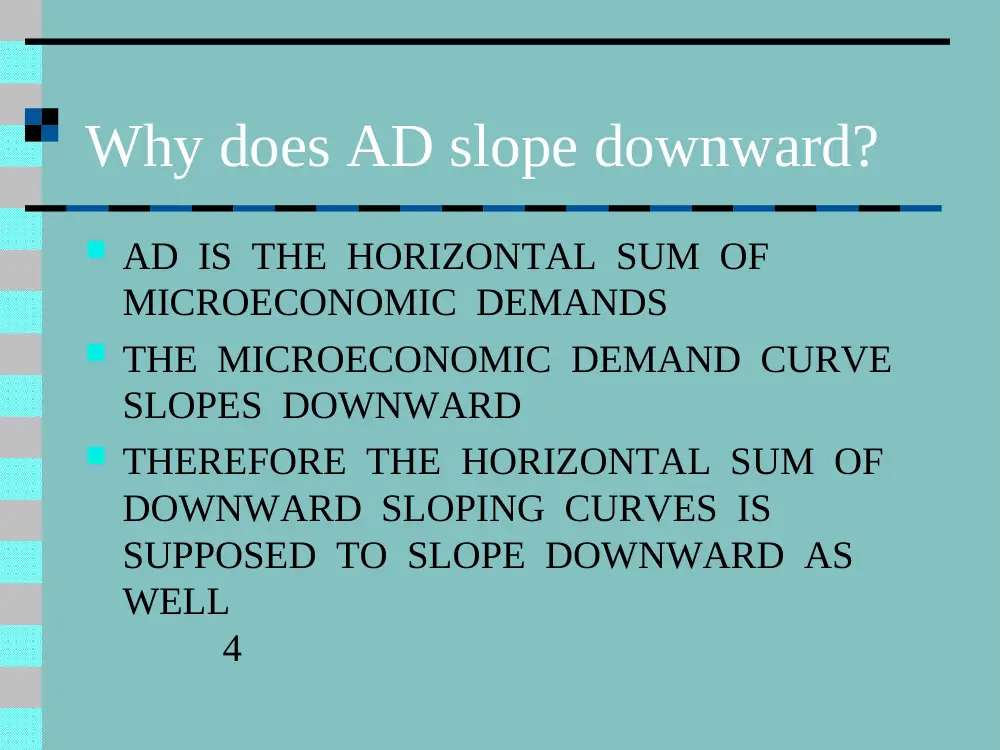
Why does AD slope downward?
AD IS THE HORIZONTAL SUM OF
MICROECONOMIC DEMANDS
THE MICROECONOMIC DEMAND CURVE
SLOPES DOWNWARD
THEREFORE THE HORIZONTAL SUM OF
DOWNWARD SLOPING CURVES IS
SUPPOSED TO SLOPE DOWNWARD AS
WELL
4
ALTHOUGH THE MACROECONOMIC AD
CURVE IS NEGATIVELY SLOPED
BECAUSE IT IS THE SUM OF
NEGATIVELY SLOPED MICROECONOMIC
DEMAND CURVES
YET THE REASONINGS BEHIND THE
NEGATIVE SLOPE OF MACRO-AD ARE
NOT THE SAME AS THAT OF MICRO-
DEMANDS
5
REASONINGS_BEHIND_THE
MICROECONOMIC_DEMAND
THE INCOME EFFECT
THE SUBSTITUTION EFFECT
6
THE_INCOME_EFFECT
AS PRICE RISES,
INCOMES_HELD_CONSTANT,
THE PURCHASING POWER OF THE
FIXED INCOMES FALLS,
PEOPLE DEMAND TO BUY LESS OF
ANY COMMODITY,
SO QUANTITY DEMANDED FALLS
7
SUBSTITUTION_EFFECT
AS THE PRICE OF A COMMODITY “A” RISES,
PRICES_OF_OTHER_GOODS_HELD_CONSTANT,
“A” SEEMS TO BE MORE EXPENSIVE THAN
OTHER GOODS,
SOME OF THE CUSTOMERS OF “A”
SUBSTITUTE OTHER GOODS FOR “A”,
BY BUYING LESS OF “A” AND MORE OF
OTHER GOODS,
AS A RESULT, QUANTITY DEMANDED OF “A”
FALLS
8
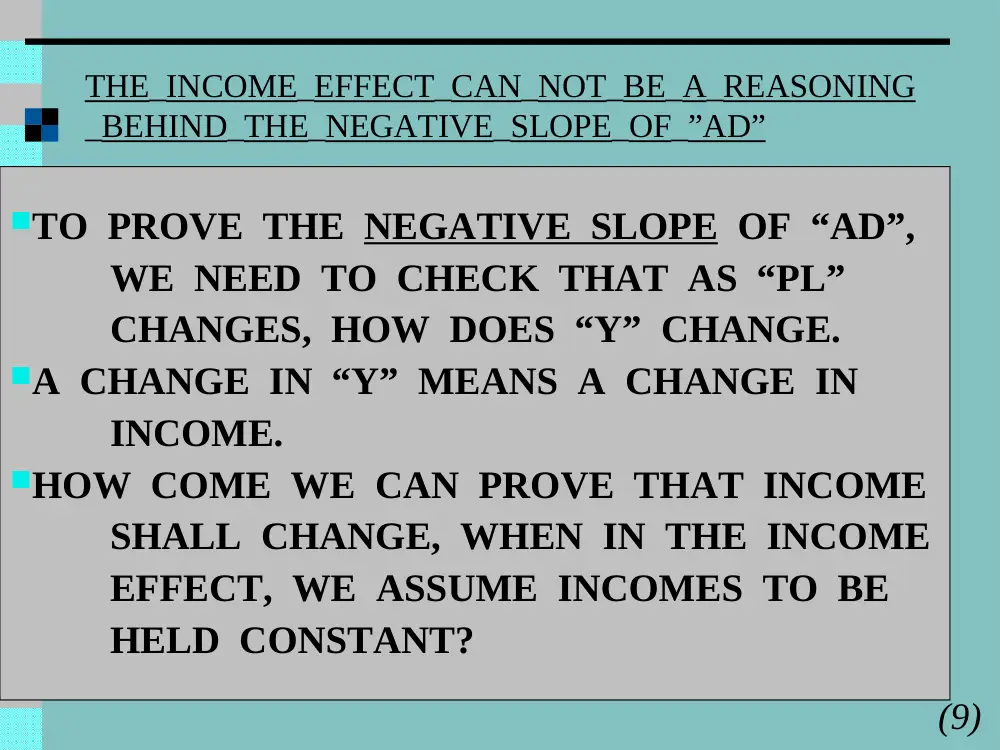
THE_INCOME_EFFECT_CAN_NOT_BE_A_REASONING
_BEHIND_THE_NEGATIVE_SLOPE_OF_”AD”
(9)
TO PROVE THE NEGATIVE SLOPE OF “AD”,
WE NEED TO CHECK THAT AS “PL”
CHANGES, HOW DOES “Y” CHANGE.
A CHANGE IN “Y” MEANS A CHANGE IN
INCOME.
HOW COME WE CAN PROVE THAT INCOME
SHALL CHANGE, WHEN IN THE INCOME
EFFECT, WE ASSUME INCOMES TO BE
HELD CONSTANT?
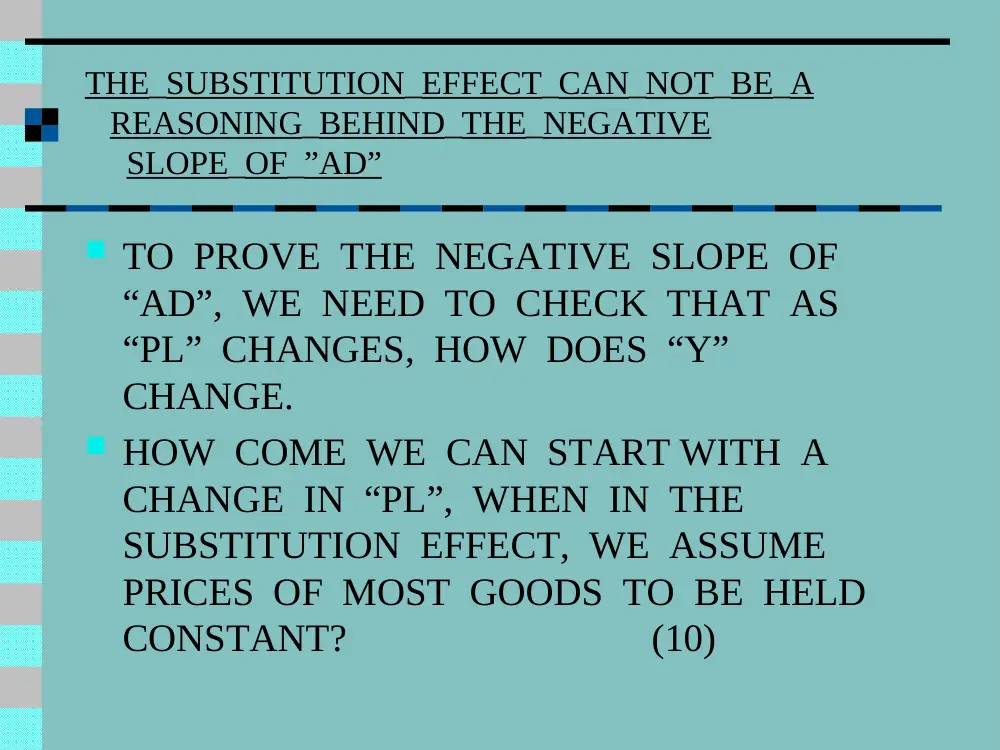
THE_SUBSTITUTION_EFFECT_CAN_NOT_BE_A
REASONING_BEHIND_THE_NEGATIVE
SLOPE_OF_”AD”
TO PROVE THE NEGATIVE SLOPE OF
“AD”, WE NEED TO CHECK THAT AS
“PL” CHANGES, HOW DOES “Y”
CHANGE.
HOW COME WE CAN START WITH A
CHANGE IN “PL”, WHEN IN THE
SUBSTITUTION EFFECT, WE ASSUME
PRICES OF MOST GOODS TO BE HELD
CONSTANT?
(10)
THE_RATIONALE_OF
DOWNSLOPING_”AD”
THE REASONINGS BEHIND THE
NEGATIVE SLOPE OF “AD” ARE
THE INTEREST RATE EFFECT
THE REAL BALANCES EFFECT
THE FOREIGN PURCHASES EFFECT
(11)
THE INTEREST RATE
EFFECT MONEY MARKET
i
$
SM
DM
i1
0
12
ASSUME A FIXED SUPPLY OF MONEY.
IF PRICE LEVEL
CONSUMERS’ NEED
FOR MONEY
PRODUCERS’ NEED
FOR MONEY
DM
i
13
MONEY MARKET
i
$
SM
DM
i1
0
14
DM’
i1’
AS i
PRODUCERS WOULD WISH TO
PRODUCE LESS, SINCE THEIR
COST AS INTEREST NOW IS >
RATE OF RETURN.
CONSUMERS WILL PREFER TO
DEPOSIT THEIR MONEY AND
EARN HIGH INTERESTS,
RATHER THAN BUYING.
REAL NATIONAL OUTPUT
15
REAL BALANCES EFFECT
AS “PL”
THE REAL VALUE OF ONE’S
WEALTH ( MONEY AT
BANK
AND
BONDS )
SPENDING
16
FOREIGN PURCHASES
EFFECT
AS “PL”
FOREIGN PRICE LEVELS
CONSTANT
CHEAPER PRICES OUTSIDE
IMPORTS AND EXPORTS
REAL NATIONAL OUTPUT
17
Which of the following is not a macro-economic reasoning?
a.
As prices fall, people substitute a commodity by
another.
b.
As prices rise, people substitute foreign goods for
locally produced goods.
c.
As prices fall the demand for money falls.
d.
All of the above.
e.
None of the above.
The correct answer is
“a”
The aggregate demand curve
a.
Shows the amount of spending required to entice
producers to produce various output levels.
b.
Is upward-sloping, showing that prices must rise to
cover higher costs of production.
c.
Is downward-sloping, showing that prices will
decrease because costs of production decline as
more is produced.
d.
Shows the amount of output that will be purchased
at different price levels.
e.
Shows none of the above.
The correct answer is
“d”
19
The negative slope of AD
a.
Is due to changes in purchasing power
b.
Is not due to changes in purchasing power
c.
Is due to substitution
d.
Has the same reasoning of the negative slope of
micro-economic demand
e.
None of the above
The correct answer is
“b”
What shifts the AD curve?
Recall : AD = C + I + G + X - IM
AD shifts rightward when:
C, I, G, or X increases
IM decreases
21
Price
Level
Real GDP
100
$4.5
$5.0
$5.5
AD
120
80
AD’
22
Leftward Shifts in AD
AD shifts leftward when:
C, I, G, or X decreases
IM increases
23
Price
Level
Real GDP
100
$4.5
$5.0
$5.5
AD
120
80
Price
Level
Real GDP
100
$4.5
$5.0
$5.5
AD
120
80
AD’
25
Aggregate Demand, Aggregate
Supply, and Inflation
Aggregate Supply
25
Aggregate Supply
Aggregate supply (AS): the
amount of goods firms are
willing to produce at a
particular price level
24
AGGREGATE SUPPLY
KEYNESIAN
CLASSICAL
INTERMEDIATE
AS
PL
Y
0
25
x
YFE
Y2’
Y1
Y2
PL1
c
a
b
• AN UNEMPLOYED,
WHEN EMPLOYED,
DOESN’T ASK FOR A
RAISE.
• WHEN WE DISCHARGE SOME WORKERS,
WE DO NOT REDUCE THE PAY OF THE
REMAINING.
29
CLASSICAL RANGE
AT FULL EMPLOYMENT, FIRMS WILL EXPAND
OUTPUT BY BIDDING RESOURCES AWAY
FROM OTHER FIRMS.
REAL NATIONAL OUTPUT IS THE OUTPUT OF
ALL FIRMS
FIRM “A” WILL EXPAND ITS OUTPUT, AT THE
EXPENSE OF A REDUCED OUTPUT BY FIRM
“B” NATIONAL OUTPUT SHALL
NOT CHANGE,
BUT RESOURCE PRICES SHALL RISE
PRICE LEVEL
30
INTERMEDIATE RANGE
NOT ALL INDUSTRIES REACH FULL
EMPLOYMENT AT THE SAME TIME
THE INFLATION THAT REACHES IN
THE INTERMEDIATE RANGE IS
KNOWN AS PREMATURE
INFLATION
31
AS
PL
Y
0
AD
A
Assume the economy is in
equilibrium at point A.
An increase in personal
income taxes would
a.
Increase the slope of the
aggregate demand curve.
b.
Decrease the slope of the
aggregate demand curve.
c.
Shift the aggregate
supply curve outward.
d.
Shift the aggregate demand curve to the right.
e.
Shift the aggregate demand curve to the left.
The correct answer is
“e”
T
F
On the aggregate supply curve, the vertical
range is the Keynesian range.
33
FALSE
If the general price level is above equilibrium, then
a.
The planned spending level is greater than the
planned production level and prices will rise.
b.
The planned spending level is greater than the
planned production level and prices will fall
c.
The planned production level is greater than the
planned spending level and prices will fall
d.
The planned production level is greater than the
planned spending level and prices will rise
e.
None of the above
The correct answer is “c”
34
The aggregate demand curve
a.
Is upward sloping, showing the relationship between the
general price level and the total spending level.
b.
Is downward sloping, showing the relationship between
the general price level and the total spending level.
c.
Is upward sloping, showing the relationship between the
general price level and the total quantity of goods and
services that will be produced.
d.
Is downward sloping, showing the relationship between
the general price level and the total quantity of goods and
services that will be produced.
e.
Can never be shifted either to the right or to the left.
35
An increase in aggregate demand will cause
a.
A recession
b.
The general price level to rise
c.
The general price level to decrease
d.
The national output level to decrease
e.
Our nation’s income to decrease
The correct answer is “b”
36
The aggregate supply curve shows the relation
between:
a.
Total output and the marginal costs of
production
b.
Total output and the price level
c.
Productivity and prices
d.
Inflation and unemployment
The correct answer is
“b”
37
END OF CHAPTER
Role of Input Prices
Input price: wages, rental rates, land-use
fees, etc.
Input prices help determine the shape and
location of the AS curve.
Input prices behave differently in the long
run than in the short run.
29
Role of Production Function
Production function: an expression that
determines how much output can be
produced given a certain amount of inputs
30
Real GDP
Labor Hours
100 hours
$1000
Production of Output
Real GDP
Labor Hours
100 hours
$1000
Input prices determine how
many hours of labor are used.
Input prices determine how
many hours of labor are used.
The production function determines
how much GDP gets produced.
The production function determines
how much GDP gets produced.
32
Short Run
Short Run: a period of time during which
input prices do not change
Increases in the price level lead to increases
in the quantity of output supplied.
33
Price
Level
Real GDP
100
$4.5
$5.0
$5.5
120
80
AS
Shifts in AS
Cost shocks
Economic growth
Lack of investment
Public policy
Weather, wars, natural disasters
Shifts in AS
Higher wage implies less output
Higher wage implies less output
AS shift leftward
AS shift leftward
Price
Level
Real GDP
100
$4.5
$5.0
$5.5
120
80
AS
Price
Level
Real GDP
100
$4.5
$5.0
$5.5
120
80
AS1
AS2
Shifts in AS
Lower wage implies more output
Lower wage implies more output
AS shift rightward
AS shift rightward
Price
Level
Real GDP
100
$4.5
$5.0
$5.5
120
80
AS
Price
Level
Real GDP
100
$4.5
$5.0
$5.5
120
80
AS1
AS2
Long Run
Long run: a period of time during which
input prices can change
Increases in the price level do not change
the quantity of output supplied
In the long run, there is full employment.
Long run aggregate
supply (LRAS)
is vertical
Price
Level
Real GDP
100
$4.5
$5.0
$5.5
120
80
LRAS
Price
Level
Real GDP
100
$4.5
$5.0
$5.5
120
80
LRAS
AS
Shifts in LRAS
Shifts occur as the capacity of the economy
to produce changes.
Example: decrease in the labor force
Shifts in LRAS
Shifts occur as the capacity of the economy
to produce changes.
Example: decrease in the labor force
Fewer workers means less output
Fewer workers means less output
LRAS and AS shift leftward
LRAS and AS shift leftward
Price
Level
Real GDP
100
$4.5
$5.0
$5.5
120
80
LRAS
AS
Price
Level
Real GDP
100
$4.5
$5.0
$5.5
120
80
LRAS
AS
Putting it Together:
Equilibrium
Equilibrium occurs when the quantity
demanded of GDP equals the quantity
supplied of GDP.
Price
Level
Real GDP
100
$4.5
$5.0
$5.5
120
80
AS
AD