
BUSS 230 Midterm, Fall 2001
American University of Beirut · Managerial Economics · 6 pages

More BUSS 230 files
- Midterm Solution · Fall 2013Exam · with solutionView
- Midterm · Fall 2013ExamView
- Midterm Review Questions Solution · Fall 2011Exam · with solutionView
- Midterm Review Questions · Fall 2011ExamView
- Midterm · Fall 2006ExamView
- Midterm · Fall 2005ExamView
- Midterm · Spring 2005ExamView
- Midterm · Spring 2004ExamView
Show the text of this exam
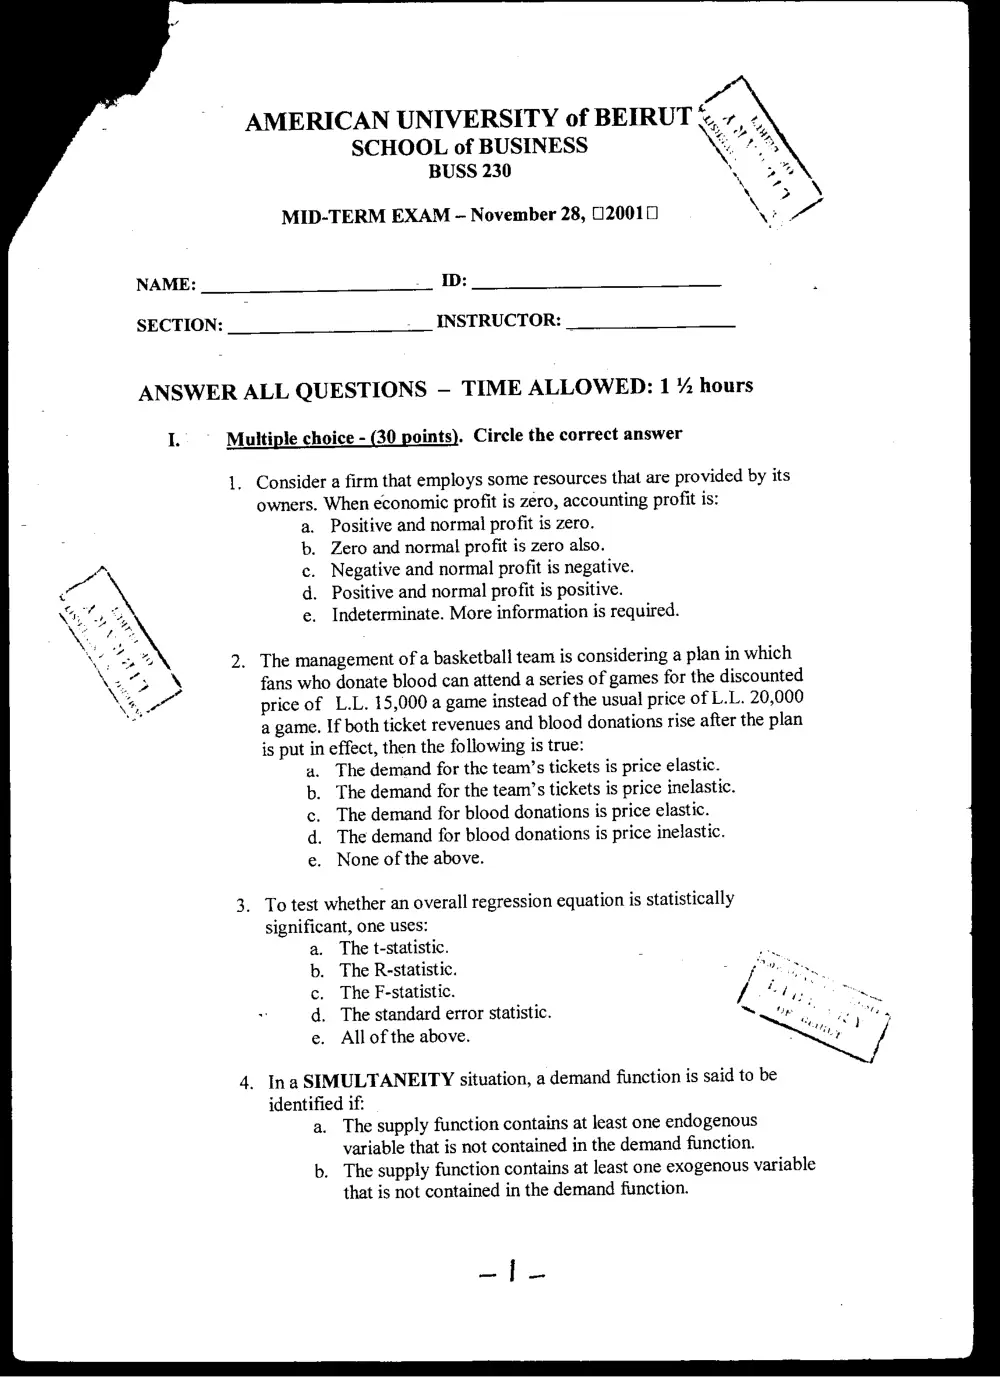
AMERICAN UNIVERSITY of BEIRUT %, 7, -
SCHOOL of BUSINESS Ka %
BUSS 230 0
MID-TERM EXAM - November 28, 020010
NAME: -.. ID:
SECTION: ___ INSTRUCTOR:
ANSWER ALL QUESTIONS — TIME ALLOWED: 1 % hours
I. Multiple choice - (30 points). Circle the correct answer
1. Consider a firm that employs some resources that are provided by its
owners. When economic profit is zero, accounting profit is:
. Positive and normal profit is zero.
. Zero and normal profit is zero also.
. Negative and normal profit is negative.
. Positive and normal profit is positive.
_ Indeterminate. More information is required.
. The management of a basketball team is considering a plan in which
fans who donate blood can attend a series of games for the discounted
price of L.L. 15,000 a game instead of the usual price of L.L. 20,000
a game. If both ticket revenues and blood donations rise after the plan
is put in effect, then the following is true:
a. The demand for the team’s tickets is price elastic.
. The demand for the team’s tickets is price inelastic.
. The demand for blood donations is price elastic.
_ The demand for blood donations is price inelastic.
. None of the above.
_ To test whether an overall regression equation is statistically
significant, one uses:
. The t-statistic.
. The R-statistic.
. The F-statistic.
. The standard error statistic.
. All ofthe above.
. Ina SIMULTANEITY situation, a demand function is said to be
identified if:
a. The supply function contains at least one endogenous
variable that is not contained in the demand function.
b. The supply function contains at least one exogenous variable
that is not contained in the demand function.
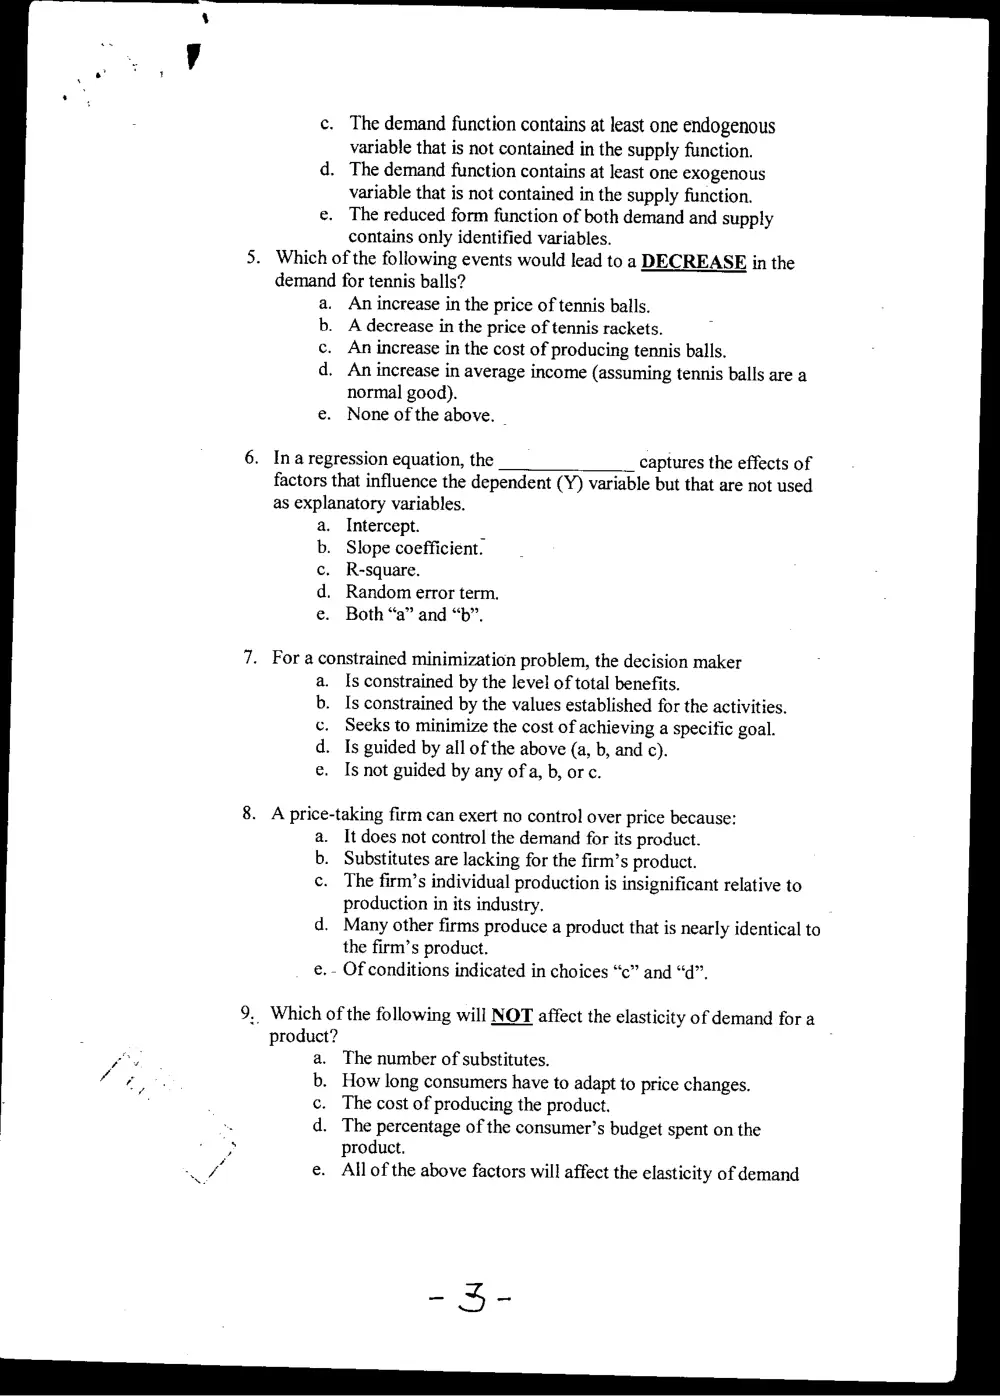
—|—
The demand function contains at least one endogenous
variable that is not contained in the supply function.
. The demand function contains at least one exogenous
variable that is not contained in the supply function.
e. The reduced form function of both demand and supply
contains only identified variables.
. Which of the following events would lead to a DECREASE in the
demand for tennis balls?
a. An increase in the price of tennis balls.
b. A decrease in the price of tennis rackets.
c. An increase in the cost of producing tennis balls.
d
. An increase in average income (assuming tennis balls are a
normal good).
e. None of the above.
. Ina regression equation, the captures the effects of
factors that influence the dependent (Y) variable but that are not used
as explanatory variables.
Intercept.
Slope coefficient.
. R-square.
. Random error term.
Both “a” and “b”.
. Fora constrained minimization problem, the decision maker
Is constrained by the level of total benefits.
. Is constrained by the values established for the activities.
-. Seeks to minimize the cost of achieving a specific goal.
. Is guided by all of the above (a, b, and c).
Is not guided by any of a, b, orc.
. A price-taking firm can exert no control over price because:
a. It does not control the demand for its product.
b. Substitutes are lacking for the firm’s product.
c. The firm’s individual production is insignificant relative to
production in its industry.
d. Many other firms produce a product that is nearly identical to
the firm’s product.
e. - Of conditions indicated in choices “c” and “d”.
.. Which of the following will NOT affect the elasticity of demand for a
product? :
The number of substitutes.
. How long consumers have to adapt to price changes.
. The cost of producing the product.
. The percentage of the consumer’s budget spent on the
product.
All of the above factors will affect the elasticity of demand
-4-
10, In order to minimize the net loss to society from air pollution, the level
of pollution should be:
Zero.
b. The level at which the marginal benefit from pollution equals
the marginal cost of pollution.
c. The level at which the total benefit from pollution equals the
total cost of pollution.
d. The level at which the marginal benefit from pollution equals
the marginal cost of pollution reduction.
e. The level at which the total benefit from pollution equals the
total cost of pollution reduction.
11. The method of two-stage least squares (2SLS) is used in preference to
ordinary Jeast squares (OLS):
a. When none of the functions to be estimated is identified.
b. When the demand and supply functions do not change.
c. When the exogenous variables are common to the demand
and supply functions.
d. Allof the above (a, b, and c).
e. None of the above (a, b, or c).
12. Assume that scientists have developed bacteria that will lower the
freezing point of agricultural products. This invention could save
farmers billions a year in crops now lost to frost damage. If this
invention becomes widely used, what would happen to equilibrium
price and quantity in, for example, the potato market?
Price will decrease and quantity will decrease.
Price will decrease but quantity will increase.
Price will increase but quantity will decrease.
Price will increase as will quantity.
The change in equilibrium price and quantity is
indeterminate.
ene se
13. When Marginal Revenue is positive,
a. Demand is elastic.
b. Marginal revenue is greater than price.
c. Lowering price will lower total revenue.
d. Raising price will raise total revenue.
e. The demand curve is a linear function.
14, When the choice variable changes in discrcte amounts, the decision
rule for an unconstrained maximization situation is:
a. IfMB> MC, increase the activity.
b. IfMB < MC, decrease the activity.
c, Choose the activity so that the net benefit is zero.
d. All ofthe above.
e. None of a, b, orc.
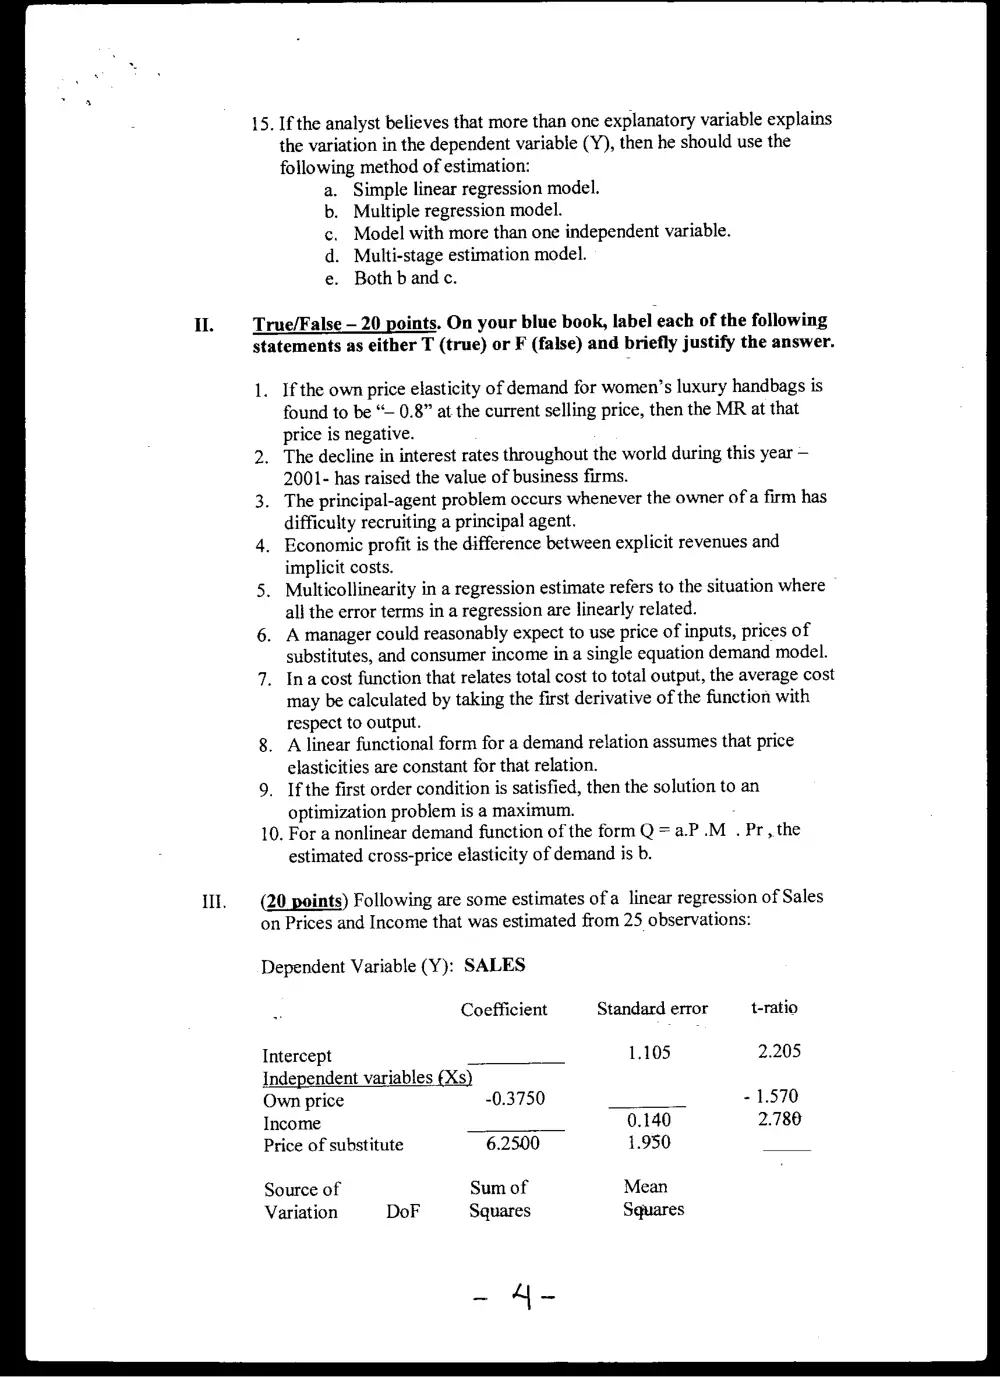
15. If the analyst believes that more than one explanatory variable explains
the variation in the dependent variable (Y), then he should use the
following method of estimation:
Simple linear regression model.
Multiple regression model.
Model with more than one independent variable.
. Multi-stage estimation model.
Both b and c.
True/False — 20 points. On your blue book, label each of the following
statements as either T (true) or F (false) and briefly justify the answer.
1. Ifthe own price elasticity of demand for women’s luxury handbags is
found to be “— 0.8” at the current selling price, then the MR at that
price is negative.
. The decline in interest rates throughout the world during this year —
2001- has raised the value of business firms.
. The principal-agent problem occurs whenever the owner of a firm has
difficulty recruiting a principal agent.
. Economic profit is the difference between explicit revenues and
implicit costs.
. Multicollinearity in a regression estimate refers to the situation where —
all the error terms in a regression are linearly related.
. A manager could reasonably expect to use price of inputs, prices of
substitutes, and consumer income in a single equation demand model.
. Inacost function that relates total cost to total output, the average cost
may be calculated by taking the first derivative of the function with
respect to output.
. A linear functional form for a demand relation assumes that price
elasticities are constant for that relation.
9. Ifthe first order condition is satisfied, then the solution to an
optimization problem is a maximum.
10. For a nonlinear demand function of the form Q = a.P M. Pr , the
estimated cross-price elasticity of demand is b.
(20 points) Following are some estimates of a linear regression of Sales
on Prices and Income that was estimated from 25 observations:
Dependent Variable (Y): SALES
Coefficient Standard error t-ratio
Intercept 1.105 2.205
Independent variables (Xs)
Own price -0.3750 - 1.570
Income 0.140 2.780
Price of substitute 6.2500 1.950
Source of Sum of Mean
Variation DoF Squares Squares
-~ A-
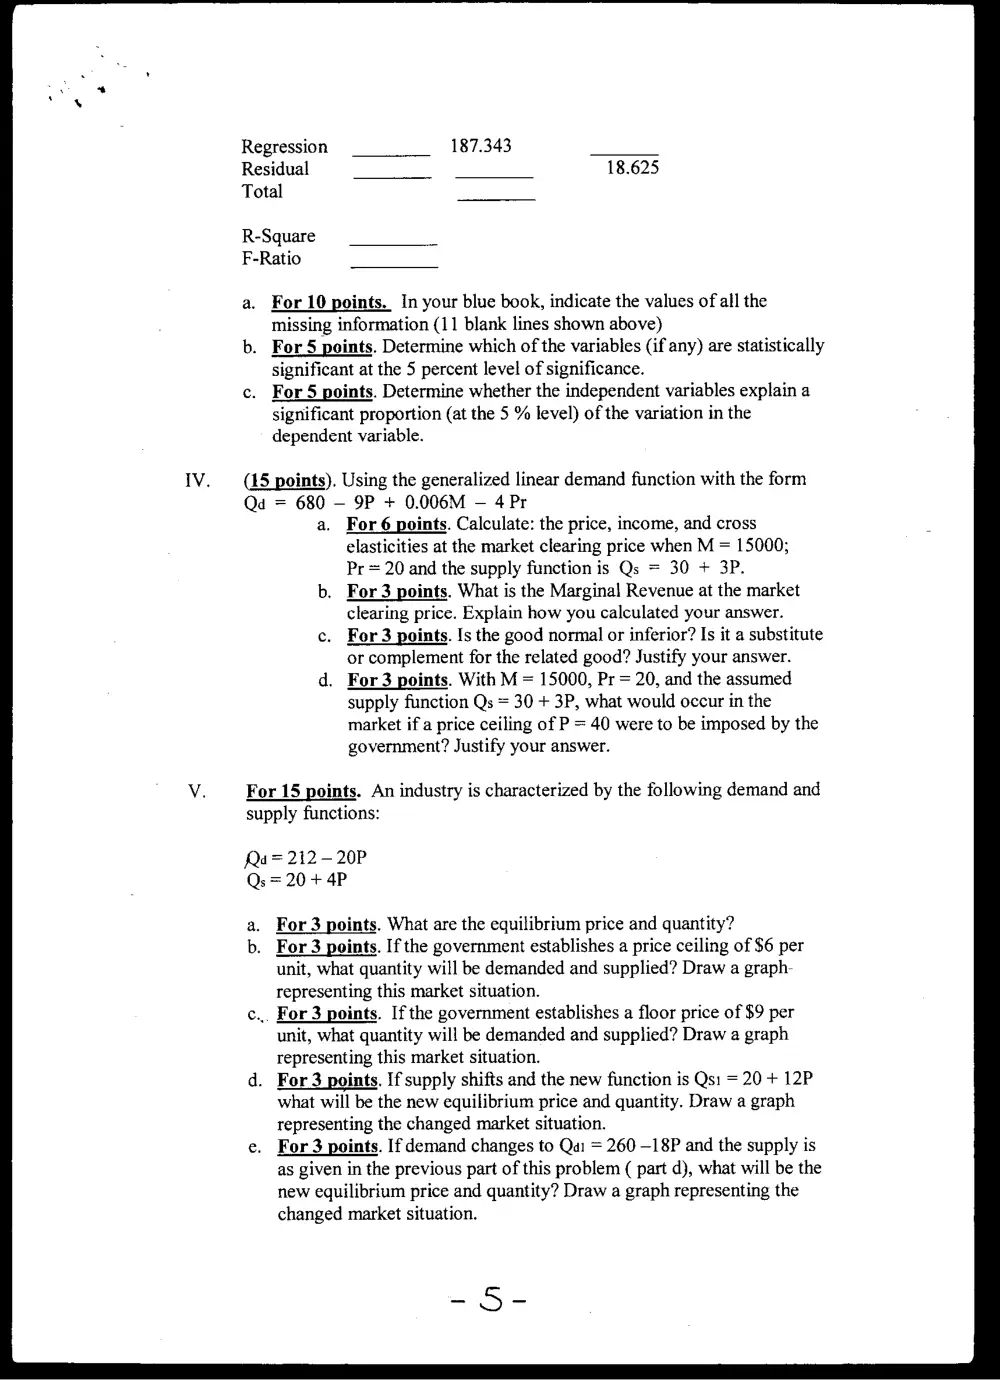
Regression 187.343
Residual
Total
R-Square
F-Ratio
a. For 10 points. In your blue book, indicate the values of all the
missing information (11 blank lines shown above)
b. For 5 points. Determine which of the variables (if any) are statistically
significant at the 5 percent level of significance.
c. For 5 points. Determine whether the independent variables explain a
significant proportion (at the 5 % level) of the variation in the
dependent variable.
(15 points). Using the generalized linear demand function with the form
Qd = 680 — 9P + 0.006M — 4Pr
a. For 6 points. Calculate: the price, income, and cross
elasticities at the market clearing price when M = 15000;
Pr = 20 and the supply function is Qs = 30 + 3P.
b. For3 points. What is the Marginal Revenue at the market
clearing price. Explain how you calculated your answer.
c. For3 points. Is the good normal or inferior? Is it a substitute
or complement for the related good? Justify your answer.
d. For3 points. With M = 15000, Pr = 20, and the assumed
supply function Qs = 30 + 3P, what would occur in the
market if a price ceiling of P = 40 were to be imposed by the
government? Justify your answer.
For 15 points. An industry is characterized by the following demand and
supply functions:
Qa =212-20P
Qs = 20 + 4P
a. For 3 points. What are the equilibrium price and quantity?
b. For 3 points. If the government establishes a price ceiling of $6 per
unit, what quantity will be demanded and supplied? Draw a graph-
representing this market situation.
... For 3 points. If the government establishes a floor price of $9 per
unit, what quantity will be demanded and supplied? Draw a graph
representing this market situation.
. For3 points. If supply shifts and the new function is Qs: = 20 + 12P
what will be the new equilibrium price and quantity. Draw a graph
representing the changed market situation.
. For3 points. If demand changes to Qai = 260 —18P and the supply is
as given in the previous part of this problem ( part d), what will be the
new equilibrium price and quantity? Draw a graph representing the
changed market situation.
-~-S-
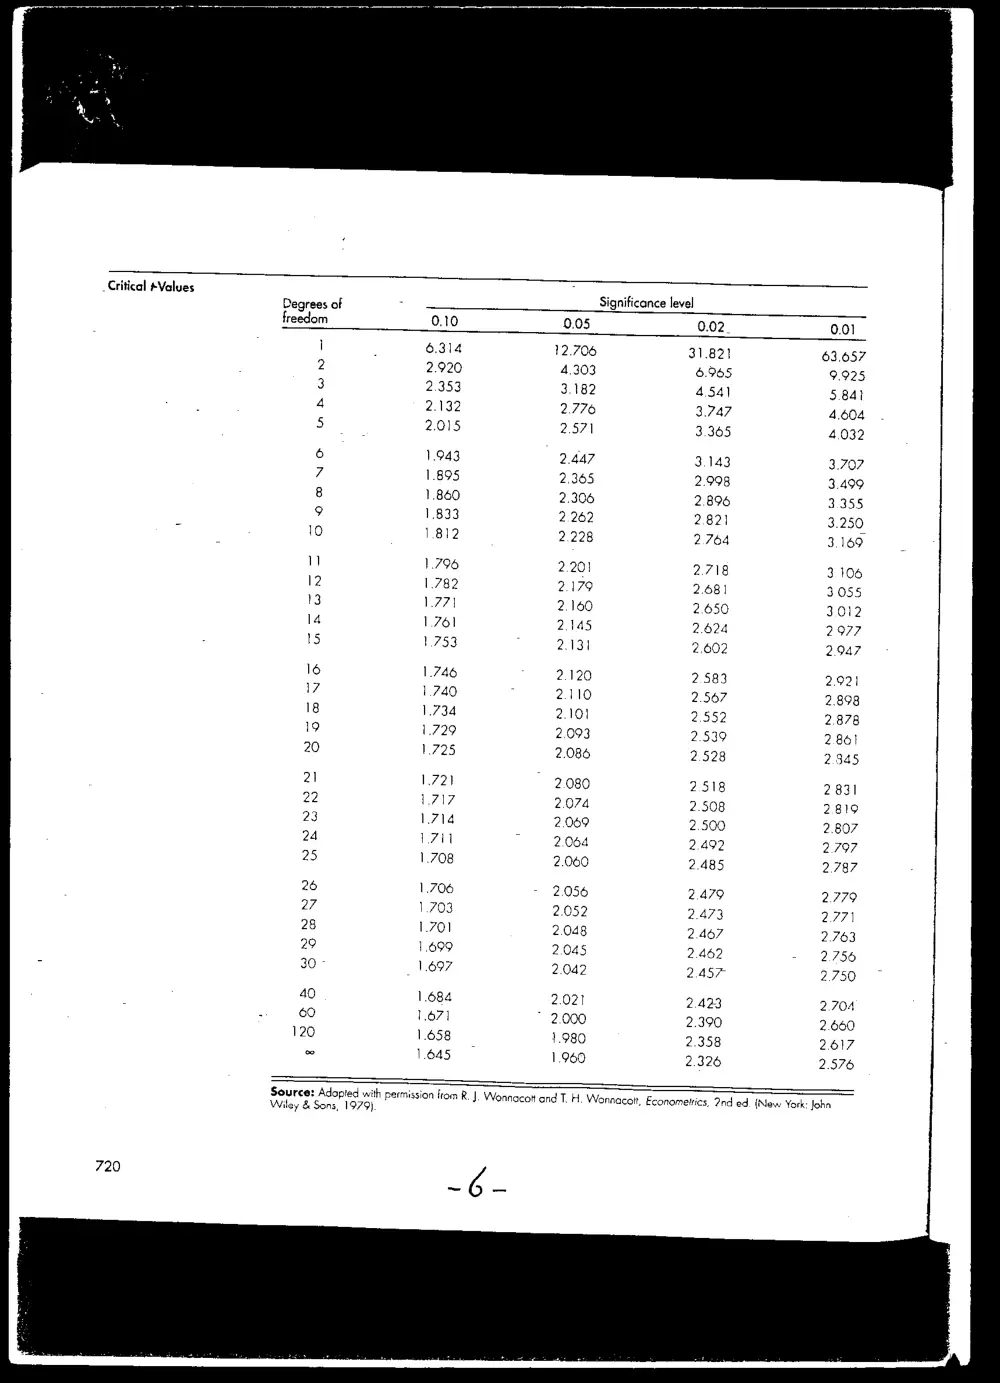
- Critical #Values Significance level
Degrees of
freedom . 0.05 0.02.
12.706 31.82}
4.303 6.965
3.182 454)
2.776 3.747
2.571 3.365
2.447 3.143
2.365 2.998
2.306 2.896
2.262 2.82)
2.228 2.764
2.201 2.718
2.179 2.681
2.160 2.650
2.145 2.624
2.131 2.602
2.120 2.583
2.110 2.567
2.101 2.552
2.093 2.539
2.086 2.528
2.080 2.518
2.074 2.508
2.069 2.500
2.064 2.492
2.060 2.485
2.056 2.479
2.052 2.473
2.048 2.467
2.045 2.462
2.042 2.457
2.021 2.423
~ 2.000 2.390
4.980 2.358
1.960 2.326
Source: Adopted with permission from J. Wonnacott and T. H. Wonnacott, Econometrics, 2nd ed. (New York: John
Wiley & Sons, 1979)
~6-